The most damaging thing about an electricity supply isn't how much you use — it's how clean it is. A voltage sag lasting a fraction of a second trips a sensitive drive and halts a production line; harmonic distortion from the plant's own VFDs quietly overheats motors and transformers; a microsecond transient does invisible cumulative damage to electronic controls until one resets for no apparent reason. None of it shows on a consumption meter, and much of it never gets diagnosed — the line trips, someone resets it, and the real cause goes unrecorded until it happens again. Yet electrical disturbances account for more than 30 percent of unplanned equipment failures, voltage sags are the single most frequent cause of industrial downtime, and poor power factor and excess harmonics can trigger utility penalties on top of the damage. Power quality monitoring makes the invisible visible: it continuously tracks voltage sags, swells, transients, harmonics, imbalance, and power factor, timestamps every disturbance, and tells you whether it came from the grid or from inside your own walls. That's the difference between chasing mystery trips and fixing their root cause. To see power quality monitoring on your plant, book a demo.
MANUFACTURING · POWER QUALITY MONITORING
Catch the Voltage Sags, Harmonics, and Transients a Consumption Meter Never Sees.
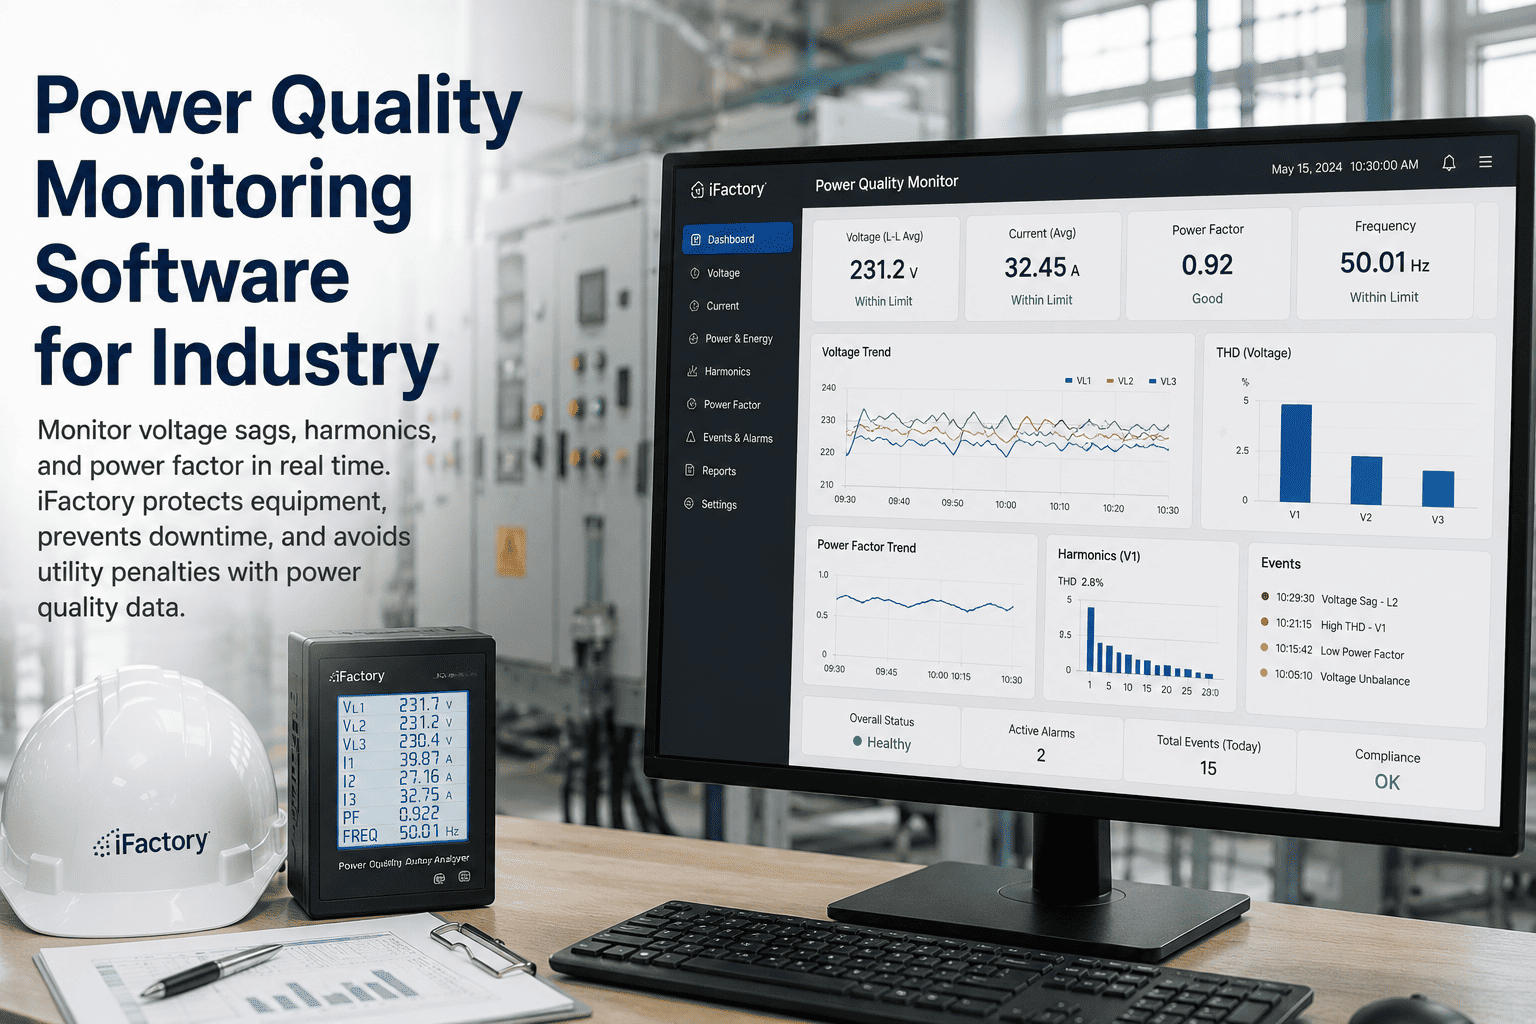
Bad power trips lines, overheats motors, damages electronics, and draws utility penalties — and none of it shows on a kWh meter. iFactory's power quality monitor tracks voltage sags, swells, transients, harmonics, imbalance, and power factor in real time, timestamps every disturbance, and pinpoints whether it originated on the grid or inside your plant — protecting equipment and ending the cycle of mystery trips.
>30%
Of unplanned equipment failures tied to electrical disturbances
#1 cause
Voltage sags — the most frequent source of downtime
5% THD
IEEE 519 voltage-distortion limit at the common coupling point
~80%
Of transients typically generated inside the facility
Why Bad Power Hides — and Costs
Power quality is the measurable boundary between acceptable electrical variation and operational risk. Ideally voltage and current stay sinusoidal and within tolerance; in a real plant, motor starts, nonlinear loads, switching events, and utility faults push them outside those limits constantly — and when they do, equipment misoperation, overheating, and protection failures follow. The problem is that these disturbances are fast, intermittent, and invisible to the instruments most plants have. A consumption meter reports energy, not waveform integrity, so the sag that tripped the line and the harmonics cooking a transformer simply don't register until the failure does.
Consumption Meters Don't See It
A kWh meter measures how much energy flowed, not whether the voltage dipped for three cycles or the current waveform is distorted. Power quality lives in the shape and stability of the waveform, which conventional metering doesn't capture — so the disturbances that damage equipment are entirely absent from the data most plants collect.
Disturbances Are Fast and Intermittent
A voltage sag lasts from half a cycle to a minute; a transient is gone in microseconds. These events are far too fast for a person to observe and too intermittent for a periodic check to reliably catch, so a fault that trips a line once a week can go undiagnosed for months because nothing was watching at the instant it happened.
The Symptom Hides the Cause
The plant sees the symptom — a nuisance trip, a flickering light, an unexplained equipment reset — but not the electrical event behind it. Without waveform data timestamped to the event, the line just gets reset and the real cause goes unrecorded, so the same disturbance keeps recurring with no path to a fix.
The Damage Is Cumulative and Costly
Transients are silent killers that degrade digital components a little at a time, and sustained harmonics overheat motors and transformers until insulation fails early. Electrical disturbances drive over 30 percent of unplanned equipment failures, and much of that cost is preventable — but only if the disturbances are seen before the damage accumulates.
When the power-quality boundary is misread, the failure mode is rarely isolated — a distortion problem that looks minor at one point can be amplified by downstream resonance into equipment misoperation elsewhere. That's why continuous, plant-wide waveform visibility matters: the event that trips a drive on one line may have originated at a load two panels away.
The Disturbances It Monitors
Power quality isn't one problem but a family of distinct disturbances, each with its own cause, signature, and damage mode. A monitor has to track all of them continuously, because the one it isn't watching is the one that takes the line down. These are the disturbances that matter in a manufacturing plant.
VOLTAGE SAGS & SWELLS
The #1 downtime cause
A voltage sag is a short-duration drop to between 10 and 90 percent of nominal, lasting from half a cycle to a minute — the most frequently reported disturbance in industrial surveys and the single most common cause of immediate downtime, because it trips sensitive drives and protection relays mid-production. Sags come from motor starting and fault clearing on feeders; swells are the opposite, brief overvoltages from sudden load rejection or capacitor-bank switching. Monitoring captures each event's depth and duration, which is what lets you match a trip to its cause and evaluate whether mitigation like a dynamic voltage restorer would pay.
HARMONICS & THD
The heat that ages equipment
Harmonics are integer multiples of the fundamental frequency injected by nonlinear loads — VFDs, rectifiers, and switch-mode power supplies that convert AC to DC — and they distort the current and voltage waveform, quantified as total harmonic distortion. Excess THD overheats motors and transformers, stresses insulation, and can cause protection misoperation; a documented case of distortion above 8 percent THD drove transformer overheating. Continuous harmonic monitoring tracks THD against the IEEE 519 limits and pinpoints which nonlinear load is the source, so a filter is placed where it actually helps.
TRANSIENTS
The silent killers
Transients are sudden high-frequency spikes lasting only microseconds, caused by lightning and by switching operations, and they can reach kilovolt amplitudes that damage insulation and sensitive electronics in an instant — or, more insidiously, degrade digital components cumulatively over time until one fails without an obvious trigger. Because roughly 80 percent of transients are generated inside the facility by the plant's own switching, capturing sub-cycle events is what reveals the internal source and lets targeted surge protection be applied where the transients actually originate.
IMBALANCE & FLICKER
Uneven load & fluctuation
Voltage unbalance arises in three-phase systems with unequal loading, and even a few percent of unbalance sharply raises motor heating and shortens motor life — one of the most common and most preventable causes of premature motor failure. Flicker is rapid repetitive voltage fluctuation below 25 Hz, produced by arc furnaces and large welding loads, visible as lighting variation and a sign of a load stressing the supply. Monitoring both surfaces the load-distribution and heavy-load problems that erode reliability quietly, before they become motor burnouts or supply-stability complaints.
End the Cycle of Mystery Trips
Bring the line that keeps tripping or the transformer that runs hot. iFactory engineers will show how continuous power quality monitoring captures the sag, the harmonic, or the transient behind it, timestamps it to the event, and identifies whether the source is the grid or your own plant.
Grid or Plant? Pinpointing the Source
One of the most valuable things power quality monitoring does is answer a question that otherwise starts an argument: did the disturbance come from the utility or from inside the facility? Capturing a complete power quality profile at the point of use lets engineers locate the source precisely — and that answer drives both the fix and the accountability.
FACILITY-SIDE
Most Disturbances Are Self-Inflicted
A large share of a plant's power quality problems are generated internally — roughly 80 percent of transients come from the facility's own switching, harmonics come from its own nonlinear loads, and sags often come from its own large motor starts. Monitoring at multiple points isolates which load or panel is the source, so the fix is targeted at the offending equipment rather than blamed on the grid. This is where most of the recoverable reliability actually lives, because it's within the plant's control to correct.
UTILITY-SIDE
Evidence for the Utility Conversation
When the disturbance does originate on the grid, timestamped waveform capture at the service entrance is the evidence that proves it — turning "our line tripped and we think it was you" into a documented sag event with depth, duration, and time. That record supports a service-quality claim with the utility and justifies mitigation investment, and it protects the plant from spending on internal fixes for a problem that isn't internal. The data settles the question instead of leaving it to blame.
Automatic event classification speeds this up dramatically. Instead of an engineer manually poring over waveforms, the monitor classifies each sag, swell, transient, and harmonic event and flags its likely origin — so root-cause diagnosis that once took days of investigation becomes an answer available the moment the event is captured.
Protecting Equipment and Uptime
The payoff of seeing disturbances is preventing the damage and downtime they cause. Because so much of the harm is cumulative and so much of the downtime traces to a handful of disturbance types, continuous monitoring converts directly into protected assets and fewer stoppages.
01
Fewer Sag-Driven Line Trips
Since voltage sags are the most frequent cause of downtime, identifying them and their sources enables targeted mitigation — ride-through settings, dynamic voltage restorers, or sequencing large motor starts. Deployments pairing monitoring with mitigation have cut sag-related downtime dramatically, turning the most common trip cause into a managed one.
02
Longer Motor and Transformer Life
Tracking harmonics and voltage unbalance catches the conditions that overheat motors and transformers and shorten their life, so the distortion or the unbalanced load is corrected before insulation fails early. Protecting these assets from slow electrical stress is a direct, if quiet, reliability and capital saving.
03
Electronics Shielded From Transients
Locating where transients originate lets surge protection be applied at the real source, shielding sensitive drives, PLCs, and controllers from the cumulative damage that causes unexplained resets and premature electronic failure. Stopping the silent killer at its source protects the plant's most fragile and expensive controls.
04
Root Cause, Not Repeat Repairs
Because every disturbance is captured and classified, a recurring trip finally has a diagnosed electrical cause instead of a reset-and-hope response — ending the cycle of reactive repairs on a fault nobody could see. Insurance studies suggest about half of electrical-failure cost is preventable with the visibility that regular monitoring provides.
Standards, Compliance, and Penalties
Power quality is governed by measurable standards, and monitoring is what proves a facility meets them — both to avoid utility penalties and to satisfy the compliance frameworks that increasingly require granular electrical data. The relevant boundaries are well defined, and staying inside them is a documentation problem monitoring solves.
IEEE 519 — Harmonic Limits
IEEE 519 sets harmonic-distortion limits for industrial systems, commonly evaluating total harmonic distortion against a 5 percent voltage threshold at the point of common coupling. Continuous monitoring documents harmonic contribution against this limit, proving compliance and flagging when a nonlinear load pushes the facility over.
IEC 61000-4-30 — Measurement
IEC 61000-4-30 defines how power quality parameters must be measured for the results to be trustworthy and comparable. Monitoring to this standard ensures the sag, harmonic, and flicker data is credible enough to locate disturbance sources and evaluate whether mitigation actually worked.
Power Factor Penalties
Utilities penalize a facility whose power factor falls below roughly 0.95, and reactive-power monitoring surfaces the penalty and its source so correction can be targeted. Power factor sits at the intersection of power quality and cost, since the same reactive load that draws a penalty also inflates the demand the plant is billed on.
Toward Continuous Monitoring
Current guidance encourages moving from periodic audits toward permanent, continuous monitoring for total visibility, because a short-term audit every 12 to 18 months misses the intermittent glitches that continuous capture catches. Standing monitoring is becoming the expected practice, not the exception.
The shift from audit to always-on is the central trend. A baseline audit is still valuable, but an intermittent disturbance that trips a line once a month will rarely occur during the window an auditor is on site — so the guidance now points toward permanent monitoring that catches the event whenever it happens, not only when someone is looking.
Integrated With Energy and Maintenance
Power quality monitoring is most powerful when it's not a standalone box but part of the same platform that watches energy and drives maintenance — because a power quality event is often both an energy issue and an equipment-health warning, and acting on it should be one workflow.
1
Reads Existing Meters and Analyzers
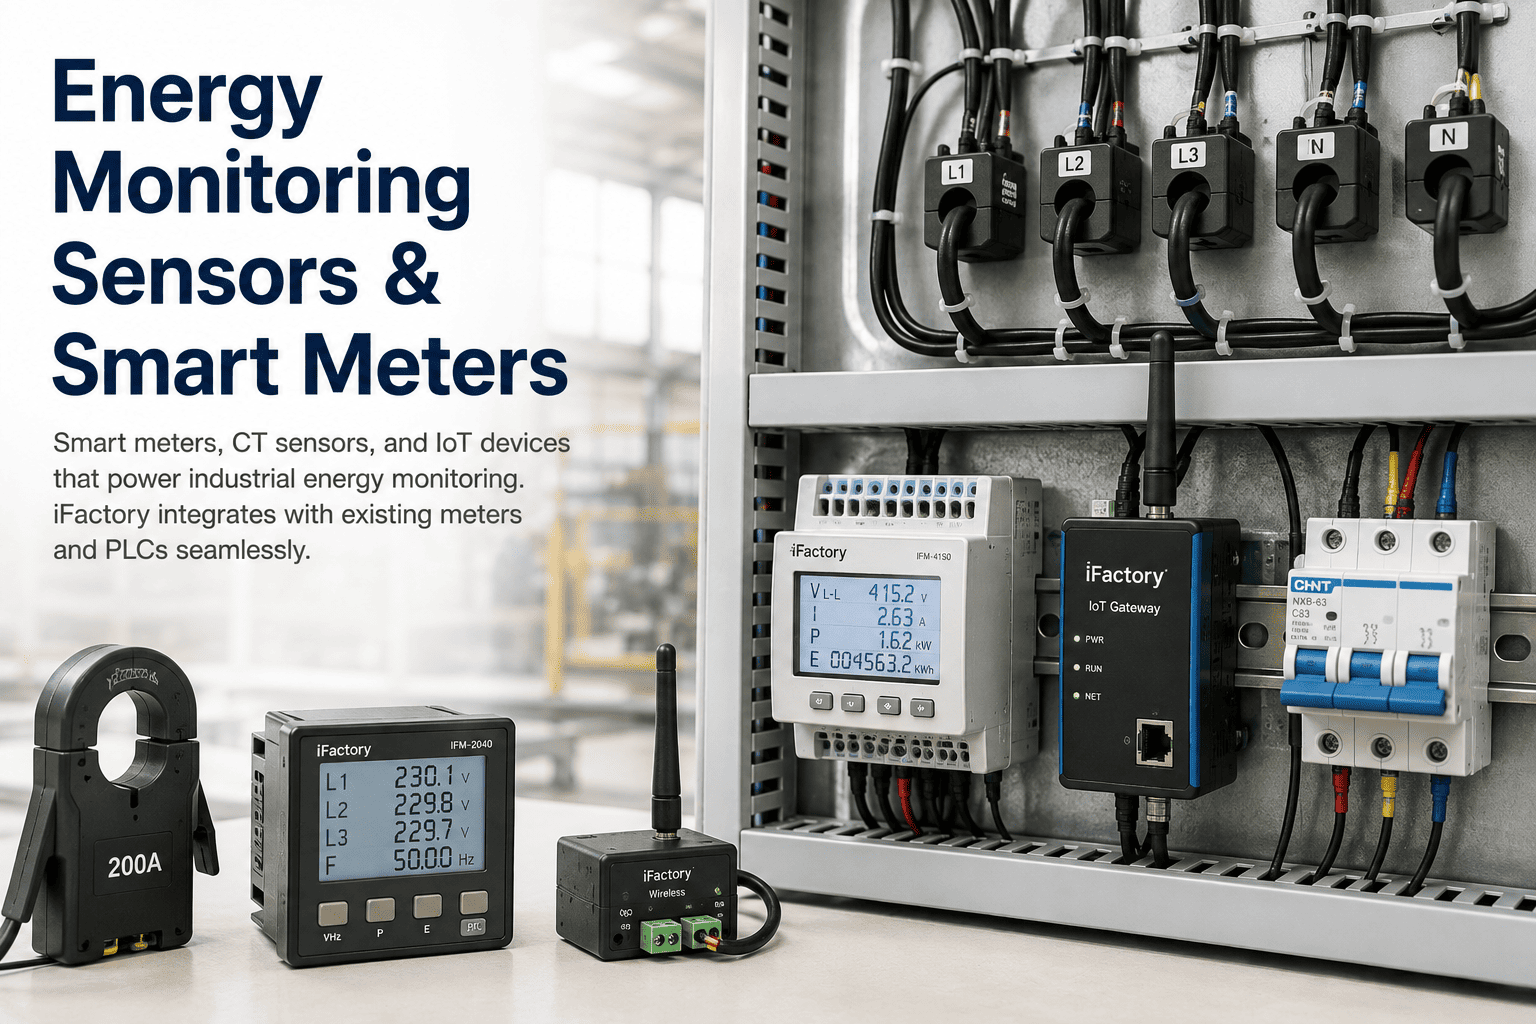
The platform ingests power quality data from the meters, power quality analyzers, and protection relays already capable of capturing it, through standard protocols — reading waveform and event data from existing hardware where it exists and adding monitoring points only where a gap leaves a critical bus unwatched.
2
Classifies and Timestamps Every Event
Sags, swells, transients, harmonics, imbalance, and flicker are captured, automatically classified, and timestamped, so each disturbance is a diagnosed, dated record with its likely origin attached — not a raw waveform an engineer has to interpret from scratch.
3
Correlates With Energy and Equipment Data
Because power quality sits alongside consumption and equipment-health data on one platform, a harmonic problem can be linked to the rising energy and temperature of the load causing it, and a sag to the trip it triggered — turning separate signals into one connected diagnosis.
4
Triggers the Work Order
A significant or recurring power quality event generates a maintenance work order with the classified event and its source attached, so the fix — a filter, a surge device, a rebalanced load, a mitigation study — is routed into the maintenance workflow instead of lost after the line is reset.
What Changes for the Plant
Power quality monitoring turns the electrical supply from an unmanaged risk into a monitored, documented, and defensible variable — with effects on uptime, equipment life, and cost at once.
01
Mystery Trips Get a Diagnosis
Every sag, transient, and harmonic event is captured and classified, so the recurring line trip nobody could explain finally has a dated, sourced electrical cause — replacing reset-and-hope with a fix that actually stops the recurrence.
02
Equipment Lasts Longer
Catching the harmonics, unbalance, and transients that overheat and degrade motors, transformers, and electronics lets them be corrected before the damage accumulates — protecting assets from the electrical stress that drives a large share of unplanned failures.
03
The Grid-or-Us Question Is Settled
Timestamped waveform capture proves whether a disturbance came from the utility or the plant, directing the fix correctly and providing the evidence for a utility service-quality claim rather than leaving the question to argument.
04
Compliance and Penalties Handled
Continuous monitoring documents harmonic compliance against IEEE 519 and surfaces power-factor penalties with their source, turning both a compliance obligation and an avoidable charge into managed, evidenced line items.
Frequently Asked Questions
The questions plant and electrical engineers ask most often when evaluating power quality monitoring.
How is this different from our energy monitoring or a kWh meter?
A consumption meter measures how much energy flowed; power quality monitoring measures whether that energy is clean and stable. They're complementary but distinct. A kWh meter tells you total usage but says nothing about a voltage sag that dropped to 70 percent of nominal for three cycles, the harmonic distortion overheating a transformer, or the microsecond transient that reset a PLC — because power quality lives in the shape and stability of the waveform, which consumption metering doesn't capture. Power quality monitoring continuously tracks voltage sags and swells, transients, harmonics and THD, imbalance, and flicker, timestamping each disturbance. That's what lets you diagnose the trips, overheating, and equipment damage that a consumption meter renders completely invisible. On one platform the two work together — the same load can be both an energy waste and a harmonic source — but they answer different questions. To see both on your plant,
book a demo.
Can it tell whether a disturbance came from the utility or from our plant?
Yes, and this is one of its highest-value functions. By capturing a complete, timestamped power quality profile at the point of use — and at multiple points like the service entrance and critical loads — the system lets engineers locate where a disturbance originated. That matters because a large share of power quality problems are self-inflicted: roughly 80 percent of transients are generated inside the facility by its own switching, harmonics come from its own nonlinear loads like VFDs, and many sags come from its own large motor starts. Monitoring isolates which internal load or panel is the source so the fix is targeted correctly. And when a disturbance genuinely originates on the grid, the timestamped waveform capture at the service entrance is the documented evidence that supports a service-quality claim with the utility. Either way, the data settles the "grid or us" question with a record instead of leaving it to blame, which is exactly what directs the fix to the right place.
What equipment damage does bad power quality actually cause?
More than most plants attribute to it — electrical disturbances account for over 30 percent of unplanned equipment failures. The damage varies by disturbance. Voltage sags trip sensitive drives and protection relays, causing immediate production downtime, and they're the single most common cause of it. Harmonics overheat motors and transformers and stress insulation, shortening asset life and occasionally causing protection misoperation; distortion above 8 percent THD has driven transformer overheating in documented cases. Transients are silent killers that degrade digital components cumulatively until an unexplained reset or premature failure occurs. Voltage unbalance raises motor heating sharply and shortens motor life. Much of this damage is cumulative and preventable — insurance studies indicate about half of electrical-failure cost could be avoided with the visibility regular monitoring provides. The point is that these failures usually get recorded as mechanical or electronic faults when the root cause was power quality, which is exactly what monitoring makes visible.
Do we need this if we already do a periodic power quality audit?
A baseline audit is valuable, but the guidance is increasingly moving toward permanent, continuous monitoring — and for a concrete reason. Power quality disturbances are often intermittent, and an audit is a snapshot: a fault that trips a line once a month will rarely occur during the window an auditor is on site, so a short-term audit every 12 to 18 months systematically misses exactly the intermittent glitches that cause the most frustrating, hardest-to-diagnose problems. Continuous monitoring catches the event whenever it happens, builds the long-term record needed to spot patterns, and documents compliance continuously rather than at a single point in time. The recognized standards now encourage moving toward permanent monitoring for total visibility for this reason. The practical approach is to use a baseline audit to establish where you stand and then transition to continuous monitoring to catch what the audit can't — the intermittent, recurring disturbances that are precisely the ones worth catching.
Does it help with utility penalties and compliance?
Yes, on both counts. On compliance, IEEE 519 sets harmonic-distortion limits for industrial systems — total harmonic distortion is commonly evaluated against a 5 percent voltage threshold at the point of common coupling — and continuous monitoring documents your harmonic contribution against that limit, proving compliance and flagging when a nonlinear load pushes you over. Measuring to IEC 61000-4-30 ensures the data is credible and comparable. On penalties, the most common is the power-factor charge utilities apply when power factor falls below roughly 0.95; reactive-power monitoring surfaces that penalty and its source so correction, such as a capacitor bank, can be targeted where it pays — and because low power factor also inflates the kVA demand you're billed on, fixing it helps twice. Monitoring turns both the compliance obligation and the avoidable penalty into documented, managed line items with the evidence to support them. Contact
iFactory support to review your compliance and penalty exposure.
SEE THE DISTURBANCE · FIND THE SOURCE · PROTECT THE PLANT
Make Bad Power Visible — Before It Trips a Line or Burns Out a Motor.
Real-time monitoring of voltage sags, swells, transients, harmonics, imbalance, and power factor, with every event classified, timestamped, and traced to the grid or your own plant — integrated with energy and maintenance so a disturbance triggers a work order, not just a reset. Protect equipment, prevent downtime, and document IEEE 519 compliance and power-factor penalties with the data behind them.