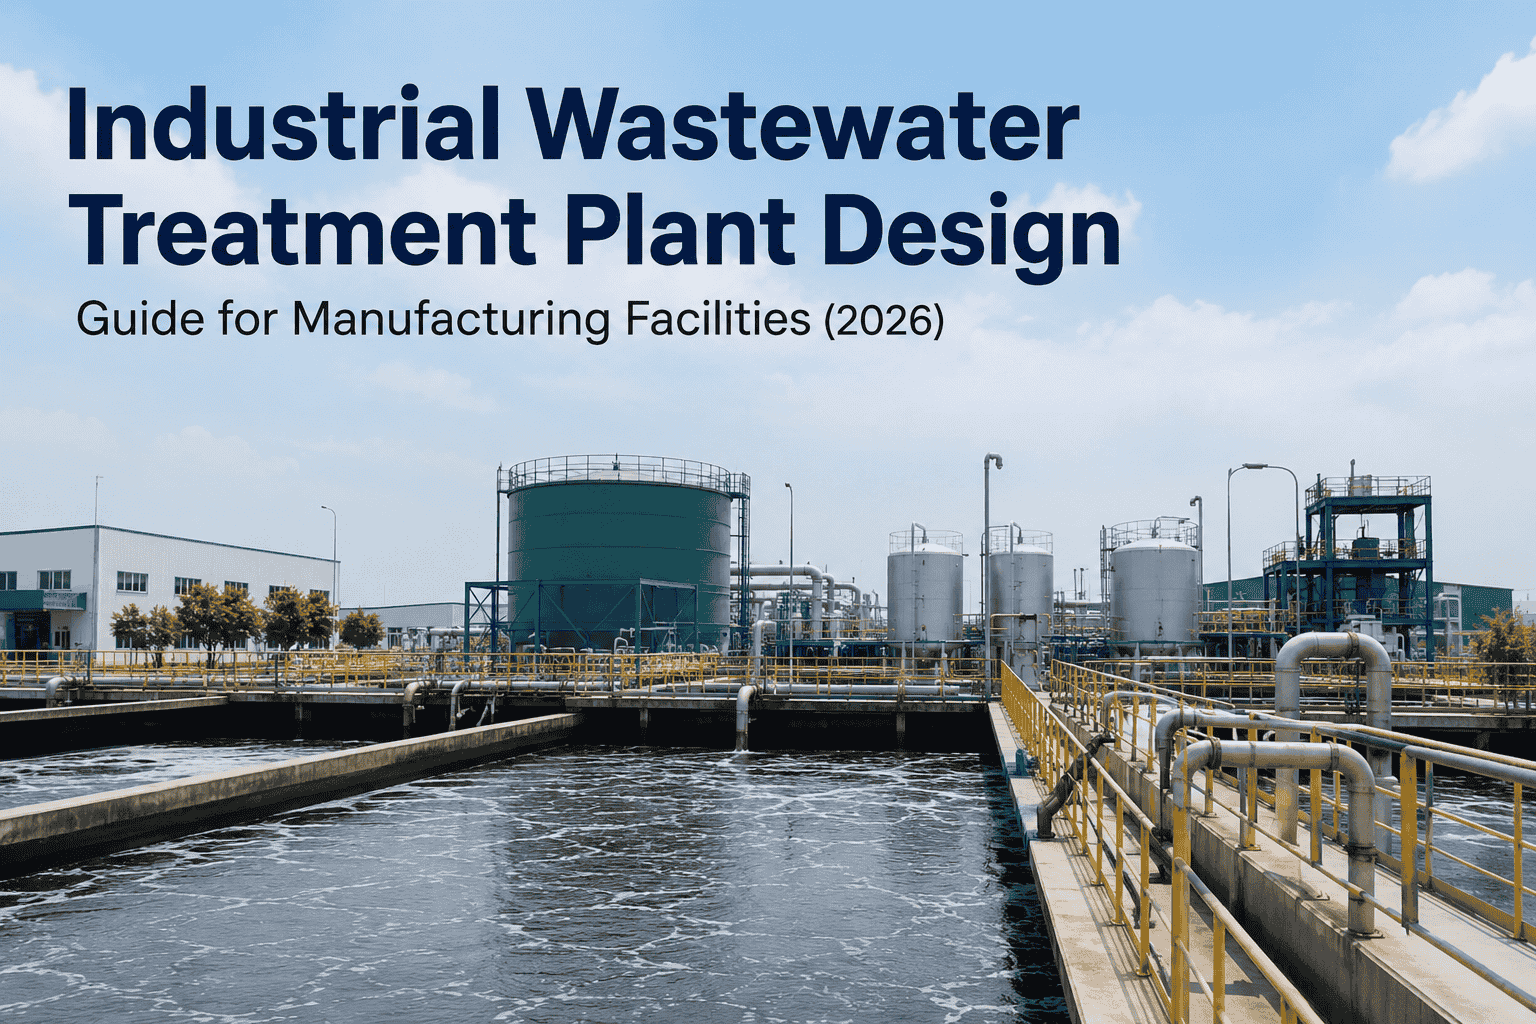
Industrial Wastewater Treatment Plant Design Guide for Manufacturing Facilities (2026)
By Riley Quinn on June 11, 2026
Every gallon of water your factory uses eventually leaves as wastewater—and how you treat that water determines whether you face EPA fines or unlock a competitive sustainability advantage. Industrial wastewater treatment plant design is the strategic engineering decision that shapes your factory's compliance, water costs, and ESG performance for the next 30 years. Get it right at greenfield, and the rest follows. Schedule a wastewater design consultation to validate your treatment architecture before breaking ground.
Industrial Wastewater: Input to Compliant Output
A modern ETP transforms factory effluent into reusable water through engineered stages
Raw Effluent
BOD · COD · TSS · Heavy Metals · Oil & Grease
Treatment Plant
Primary · Secondary · Tertiary · ZLD
Compliant Discharge
Reuse · Safe Release · NPDES Met
95-99%
Water recovery with ZLD
$12M
Avg CAPEX per MGD capacity
30 yr
Plant design lifecycle
What Drives Industrial Wastewater Treatment Plant Design
Industrial wastewater treatment plant design starts with one truth: every industry produces effluent with a unique chemical fingerprint. A food processor's high-organic-load wastewater needs aggressive biological treatment. A metal finisher's heavy-metal-laden discharge demands chemical precipitation. A pharmaceutical plant's complex organic compounds require advanced oxidation. There's no one-size-fits-all ETP — and that's exactly why upfront design decisions compound for decades.
High suspended solids, lignin, AOX compounds, color. Needs clarification, biological treatment, sometimes ZLD by regulation.
High TSS
The Three-Stage Treatment Process Explained
Every industrial wastewater treatment plant — regardless of size or industry — follows a logical cascade: physical separation, then biological breakdown, then chemical polishing. Each stage targets a different category of contaminant, and skipping or undersizing any stage creates downstream chaos. Here's how engineered effluent treatment plants progress water from waste to reuse.
1
Primary
Physical & Chemical Pretreatment
Removes coarse solids, oil, grease, and settleable suspended matter. Reduces pollutant load before biological treatment begins.
Designing a multi-stage ETP for your greenfield site? Book a free design review to validate your treatment cascade with our engineering team.
Treatment Technology Comparison: MBR vs MBBR vs ASP vs SBR
The choice of secondary biological treatment technology is the single most consequential decision in industrial wastewater treatment plant design. It determines footprint, capital cost, operating cost, effluent quality, and shock-load tolerance. Here's how the four dominant technologies stack up for greenfield manufacturing applications.
Parameter
ASP
MBBR
MBR
SBR
Effluent Quality
Good
Very Good
Excellent
Very Good
Footprint
Large
Medium
Compact
Medium
CAPEX
$ Low
$$ Medium
$$$ High
$$ Medium
OPEX
$$ Medium
$ Low
$$$ High
$$ Medium
Shock Load Tolerance
Low
High
Medium
High
Reuse Ready
No
Partial
Yes
Partial
Best Fit Industry
General manufacturing
F&B, dairy
Pharma, electronics, reuse
Variable flow plants
Engineering insight: MBR systems produce ultra-low turbidity effluent suitable for direct reuse, while MBBR systems offer superior shock-load resistance for plants with variable influent. The right choice depends on whether your priority is effluent quality, footprint, or operational simplicity.
Match the Right Treatment Technology to Your Effluent
Selecting between MBR, MBBR, ASP, or SBR for your greenfield ETP shapes capital cost, footprint, and 30-year operating economics. iFactory's wastewater engineering team helps you model technology fit against your effluent profile and discharge limits.
Zero Liquid Discharge (ZLD) has shifted from "advanced option" to regulatory requirement for many polluting industries — including textiles, distilleries, tanneries, and pulp & paper in several jurisdictions. ZLD systems recover 95-99% of water from effluent streams and crystallize the remaining concentrate into solid waste. Designed correctly, ZLD eliminates discharge liability and slashes freshwater purchase costs. Designed poorly, it becomes an operational nightmare with runaway energy bills.
A
Pretreatment + Biological
Conventional ETP stages reduce BOD/COD, suspended solids, and organic load to protect downstream membranes.
→
B
Ultrafiltration
Membrane filtration removes residual TSS and colloidal matter, protecting RO membranes from fouling.
→
C
Reverse Osmosis
High-pressure RO recovers 70-80% of water as permeate suitable for process reuse. Concentrate moves to evaporation.
→
D
Evaporator (MEE/MVR)
Multi-effect evaporators or mechanical vapor recompression concentrate brine to 120,000-160,000 mg/L TDS.
→
E
Crystallizer
Final concentration produces dry salt for disposal or recovery. Liquid discharge: zero.
95-99%
Water recovered & reused
0
Liquid waste discharged
3-5x
CAPEX vs conventional ETP
15-20%
Lower freshwater costs annually
Capital Cost Benchmarks by Flow & Treatment Level
Wastewater treatment plant cost scales with hydraulic capacity, but treatment level multiplies cost in ways that fundamentally alter project economics. Understanding these tiers prevents budget surprises during greenfield design. Use these benchmarks for early-stage planning — final costs depend on site conditions, contaminant profile, and local regulations.
100 GPM
Small Manufacturing
$500K – $1.5M
Screening + DAF + biological
Skid-mounted, modular
Basic SCADA included
Discharge to POTW only
F&B, plating, light manufacturing
Most Common
1 MGD
Mid-Size Greenfield
$8M – $14M
Full 3-stage with MBR/MBBR
UV + RO polishing
SCADA + IoT monitoring
NPDES-compliant discharge
Pharma, electronics, large F&B
1 MGD + ZLD
Zero Discharge Greenfield
$25M – $45M
Complete ETP + ZLD train
MEE + crystallizer
Salt handling infrastructure
AI-driven optimization layer
Textile, distillery, pulp & paper
Operating costs run $0.45-$1.25 per m³ treated. Automation reduces OPEX by 20-30% but raises CAPEX 10-15% — almost always pays back within 4 years.
In the U.S., the National Pollutant Discharge Elimination System (NPDES) program — administered under the Clean Water Act — governs nearly every industrial wastewater discharge to surface water. For greenfield manufacturers, NPDES compliance isn't a post-construction concern; it's a design driver. The permit you'll need determines effluent limits, monitoring frequency, and reporting obligations that your ETP must engineer for.
Step 1: Determine Permit Pathway
Direct discharge to surface water → Individual NPDES permit
Discharge to POTW → Categorical pretreatment standards
Stormwater only → Multi-Sector General Permit (MSGP)
Land application → State land disposal permit
Step 2: Identify Applicable ELGs
EPA Effluent Limitations Guidelines for 50+ industry categories
Technology-based limits (BPT, BAT, NSPS)
Water-quality-based limits for impaired receiving waters
Anticipate stricter limits with each renewal cycle
Design ETP with 20% headroom for tightening standards
Smart Monitoring: How IoT Transforms ETP Operations
Modern industrial wastewater treatment plant design isn't complete without an intelligent monitoring layer. AI-driven IoT platforms — like iFactory — continuously track effluent parameters, predict membrane fouling, optimize chemical dosing, and automate compliance reporting. The shift from manual rounds to continuous monitoring is where greenfield ETPs unlock real ROI.
24/7
Continuous Parameter Monitoring
Real-time pH, DO, turbidity, conductivity, BOD/COD surrogates streamed from sensors to cloud dashboards. No more missed excursions.
30%
Chemical Dosing Optimization
AI models predict optimal coagulant, polymer, and pH adjustment doses based on live influent quality — cutting chemical costs by up to 30%.
2-4x
Membrane Life Extension
Predictive fouling models detect TMP trends days before manual inspection would. Cleaning happens before damage, doubling membrane lifespan.
90%
Automated Compliance Reporting
DMR data auto-compiled from sensor logs. Audit trails generated instantly. Regulator submissions take minutes, not days.
15%
Energy Consumption Reduction
AI-controlled aeration adjusts blower speed to actual DO demand, not fixed setpoints. Aeration alone is 60% of ETP energy use.
5x
Faster Issue Detection
Anomaly detection flags upset conditions in minutes — pH excursions, sludge bulking, foaming events — before they cascade into permit violations.
Building smart monitoring into your greenfield ETP from day one? Schedule a demo to see iFactory's AI-driven wastewater monitoring platform.
Greenfield ETP Design Checklist
Before approving construction drawings, walk through this design verification checklist. Each item represents a failure mode that compounds during operation — and most are nearly impossible to retrofit cost-effectively post-commissioning.
Design flow includes peak factor (2-3x average for shock loads)
Equalization tank sized for 6-12 hours retention
Treatment technology matched to effluent profile
20% headroom built in for future regulatory tightening
Compliance & Permits
NPDES permit pathway determined
Applicable ELGs identified and incorporated
Local POTW pretreatment requirements verified
Discharge monitoring plan documented
Sludge disposal method permitted
Automation & Monitoring
SCADA system with redundant PLCs specified
Online analyzers for pH, DO, conductivity, turbidity
IoT gateway for cloud monitoring integration
Predictive maintenance platform connected
Automated alerting for permit excursions
Expert Perspective
The gap between wastewater treatment plant design specifications and real-world performance is one of the most underestimated risks in greenfield manufacturing. Influent quality fluctuates, equipment wears, and regulatory limits tighten. The plants that thrive over 30 years are the ones designed with built-in flexibility — modular treatment trains, oversized equalization, and intelligent monitoring that catches drift before it becomes a violation.
— Industrial Water Engineering Best Practice
6%
CAGR of global wastewater treatment market through 2030
50+
EPA industry categories with specific effluent limits
5 yr
Typical NPDES permit term — design for tightening limits
20-30%
OPEX reduction with AI-driven plant automation
The Bottom Line for Greenfield Manufacturers
Industrial wastewater treatment plant design rewards thoroughness and punishes shortcuts. Get the effluent characterization right. Match treatment technology to your contaminant profile, not to what's cheapest. Build compliance flexibility for 30 years — not 5. Layer in AI-driven monitoring from day one so your operators see drift before regulators see violations. The factories that handle wastewater as a strategic asset — not a regulatory burden — are the ones unlocking ZLD water savings, lower OPEX, and ESG credibility their competitors can't match. Greenfield is your one chance to do this right without retrofit pain.
Design Your Greenfield ETP for the Next 30 Years
From effluent characterization to ZLD validation, iFactory partners with greenfield project teams to design wastewater treatment plants that meet compliance today and adapt to tomorrow's tightening standards. Bring your project — we'll bring the AI-driven engineering rigor.
What is industrial wastewater treatment plant design and why does it matter for manufacturers?
Industrial wastewater treatment plant design is the engineering process of sizing, selecting technologies, and configuring an Effluent Treatment Plant (ETP) to handle the specific contaminants in a factory's wastewater stream. It matters because every industry produces effluent with a unique chemical signature — food processors produce high BOD/COD loads, metal finishers produce heavy-metal-laden discharge, pharmaceutical plants produce complex refractory organics. A correctly designed ETP ensures NPDES compliance, prevents costly fines, enables water reuse, and supports ESG reporting. Done poorly, you face permit violations, retrofit costs, and operational headaches for decades. For greenfield manufacturers, design is the one chance to get it right before construction locks in your treatment economics for 30 years.
How much does an industrial wastewater treatment plant cost?
Industrial wastewater treatment plant cost varies dramatically with flow rate, treatment level, and contaminant profile. For small plants (100 GPM) handling food & beverage or plating effluent, expect $500,000 to $1.5 million. Mid-size greenfield plants (1 MGD) with full three-stage treatment including MBR and RO typically run $8M-$14M — the industry rule of thumb is roughly $12 million per MGD of average flow. Adding Zero Liquid Discharge (ZLD) capability multiplies cost 3-5x, with full ZLD systems at 1 MGD reaching $25M-$45M. Operating costs run $0.45-$1.25 per cubic meter treated. Automation raises CAPEX 10-15% but cuts OPEX 20-30% — typically paying back within 4 years.
What is the difference between MBR, MBBR, ASP, and SBR for industrial wastewater?
These are four dominant biological treatment technologies for the secondary stage of an ETP. Activated Sludge Process (ASP) is the workhorse — low CAPEX, large footprint, moderate effluent quality. Moving Bed Biofilm Reactor (MBBR) uses plastic carriers for higher biomass concentration, giving excellent shock-load resistance and a smaller footprint than ASP. Membrane Bioreactor (MBR) combines biological treatment with ultrafiltration in one unit, producing the highest effluent quality (suitable for direct reuse) but with the highest CAPEX and OPEX. Sequencing Batch Reactor (SBR) handles variable flow well using a single tank with timed treatment cycles. MBR is increasingly the standard for pharmaceutical, electronics, and water-reuse applications. MBBR fits dairy and beverage. ASP and SBR fit general manufacturing with moderate effluent targets.
Is Zero Liquid Discharge (ZLD) required for greenfield manufacturing plants?
ZLD requirements depend on your industry and jurisdiction. In several regions and for specific polluting sectors — textiles, distilleries, tanneries, pulp & paper, sugar — ZLD is mandated by regulation. In water-stressed regions, ZLD may be required even for industries that wouldn't otherwise need it. Outside mandates, ZLD is increasingly chosen voluntarily for ESG reasons and to eliminate discharge liability. A ZLD system recovers 95-99% of water from effluent through a cascade of biological treatment, ultrafiltration, reverse osmosis, multi-effect evaporation, and crystallization, leaving only solid salt waste. The CAPEX is 3-5x conventional ETP, but freshwater savings of 15-20% annually combined with zero compliance risk often justify the investment over the plant's 30-year lifecycle.
How does IoT and AI improve wastewater treatment plant operations?
AI-driven IoT platforms transform ETPs from reactive to predictive operations. Continuous sensor monitoring (pH, DO, turbidity, conductivity, flow) replaces manual rounds. AI models optimize chemical dosing in real time based on live influent quality, cutting coagulant and polymer costs by up to 30%. Predictive analytics detect membrane fouling days before manual inspection would, extending membrane life 2-4x. Automated DMR generation collapses compliance reporting from days to minutes. AI-controlled aeration matches blower speed to actual oxygen demand, reducing energy use (which is 60% of total ETP OPEX) by 15%. Anomaly detection flags upset conditions — pH excursions, sludge bulking, foaming — within minutes, preventing permit violations. For greenfield plants, building this layer in from day one is dramatically easier than retrofitting later. See iFactory's wastewater AI demo to explore what's possible.