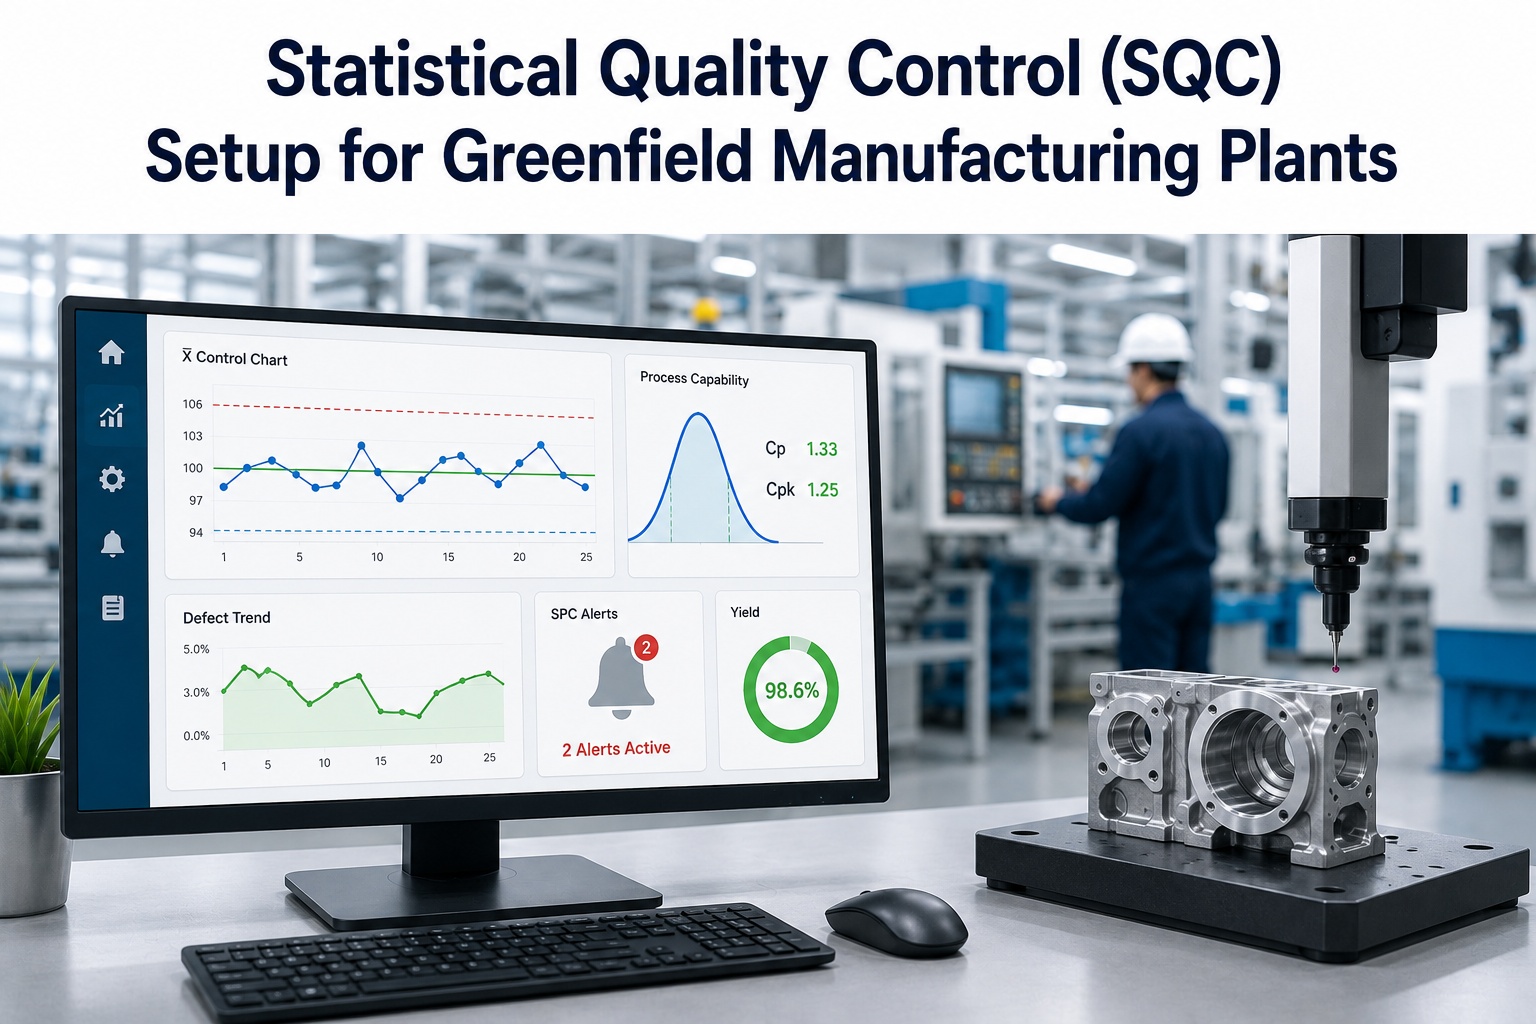
Quality you cannot measure is quality you cannot control. Statistical Quality Control turns the raw stream of measurements coming off a line into a clear signal: is this process behaving normally, or is something drifting? Done well, it catches problems while they are still a trend, not yet a scrap pile. For a greenfield plant, the chance to design SQC in from day one — choosing the right control charts, setting limits from real process data, and wiring operator alerts before the first part is made — is rare and valuable. This guide walks through how to set up SQC for a new manufacturing plant, step by step.
Designing quality control for a new plant? Book a 30-minute SQC setup consultation to choose your control charts, capability targets, and alerts before you go live.
One Point Beyond the Limit Tells a Story
Control limits are calculated from the process at ±3σ — they are the voice of the process, not the specification. A point beyond them signals a special cause to investigate, not random noise.
What SQC Actually Covers
Statistical Quality Control is the umbrella; three tools sit underneath it and do different jobs. Knowing which is which keeps a setup from becoming a pile of charts nobody reads. If you want them configured for your specific critical-to-quality characteristics, you can map them with a quality specialist.
Statistical Process Control
Control charts track process variation in real time and flag special-cause signals before defects accumulate.
Capability Analysis
Cp and Cpk grade how well a controlled process fits inside the specification limits the customer set.
Acceptance Sampling
Statistically sound rules decide whether to accept or reject a lot from an inspected sample, not a full count.
The Control Charts You'll Configure
There is no single chart for everything. The right one depends on whether you are measuring a value or counting defects, and how your data is grouped. These four cover the vast majority of plant setups.
X-bar & R
I-MR (Individuals)
p-chart
c-chart
Modern AI-enabled platforms auto-select the chart type from your data structure and apply Western Electric or Nelson rules — catching runs and trends, not just single points outside the limits.
Not sure which charts fit your process? Book an SQC design session and we will match chart types and rules to each of your critical parameters.
Process Capability: Cp, Cpk, and Your Targets
A process can be in control and still make scrap if it does not fit the specification. Capability indices measure that fit. Cp compares the spec width to the process spread; Cpk also accounts for whether the process is centered. Here is the scale every quality team works to.
Cpk 1.33 is the broadly accepted benchmark; critical, safety, and regulated parameters target 1.67 for extra margin. During validation, report Ppk too — it captures total long-term variation, not just within-subgroup spread.
The Greenfield SQC Setup Roadmap
Setting SQC up cleanly is a sequence, not a software install. Run these seven steps as the plant is built so monitoring is live the moment production starts.
-
1
Identify your critical-to-quality parameters
Pick the variables that drive quality — dimensions, temperatures, pressures, cycle times — prioritizing those with the highest defect-to-variation link.
-
2
Build the control plan from your PFMEA
Map each parameter to a measurement method, a chart type, and a documented reaction plan for when it signals.
-
3
Set sampling plans
Define subgroup size and frequency per parameter — enough to catch shifts without drowning operators in measurement.
-
4
Instrument automatic data capture
Connect smart gauges, CMMs, vision systems, and sensors so measurements flow in without manual entry.
-
5
Establish the baseline and control limits
Collect 20–25 subgroups from a stable process and compute UCL and LCL from that data — never from the specification limits.
-
6
Configure charts, rules, and operator alerts
Apply Western Electric or Nelson rules and route real-time alerts to operators with the corrective action attached.
-
7
Add AI analytics and close the loop
Layer multivariate drift detection and live capability tracking, and link out-of-control signals to maintenance and calibration work orders.
Want this roadmap sequenced against your build? Book an SQC implementation session and leave with a control plan you can hand to your quality team.
From Manual Sampling to Real-Time SQC
iFactory replaces periodic manual SPC with continuous AI-powered monitoring — updating control charts from live sensor data, detecting drift before it crosses a limit, and turning every out-of-control signal into a tracked work order.
Expert Perspective
The classic mistake is setting control limits at the specification limits — it feels intuitive and it quietly defeats the entire purpose. Control limits describe what your process actually does; specifications describe what the customer wants. Confusing the two means you either chase noise or miss real drift. The second mistake is sampling so slowly that by the time a chart signals, you have already made a thousand bad parts. Greenfield is the moment to fix both — set limits from real data and capture it continuously, before the habits set in.
— Quality Engineering Practice, iFactory Engineering Team
minimum Cpk benchmark — 1.67 for critical parameters
defect reduction reported with AI-integrated SPC
earlier drift detection by ML versus standard rules
The Bottom Line
SQC is what separates a plant that reacts to defects from one that sees them coming. The setup is not complicated, but the details decide everything: pick the right chart for each parameter, set control limits from real process data rather than the spec, target a Cpk of 1.33 or higher, and route signals to operators in real time. A greenfield project gets to do all of this before the first part is made — building quality monitoring into the plant instead of bolting it on after the scrap starts piling up.
Build Quality In From Day One
From control plans and chart selection to capability targets and AI-driven alerts, iFactory helps greenfield teams stand up SQC that goes live with the plant — and connects every quality signal to maintenance and calibration.
Frequently Asked Questions
What is Statistical Quality Control, and how is it different from SPC?
SQC is the broad discipline of using statistics to control quality, and it includes three tools: statistical process control with control charts, capability analysis with Cp and Cpk, and acceptance sampling. SPC is the real-time monitoring piece. In short, SPC is one part of SQC — the part that watches the process as it runs.
What is a good Cpk value?
A Cpk of 1.33 is the broadly accepted minimum for a capable process and is a common supplier requirement. Critical, safety, and regulated parameters typically target 1.67 for additional margin against drift. Below 1.00 the process is producing defects, and between 1.00 and 1.33 it is only marginally capable and vulnerable to shifts.
Are control limits the same as specification limits?
No, and treating them as the same is one of the most common SPC errors. Control limits are calculated from your actual process data at plus or minus three sigma and describe what the process does. Specification limits describe what the customer requires. Setting control limits at the spec defeats the purpose of the chart.
Which control chart should I use?
Use X-bar and R when you measure several parts per interval, I-MR for single readings or destructive tests, a p-chart for the proportion of defective units, and a c-chart for counts of defects per unit. The choice depends on whether you are measuring values or counting defects, and how the data is grouped.
How does iFactory help set up SQC in a greenfield plant?
iFactory helps define your critical parameters and control plan, captures measurements continuously from sensors and gauges, sets control limits from real data, and routes alerts to operators with corrective actions attached. It also links out-of-control signals to maintenance and calibration. You can book an SQC setup consultation to plan it for your facility.