Quality control failures cost the average manufacturer 20% of revenue — scrap, rework, warranty claims, and customer escapes. Human inspectors miss 20 to 30% of defects on a good day and drop another 15 to 25% in accuracy after 2 hours. Two inspectors examining the same product agree on severity only 55 to 70% of the time. AI defect detection flips this entirely: 95 to 99.7% accuracy held continuously, defects identified down to 50 microns, 10,000+ parts per hour at sub-100ms inference. Documented results show 37% defect reduction, 374% three-year ROI, and 7 to 8 month payback. Book a quality control AI consultation to model the ROI on your products.
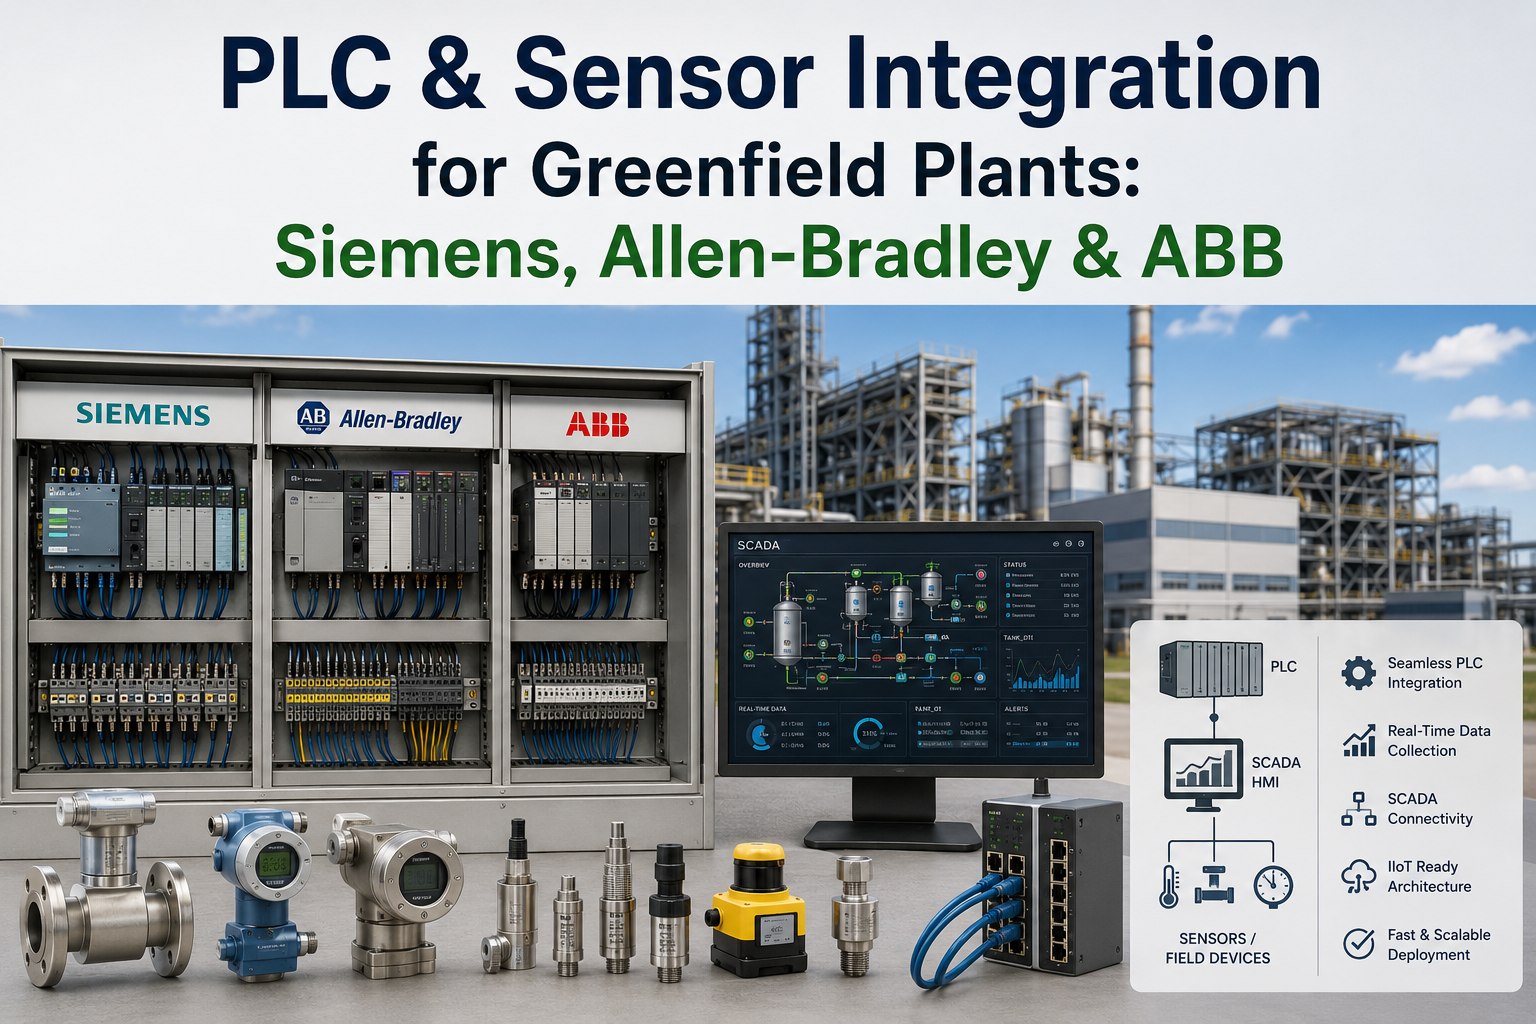
Human Visual Inspection
AI Defect Detection
The 12 Defect Categories AI Vision Catches at Production Speed
Modern AI defect detection ships with pre-trained models covering 12 standard defect categories. During deployment the models fine-tune on your specific products, lighting conditions, and historical failure modes. Each category maps to a distinct operational impact — from customer escape risk to regulatory exposure.
Surface Scratches
Reflective, textured, or coated surfaces. Pre-escape detection on automotive paint, electronics housings, glass, metal.
Cracks & Fractures
Surface and sub-surface fractures on castings, welds, ceramics, glass. Critical for safety-rated components.
Dimensional Errors
Out-of-spec measurements on machined parts, stampings, injection-molded components. Replaces sample-based gauging.
Assembly Defects
Missing fasteners, wrong-orientation parts, improper seating. Catches assembly errors before downstream operations.
Contamination
Dust, fibers, oil drops, metal shavings on clean-room or food-grade surfaces. Pharma and F&B compliance critical.
Color & Texture Variation
Out-of-spec color, gloss, finish variation. Coating, plastic, textile, and printed packaging applications.
Missing Components
Absent screws, gaskets, washers, electronic components, labels. Replaces operator visual checks at SMT, assembly stations.
Label & Print Errors
Misprinted, smeared, missing, or wrong-orientation labels. Lot codes, barcodes, expiration dates. Critical for regulated industries.
Dents & Deformations
Surface dents, warping, geometric distortion on sheet metal, plastic, packaging. Catches handling damage in-line.
Fill Level Errors
Underfill, overfill, foam, head-space variation in bottles, jars, blister packs. Direct compliance and giveaway impact.
Weld & Joint Defects
Porosity, undercut, missed welds, contamination inclusions. Replaces destructive sampling on safety-rated welds.
Foreign Objects
Wrong-product, foreign parts, untrained-class objects. Catches the unknown-unknowns that rule-based vision misses.
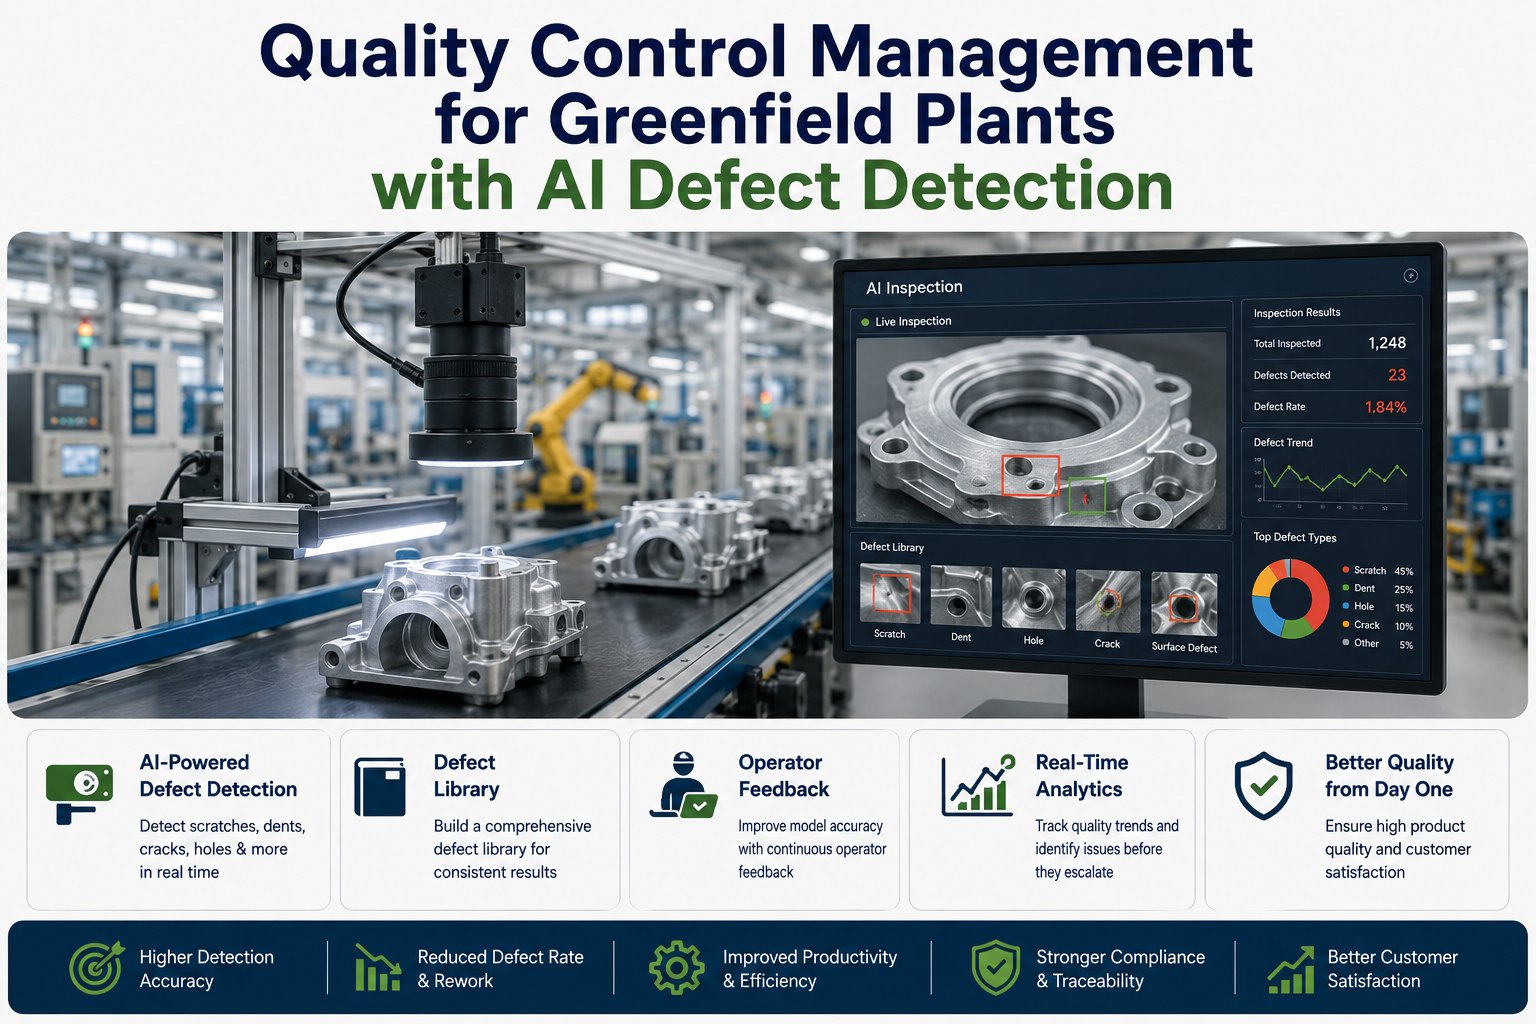
How the AI Defect Detection Pipeline Actually Works
AI defect detection is not a black-box camera — it's a 4-stage pipeline running edge inference per frame, integrated with the plant's quality management system. Understanding each stage reveals where deployment effort goes and which decisions affect ROI most.
Image Capture
Industrial cameras (5-45 MP, global shutter) capture at line speed under structured LED lighting designed for the inspection task. Lighting matters more than camera specs for detection accuracy.
Preprocessing & Region Detection
Image segmentation isolates the part from background, identifies regions of interest, normalizes lighting variation. Reduces inference burden by 60–80% downstream.
Defect Classification
Deep-learning model classifies each region against trained defect classes. Confidence scoring, severity rating, and bounding-box localization in a single inference pass.
Routing & QMS Logging
Verdict triggers actuator (reject gate, divert lane, alarm). Defect record streams to QMS with image evidence, lot/serial, operator. Closed-loop feedback retrains model.
Want this pipeline designed against your specific products and defect types? Book a quality control AI consultation — we will produce the pipeline architecture and accuracy estimate before deployment.
The Per-Line ROI Math: Where the 374% Three-Year Return Actually Comes From
The 374% Forrester ROI number is real — and it has four distinct components per production line. Understanding the savings stack is what separates a board-approved business case from a stalled pilot. The numbers below are documented across mid-sized manufacturer deployments.
6 Documented Case Studies: What AI Quality Control Actually Delivers
The numbers behind 374% ROI claims are documented across industries. The six case studies below cover automotive, electronics, steel, pharma, semiconductor, and consumer goods — different products and processes, consistent outcomes.
BMW Components
22% OEE increase from automotive component AI inspection deployment.
Siemens Manufacturing
40% warranty claim reduction across electronics manufacturing lines with CV integration.
Major Steel Producer
Detection accuracy improved from 70% to 98%+. $2M annual savings within 12 months.
Intel Fabs
AI vision inspection scrap avoidance. ROI realized within 6 to 12 months across multiple inspection points.
Pharma AI Cluster
Fewer quality-related recalls vs conventional inspection. Medical device deployments report $18M annual savings.
Smartphone Manufacturer
47 defect types inspected simultaneously at 99.2% accuracy. Customer return rate cut by 63%.
Ready to apply documented results to your products? Talk to our quality AI team — we will model the case study comparable for your industry.
Expert Perspective: Why 77% of AI Quality Pilots Stall — and the 3 Things That Distinguish the 23% That Scale
Seventy-seven percent of AI manufacturing pilots stall before reaching production scale. That is not a technology problem. It is a deployment discipline problem. The 23% of pilots that scale to multi-line, multi-site production all do three things differently. First, they train models on site-specific images — not vendor demo images. A model achieving 98% accuracy on the vendor's golden samples will deliver 75 to 80% on your factory floor with its specific lighting, dust haze, and product variation. Site-specific training is 10 to 14 days of work that determines whether you get vendor-demo numbers or production-floor numbers. Second, they integrate the defect verdict into closed-loop QMS workflow from day one — not as a post-pilot phase. A defect detection that doesn't trigger a tracked corrective action is a metric, not a quality system. Third, they pick one high-cost defect class first, prove ROI on that narrow scope, then expand. The pilots that try to catch 47 defect types simultaneously on day one are the ones that never get past month six. Greenfield plants have a structural advantage: camera placement, lighting design, and QMS integration can all be designed in from day one rather than retrofitted later.
— iFactory Greenfield Consulting, Quality AI Practice 2025 to 2026