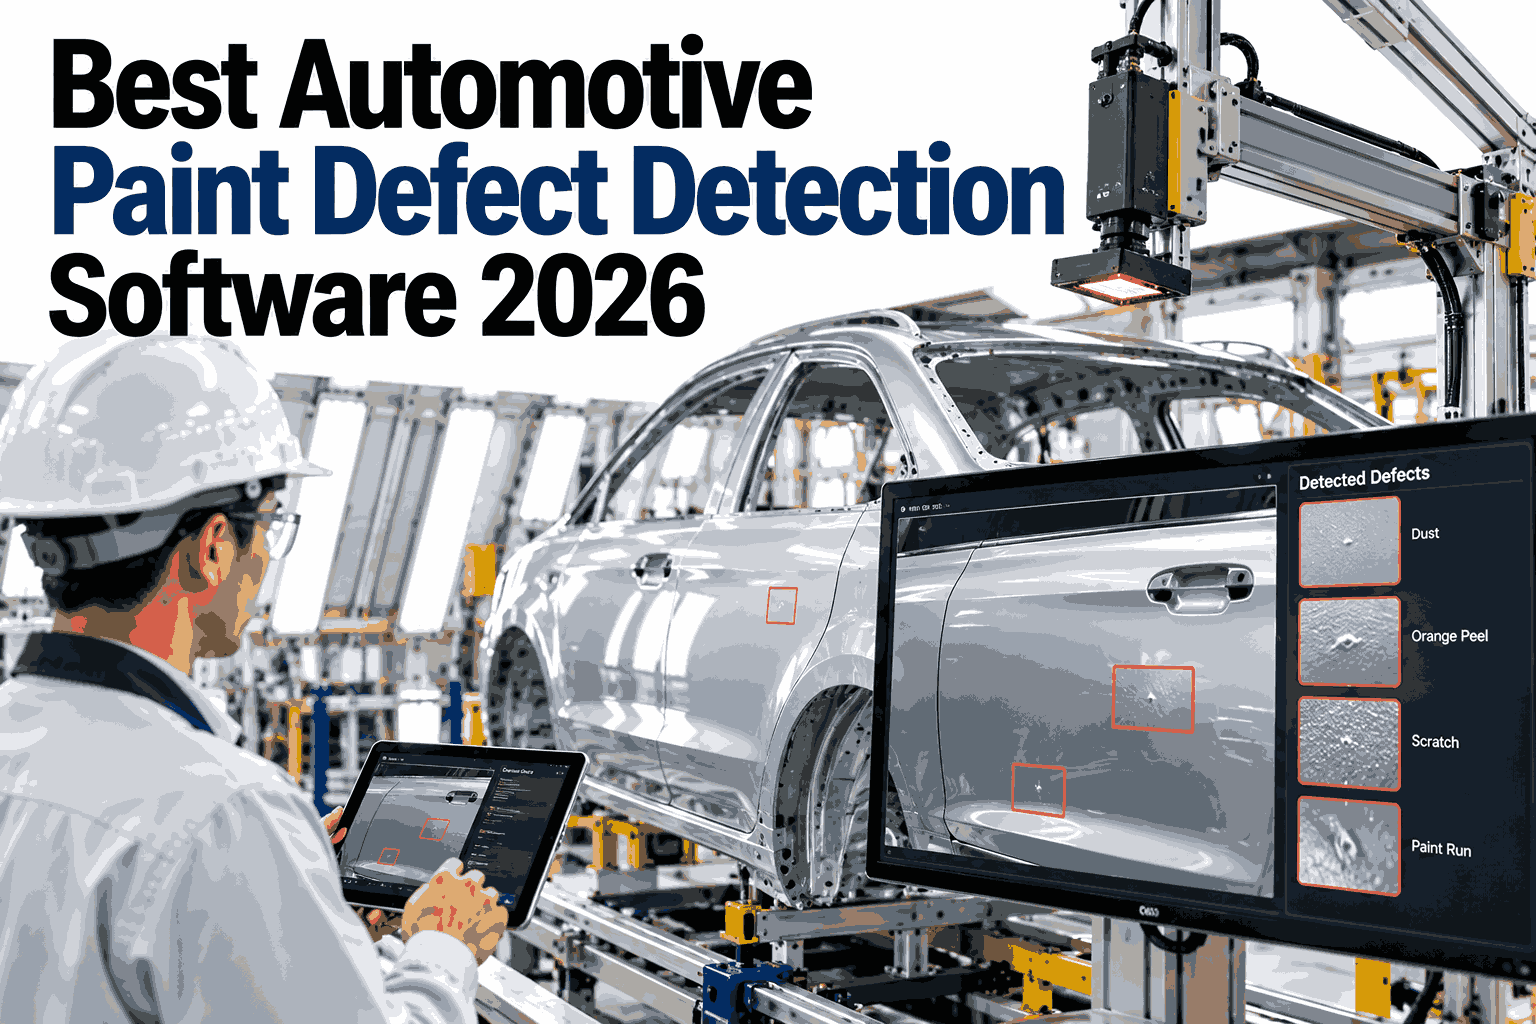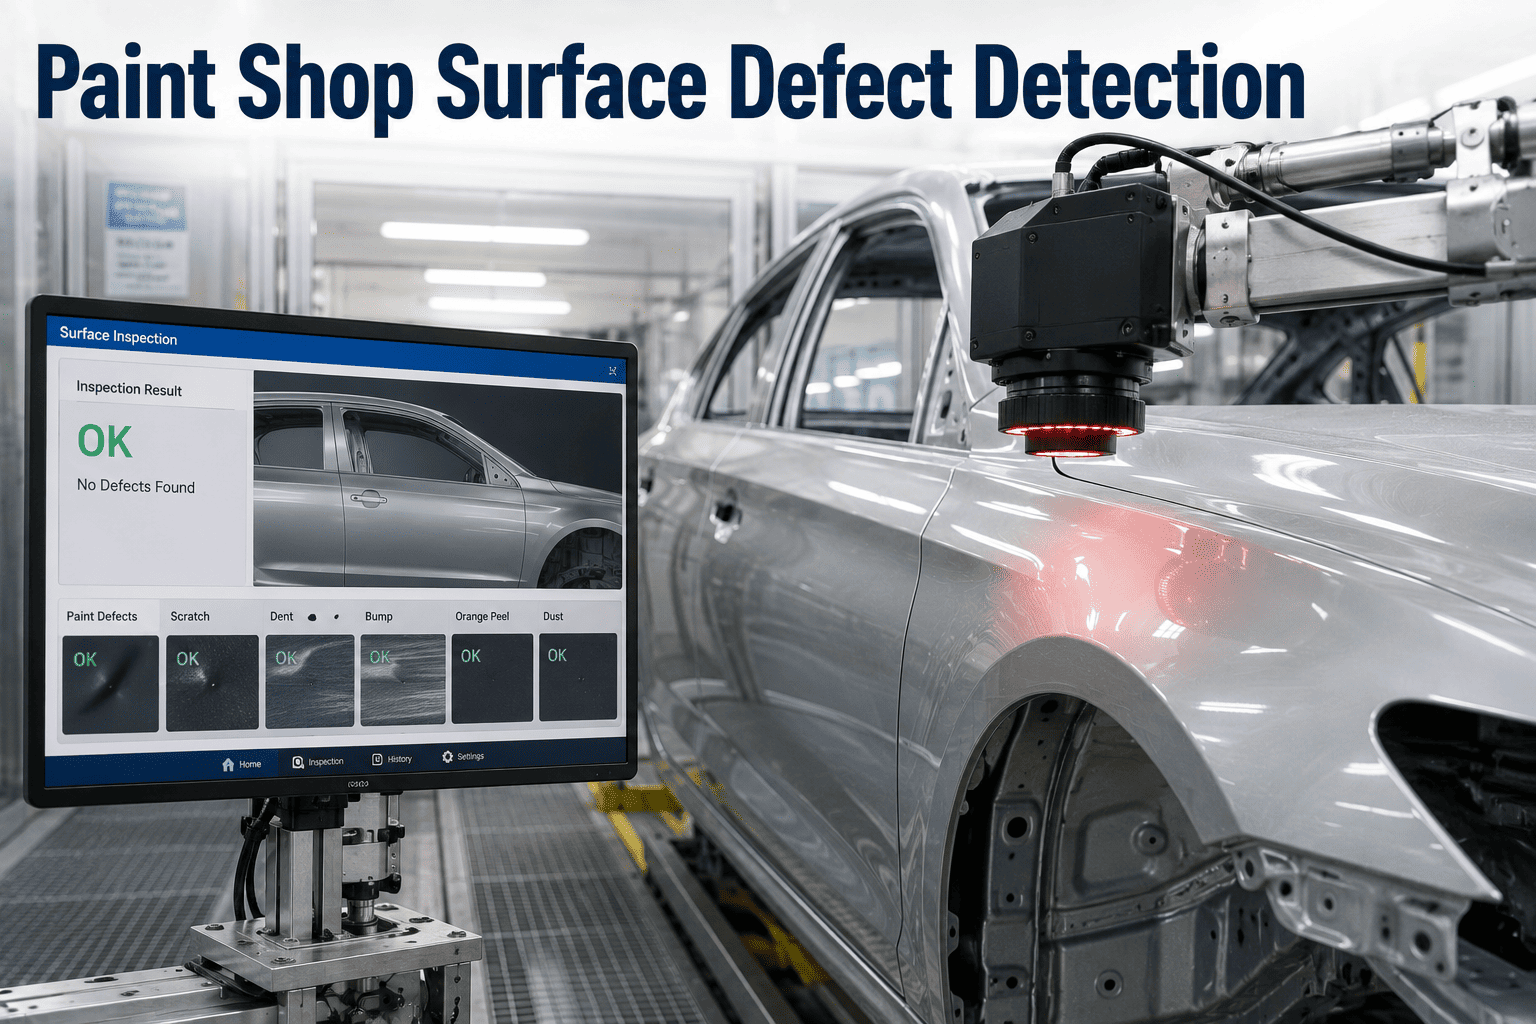
Finance teams rarely reject vision AI for paint inspection because the idea is weak. They reject business cases built on one large saving that nobody can verify, or on assumptions that quietly ignore running costs and false alarms. A defensible ROI model stacks several smaller, measurable levers, such as better defect capture, fewer false alarms and shorter touch-up time, and then tests them against conservative inputs. To build that case with your own numbers, book a paint line ROI session with the iFactory AI team.
Build a Three-Year Paint Line Business Case That Finance Will Actually Accept
iFactory AI helps paint shops measure capture rate, false alarm cost and touch-up labour, so the payback you present is built from your own line data and not from a vendor slide.
Why Most Paint Inspection ROI Models Do Not Survive the Finance Review
A paint line is one of the most expensive areas of a vehicle plant, so any proposal near it receives close scrutiny. Models that rely on a single headline saving, a vendor benchmark or a best-case defect rate tend to collapse the moment a controller asks where a number came from. The strongest cases are built from the plant's own data and show their arithmetic openly.
These four questions shape everything that follows. The model in this guide is deliberately modest, uses example inputs that you should replace with your own, and includes the costs that optimistic proposals tend to leave out.
Four Measurable Levers That Stack Into One Defensible Payback
Instead of one big claim, the model adds four savings that each have their own owner and their own source of evidence. In the worked example, a plant producing 300,000 vehicles a year reaches about 581 thousand in annual gross benefit.
The stack above is useful because no single lever carries the case. If one proves weaker than expected, the other three still hold, and the team can discuss each lever with the person who actually owns the process behind it.
| Lever | How it is calculated | Example inputs | Annual result |
|---|---|---|---|
| Touch-up labour | Repair hours x share saved x labour rate | 25,000 hours, 20 percent saved, $40 per hour | $200,000 |
| Escaped defects | Escapes avoided x average cost of an escape | 600 escapes, $350 each | $210,000 |
| False alarms | Flags removed x minutes x labour rate | 9,000 flags, 6 minutes, $40 per hour | $36,000 |
| Repaint avoided | Repaints avoided x cost per repaint | 150 repaints, $900 each | $135,000 |
| Total gross benefit | Sum of the four levers | As above | $581,000 |
Every row has an input you can find in plant records or measure in a short study, which keeps the model honest and makes it easy to adjust when your own numbers differ from the example.
Defect Capture Rate Is the Number That Drives Everything Else
Capture rate is the share of real paint defects that inspection finds before the vehicle moves on. Every missed defect becomes an escape, which is cheaper to fix early and far more expensive after final assembly or delivery. Higher capture also gives repair teams a complete defect list on the first pass, instead of discovering more problems later.
Capture rate and false alarms move in opposite directions as sensitivity changes, so a credible model always reports both together. A vendor who quotes a high capture rate without a false alarm rate is describing only half of the trade-off.
Validation is simple in principle. A set of vehicles is inspected by the system and by experienced inspectors, disagreements are reviewed, and the resulting capture and false alarm rates become the inputs of the model instead of brochure claims.
The Hidden Cost of Flags That Turn Out Not to Be Defects
Every flag sends a person to look at a vehicle, and every look takes time. When a system flags too much, the cost of false alarms can cancel out the value of the defects it finds, which is why finance teams are right to ask about them directly.
This lever is the smallest in the example, but it protects the credibility of the whole model. Showing that false alarms were measured and priced tells the finance team that the proposal has been stress-tested instead of simply promoted.
Trust is the real asset here. A system that flags rarely and accurately gets acted on, while one that flags constantly gets ignored, regardless of how impressive its capture rate looks on paper.
Where Touch-Up Labour Savings Actually Come From
The largest labour saving rarely comes from faster polishing. It comes from the time repair staff spend searching for a defect, because an inspector who is told exactly where and what the defect is can start repairing immediately. In the example, the average repair drops from 25 to 20 minutes through shorter searching alone.
The repair step itself does not change in this example, and that restraint makes the claim more believable. Only the finding step shrinks, because defect location, class and image are delivered to the repair station before the technician touches the body.
Across 60,000 repaired bodies a year, a five minute reduction equals 5,000 hours, which at the example labour rate gives the 200 thousand shown in the lever table.
What Goes Into the Investment, and What Keeps Costing Every Year
A model that lists only benefits is a sales document, not a business case. Costs fall into one-time items and recurring items, and listing both clearly is what gives the benefit side its credibility.
With 581 thousand of gross annual benefit and 60 thousand of running cost, the net annual benefit is 521 thousand. Dividing the 1,200 thousand investment by that figure gives a payback of about 2.3 years, and a three-year net gain of 363 thousand.
Turn Your Own Paint Line Numbers Into a Payback Model
Bring your vehicle volume, repair hours and escape history, and see how iFactory AI would build a three-year model that your finance team can check line by line.
What Happens to Payback If the Assumptions Turn Out Wrong
A single payback figure invites doubt. Showing a range tells decision makers how sensitive the result is and what they are actually betting on. The example below moves the benefit side down and up by thirty percent while keeping costs fixed.
Notice that the cautious case misses the three-year target in this example. Presenting that openly is wise, because it shows exactly which assumptions matter most and gives the team a reason to validate them with a pilot before committing the full budget.
In practice the most sensitive inputs are usually repair minutes saved and the number of escapes avoided, which is why a pilot should measure those two first.
Prove the Numbers in a Pilot Before Committing the Full Budget
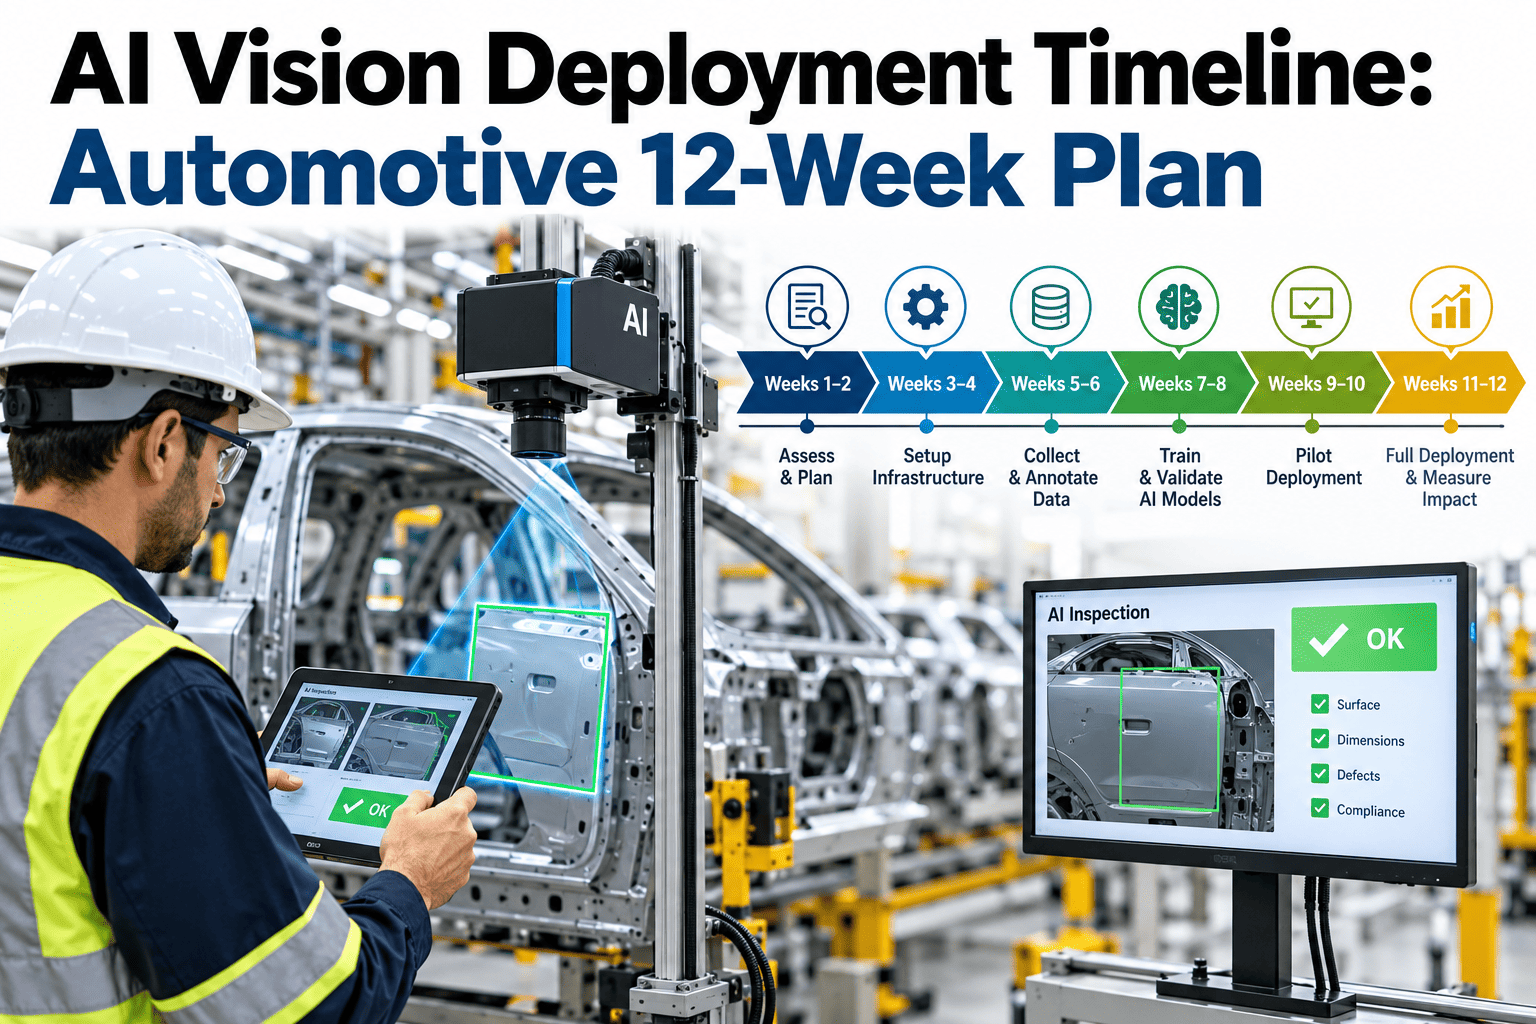
A staged rollout turns an uncertain forecast into a measured result. Each stage has a clear question to answer, so the investment grows only as the evidence does.
The pilot also answers questions no model can, such as how repair staff react to flags, how lighting copes with certain colours and how quickly tuning stabilises the false alarm rate.
Four Objections From the Finance Table and How a Good Model Answers Them
Scepticism is healthy, and the best way to meet it is with specifics. These are the objections paint and quality leaders hear most often.
Each answer replaces an assumption with a measurement, which is the consistent theme of a business case that survives scrutiny.
A Checklist for Building the Paint Vision AI Business Case
Collect these items before the first modelling session, and the case will be faster to build and easier to defend.
Missing numbers are a normal starting point, and estimating them with a short study is often the first useful outcome of the project.
What Finance and Paint Leaders Ask About Vision AI Payback
Show Your Finance Team a Paint Inspection Case They Can Verify
Book a session with iFactory AI to review your paint line data, test the four levers against conservative inputs and see how vision inspection can pay back within a planning horizon you trust.