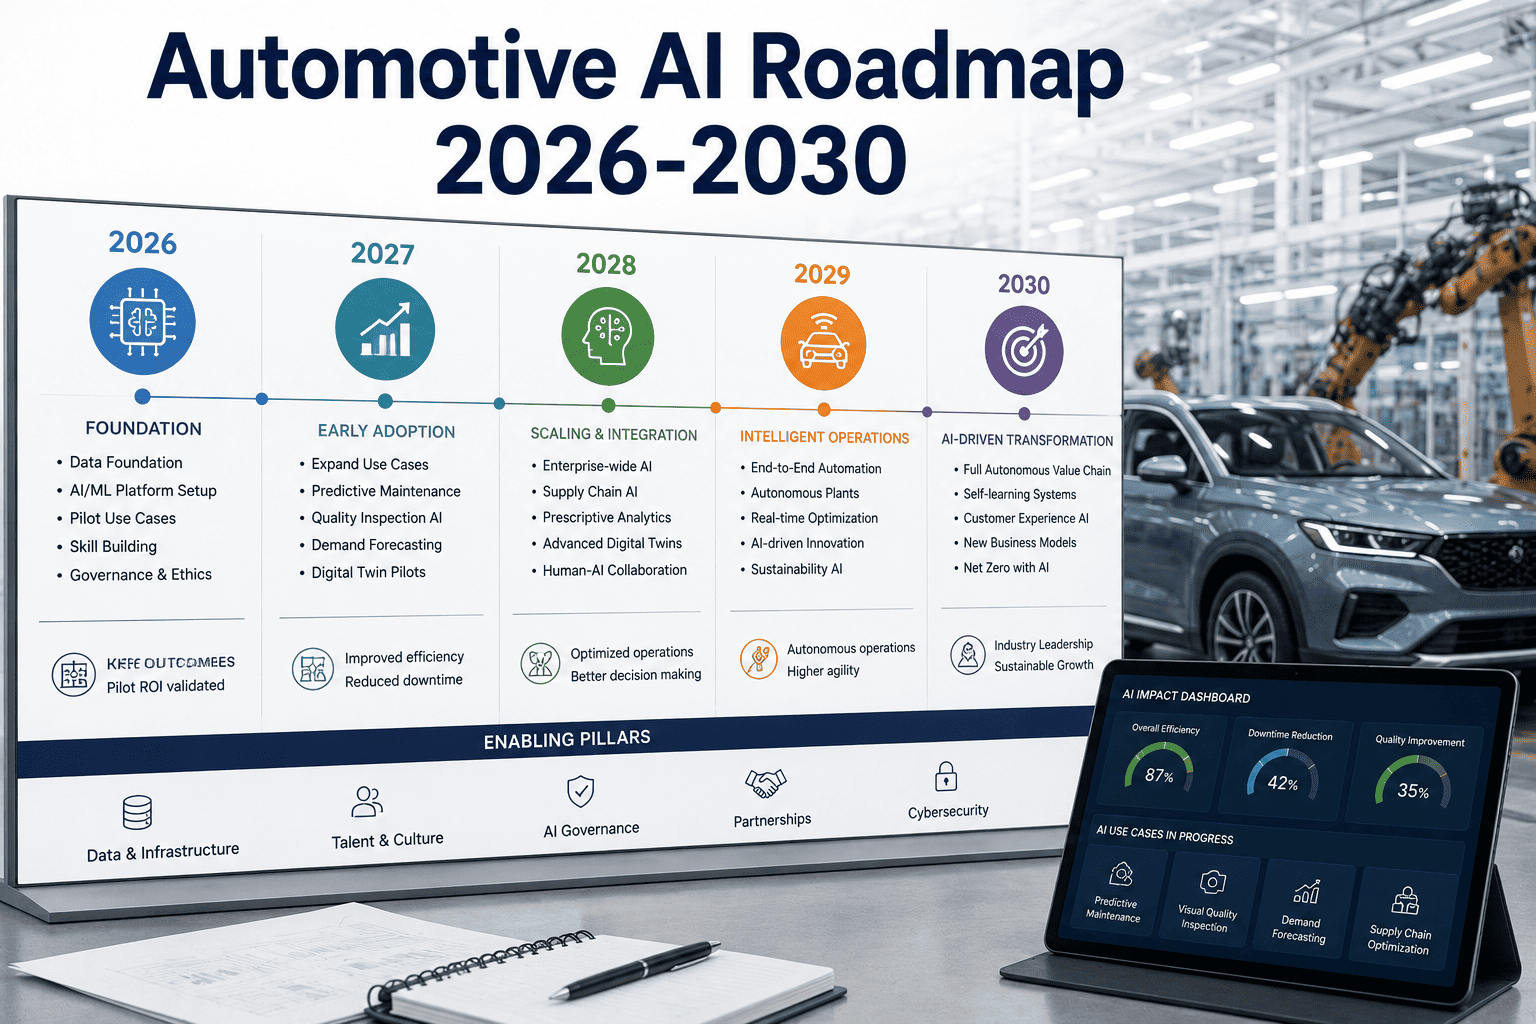
In 2026, most automotive plants are running between three and twelve AI pilots simultaneously. By 2030, the plants that will define competitive benchmarks in quality, cost, and throughput will have moved past pilots entirely — they will be running AI as operational infrastructure, the same way they run MES and ERP today. The distance between those two states is not primarily a technology problem. The technology is available now. It is a sequencing problem: which capabilities to build first, which organisational prerequisites must be in place before a capability can scale, and how to sustain board confidence in AI investment through the EV transition years when capital budgets are under maximum compression. This is the strategic planning problem that separates the plants that arrive at 2030 as AI leaders from those that arrive with a more sophisticated pilot portfolio. To discuss how your facility maps against this roadmap and where the highest-leverage next steps are, book a strategy session with the iFactory automotive AI team.
Strategy & Implementation · Automotive AI · 2026–2030
The Automotive AI Roadmap 2026–2030: From Pilot Portfolio to Operational Intelligence — A Four-Year Maturity Framework for Plant Heads and Strategy Directors
A structured four-year capability roadmap covering AI maturity sequencing, EV transition alignment, competitive positioning, organisational prerequisites, and investment phasing for automotive OEMs and Tier-1 suppliers planning their AI strategy through 2030.
4 years
Window to establish AI operational leadership before competitive benchmarks reset
3–12
Typical active AI pilots in automotive plants today — most never reaching production scale
$4–18M
Typical 4-year AI programme investment range per major plant — excludes infrastructure
2028
Year by which leading Chinese OEMs are projected to reach full-plant AI integration at scale
Why 2026 Is the Last Year to Start This Roadmap and Still Arrive at 2030 Competitive
AI capability in manufacturing compounds. A plant that began structured AI deployment in 2023 has three years of production data feeding model improvement, three years of organisational learning about AI governance, and three years of infrastructure investment that is now fully depreciated. A plant that begins in 2026 starts from zero on all three dimensions while its 2023-starter competitor continues compounding. The compounding dynamic means that the gap between first-movers and late-movers widens nonlinearly — a two-year head start in 2024 translates to a three to four year capability gap by 2029.
2024–2025
First-Mover Window
Leading plants established data infrastructure, deployed first production AI applications in quality and predictive maintenance, and built internal AI competency. The competitive moat from this period is now compounding.
2026 ← Now
Fast-Follower Threshold
Plants starting in 2026 can still close the gap by 2028–2029 if they sequence correctly. The prerequisite is committing to an infrastructure-first approach rather than another round of isolated pilots. The window for fast-follower recovery closes in approximately 18 months.
2027+
Late-Mover Position
Programmes starting after mid-2027 are unlikely to reach operational AI maturity before 2031–2032. The competitive benchmark will have been reset by then, and the gap will require either a step-change investment to close or acceptance of a structural cost and quality disadvantage.
The Four-Year Maturity Timeline
Capability Progression from 2026 to 2030 — What Gets Built When and Why
The timeline below maps capability development across five domains: Quality AI, Predictive Maintenance, Supply Chain Intelligence, Production Optimisation, and Digital Twin. The sequencing is not arbitrary — each domain has prerequisites from the domains that precede it, and the infrastructure layer (data platform, network, edge compute) must be established in 2026 before any application layer can scale.
Phase-by-Phase Breakdown
What Each Year Requires — Capabilities, Prerequisites, Investment, and Organisational Milestones
2026
Foundation Year
Investment range: $0.8–2.5M
Capabilities to Deploy
Unified data namespace and plant historian consolidation
Edge compute infrastructure in 2–4 production zones
Vision inspection on highest-defect-rate line — production deployment, not pilot
OEE baseline measurement with micro-stoppage detection on target lines
Vibration and temperature sensor deployment on critical rotating assets
AI governance structure and model versioning protocol established
Organisational Prerequisites
Named AI programme owner with cross-functional authority
IT/OT integration team in place — not project-based, standing function
Data quality standards defined and enforced in new equipment POs
Board-level AI investment thesis approved with 4-year horizon
Gate Criteria for 2027
At least one production-scale AI deployment with documented ROI
Data platform operational with 6+ months of clean historian data
Edge infrastructure in place in at least 2 zones
2027
Scale Year
Investment range: $1.2–4.0M
Capabilities to Deploy
Vision inspection rollout across all primary quality gates — multi-line
Predictive maintenance live on all critical assets — failure prediction replacing calendar PM
AI-driven scheduling — workforce and maintenance window optimisation
Supply chain risk scoring — demand sensing and Tier-1 signal monitoring
RTY measurement and step-sensitivity analysis across full process route
Battery cell quality AI if EV line active — electrode coating, formation, grading
Organisational Prerequisites
Line supervisors trained in AI-augmented decision-making — not just passive recipients
AI model performance review cadence (monthly) embedded in management rhythm
Vendor integration standards enforced — new machinery OPC UA compliant
Gate Criteria for 2028
OEE improvement of 4+ percentage points attributable to AI interventions
Unplanned downtime reduced 30%+ on predictive maintenance covered assets
Supply chain risk scoring covering 80%+ of BOM
2028
Intelligence Year
Investment range: $1.5–6.0M
Capabilities to Deploy
Automated root cause analysis — defect-to-parameter correlation in minutes
Live plant-level digital twin — real-time synchronisation with physical asset state
Closed-loop quality control — AI adjusting process parameters in real time
Multi-tier supply chain visibility — semiconductor fab signal monitoring
Autonomous line balancing — takt time optimisation across cell configurations
Cross-plant AI benchmarking — performance normalisation across facilities
Organisational Prerequisites
AI engineering function embedded in manufacturing — not a separate digital team
Model drift monitoring and retraining pipeline in production operation
Digital twin team with simulation engineering competency established
Gate Criteria for 2029
Quality escape rate reduced 50%+ vs. 2025 baseline
Digital twin operational — commissioning new lines in simulation before physical build
AI-driven decisions outnumber manual decisions on monitored KPIs
Self-optimising production system — AI continuously improving OEE within defined parameters
Generative digital twin — what-if scenario modelling for layout, product mix, staffing
Autonomous material handling integration — AMR/AGV fleet intelligence
Predictive energy management — AI-driven demand response and load optimisation
Cross-supply-chain AI — OEM and Tier-1 AI systems exchanging signals directly
Competitive Position by 2030
Manufacturing cost per unit: 12–22% below 2025 baseline through AI-driven efficiency
Quality escape rate: 70–85% below 2025 baseline across AI-covered process routes
EV production ramp speed: 30–45% faster than non-AI-native competitors
Plant OEE: 78–88% range vs. industry average of 62–68% for non-AI plants
Where Does Your Plant Sit on This Roadmap?
iFactory Provides the Maturity Assessment and 90-Day Action Plan to Move Your Programme to the Next Phase
Most automotive plants know they need to accelerate their AI programme but cannot clearly articulate where they are on the maturity curve or what the specific next steps are. iFactory's manufacturing AI maturity assessment takes 2 to 3 weeks, benchmarks your programme against the roadmap above, and delivers a prioritised 90-day action plan for phase progression.
How the EV Model Shift Intersects with the AI Roadmap — and Why Getting the Sequence Wrong Is Expensive
The EV transition and the AI roadmap interact at three points that strategy directors must address explicitly in their planning. Treating them as independent workstreams is the most common and most expensive planning error in automotive AI strategy today.
01
Battery Cell and Pack Quality AI
EV battery production is more AI-dependent than any ICE equivalent. Electrode coating uniformity, formation cycle performance, cell grading accuracy, and thermal runaway risk prediction are all quality problems that require real-time AI to manage at production scale. Plants that launch EV lines without battery quality AI in place will face yield losses of 8 to 18% that are extremely difficult to recover through manual process control alone. Battery quality AI must be planned alongside the EV line ramp, not as a phase-2 addition.
AI deployment window: 12–18 months before EV line SOP
02
Powertrain Transition Supply Chain AI
The transition from ICE to EV fundamentally reshuffles the supply chain — from high-precision machined parts to electronics-heavy assemblies with semiconductor content 4 to 6× higher per vehicle than ICE equivalents. The supply chain AI capabilities required for EV production (semiconductor monitoring, cell and module supplier risk scoring, raw material price and availability tracking for lithium, cobalt, and nickel) are entirely different from ICE supply chain tools. These capabilities take 12 to 24 months to build and must be sequenced ahead of EV volume ramp.
AI deployment window: 18–24 months before peak EV volume
03
Mixed-Production AI Architecture
Most plants will run ICE and EV production simultaneously for 3 to 7 years during transition. An AI architecture designed only for ICE processes cannot be extended to EV without significant rework — different sensor types, different defect categories, different quality standards, different maintenance models for different equipment. The 2026 infrastructure layer must be designed from the start to accommodate both product families, even if EV volume is small. Retrofitting an ICE-specific AI architecture for EV adds 12 to 18 months and 30 to 60% of the original investment.
Architecture decision point: 2026 infrastructure design — before any concrete is poured
Competitive Positioning
Where the Automotive AI Competitive Landscape Sits in 2026 — and Where It Will Be in 2030
The chart below maps the current and projected AI maturity of four automotive player archetypes across six capability dimensions. The gap between Chinese OEM AI capability in 2026 and 2030 is the competitive dynamic that makes the 2026–2028 window critical for Western OEMs and their supply chains.
Build vs. Buy vs. Partner
The Decision Framework Every Strategy Director Needs Before Writing the AI Investment Case
The build/buy/partner decision is the most consequential and most under-analysed choice in automotive AI strategy. Getting it wrong in one direction (building everything in-house) delays deployment by 2 to 4 years and produces higher total cost. Getting it wrong in the other direction (buying off-the-shelf everything) produces vendor dependency and insufficient customisation for competitive differentiation. The correct framework is not ideological — it is capability-specific.
AI Capability
Build (In-House)
Buy (Platform)
Partner (Co-develop)
Recommended
Vision quality inspection
High — requires ML team, annotation pipeline, model lifecycle management
Medium — available platforms need customisation for your defect types and substrates
Low — available platforms cover the base case
Buy + internal fine-tune
Predictive maintenance
High — models are asset-specific and transfer poorly between manufacturers
Low-Medium — generic models require significant retraining on your failure data
Medium — co-develop on platform with your asset data
Partner — platform + your data
Data infrastructure
Medium — standard architectures exist, configuration is plant-specific
High — cloud or hybrid platforms available and proven
Low — not a differentiator
Buy — cloud or on-premise platform
Production process optimisation
Low — your process knowledge is the core IP; external models cannot capture it
Medium — frameworks exist but lack plant-specific context
Medium — high-value if partner brings domain expertise
Build core + partner on tooling
Digital twin
Very high — requires simulation engineering, physics modelling, real-time data integration
Medium — platforms available (NVIDIA Omniverse, Siemens, PTC)
High — complexity warrants deep partnership
Partner — strategic, long-term
Supply chain AI
High — market data, Tier-N visibility, and scenario modelling require specialist tooling
High — proven platforms available at scale
Low — not needed for standard capabilities
Buy — proven platform
Battery quality AI (EV)
Low — highly specialised, fast-evolving, few internal experts available
Medium — emerging platforms with EV-specific models
High — EV-specialist partner with domain depth is optimal
Partner — EV domain specialist
Roadmap KPIs
How to Measure AI Programme Progress Against the Roadmap
AI Production Deployment Rate
Target: >60% of initiatives
Percentage of AI initiatives that have reached production deployment (serving live decisions) versus pilot or proof-of-concept stage. The most important governance metric — any programme with less than 40% of initiatives in production is accumulating pilot debt faster than it is creating value.
Data Platform Coverage
Target: >90% of assets
Percentage of production assets generating clean, standardised, retrievable data in the unified namespace. The foundation metric — no AI application can operate reliably on assets whose data is not in the platform. Rising coverage is the leading indicator of future AI deployment capacity.
AI-Attributable OEE Improvement
Target: +4pp by 2027
OEE improvement attributable specifically to AI interventions, measured against the pre-AI baseline on the same asset set. Requires careful methodology — natural improvement, investment in equipment, and workforce changes must be separated from the AI contribution. This is the primary board-level ROI metric.
Phase Gate Completion Rate
Target: 100% on time
Percentage of phase gate criteria met on schedule as defined in the roadmap. A programme that misses its 2026 phase gate criteria will not recover to 2028 intelligence-phase targets without a significant budget and scope correction. Phase gate discipline is the management instrument for roadmap adherence.
AI Competency Index
Target: Level 3 by 2027
Internal AI competency measured across five dimensions: data engineering, model development, deployment operations, AI governance, and domain-AI integration. Level 1 is dependent on external vendors for all AI work. Level 3 means the internal team can fine-tune, deploy, and monitor models independently. Level 5 means original model development capability in-house.
Cost per AI Decision
Trend: decreasing
Total AI programme operating cost divided by the volume of AI-assisted decisions across all deployed applications. Should trend downward as infrastructure is amortised and model efficiency improves. A rising cost-per-decision after Year 2 indicates poor model architecture decisions or excessive vendor dependency that is not declining with scale.
Strategic Perspective
“
The strategic mistake I see most consistently in automotive AI programmes is treating AI as a productivity tool and measuring it against individual use case ROI. A quality vision system that reduces scrap by 18% is valuable. An AI scheduling system that improves utilisation by 7% is valuable. But the real competitive value of AI is systemic — it is what happens when quality data feeds the maintenance model, and the maintenance model feeds the scheduling system, and the scheduling system feeds the production optimisation engine, and all of them feed the digital twin that is being used to plan next year's model changeover. That systemic value is not visible in any individual use-case ROI calculation. It is only visible in a four-year programme that builds the stack deliberately. The plants that will define 2030 manufacturing benchmarks are the ones whose leadership teams decided in 2025 and 2026 that AI was an infrastructure investment, not a project portfolio. That framing change — from project to infrastructure — is the single most important strategic decision in the roadmap.
Alejandra Fuentes-Ibáñez
Managing Director, Automotive Manufacturing Strategy · 27 years advising automotive OEMs and Tier-1 suppliers on digital transformation and AI investment · Former partner at a global management consultancy · Senior advisor on three automotive AI transformation programmes in Europe and North America
Strategy Team Questions
Automotive AI Roadmap 2026–2030 — Frequently Asked
How do we justify a 4-year AI investment horizon to a board that is focused on managing EV transition capital expenditure?
The investment case is strongest when it is framed around three board-level concerns simultaneously rather than as a standalone AI budget. First, cost: AI-driven manufacturing efficiency directly offsets EV transition cost overruns — a plant running at 82% OEE with AI versus 68% without is generating cash that funds the EV transition itself. Second, risk: AI supply chain visibility and predictive quality reduce the downside scenarios that boards fear most — the production stop, the quality recall, the chip shortage that halts EV ramp. Third, competitive position: the 2030 cost structure of a plant that has not built AI capability will be structurally disadvantaged against competitors that have, and that disadvantage will be permanent, not catchable with a single capital investment. Framing the AI roadmap as EV transition insurance plus cost recovery plus competitive positioning — rather than as a technology programme — is what gets four-year board commitment in a capital-constrained environment. For a structured investment narrative framework tailored to your programme, book a strategy session with the iFactory team.
We have 12 AI pilots running but nothing at production scale. How do we reset without losing momentum or organisational credibility?
The pilot-to-production transition failure is the most common and most recoverable AI programme problem in automotive manufacturing. The reset has three components. First, triage the 12 pilots ruthlessly: identify the 2 or 3 that have the clearest path to production scale — meaning the data exists, the integration path is defined, and the business case is quantified — and declare the rest formally closed. Closing pilots is not failure; it is programme discipline. Second, address the structural reason the pilots did not scale — it is almost always data quality, IT/OT integration, or governance, not the AI itself. Fix the structural blocker before investing further in applications. Third, make the first production deployment visible and well-measured. A single production deployment with documented ROI resets organisational credibility more effectively than twelve pilots with promising results. iFactory can support the triage and reset process. Reach out to our support team to discuss a structured programme review.
How should we sequence AI deployment across multiple plants — lead plant first, or simultaneous rollout?
Lead plant first is the near-universal correct answer for automotive AI programmes — for three reasons that compound. First, AI models trained on one plant's data produce better results on that plant than generic models do anywhere, and the learnings from the lead plant's deployment substantially reduce deployment cost and timeline at subsequent plants. Second, organisational change management — the process of integrating AI into supervisor decision-making, maintenance workflows, and quality approval processes — is significantly easier to execute well at one plant than at five simultaneously. Third, the lead plant becomes the internal case study that justifies the subsequent plants' investment cases. The lead plant should be selected for data readiness and management receptivity, not for being the largest or most complex — complexity should increase as the programme matures and confidence builds. Cross-plant rollout typically begins 12 to 18 months after lead plant production deployment.
What does the AI maturity gap between leading Chinese OEMs and Western OEMs actually mean for competitive positioning by 2028–2030?
The gap is real and its consequences are specific rather than generalised. Chinese OEM AI deployments — particularly at BYD, CATL (supply chain), and several emerging NEV manufacturers — are characterised by higher levels of vertical integration (data platform, model development, and deployment all in-house), faster iteration cycles, and deeper EV-specific AI capability, particularly in battery formation optimisation and cell grading. By 2028, the projected advantage in manufacturing cost per unit for AI-mature Chinese EV producers versus Western non-AI-native producers is estimated at 8 to 15%, driven primarily by yield differences in battery production and OEE differences in assembly. For Western OEMs competing in overlapping segments, this is a structural cost disadvantage that cannot be overcome by labour or logistics optimisation alone. The roadmap above is designed specifically to close this gap within the 2026 to 2030 window — but it requires starting the 2026 foundation phase before the end of this calendar year. For a competitive benchmarking analysis specific to your segment and production profile, book a session with the iFactory automotive strategy team.
How do we ensure AI model performance does not degrade over time as production conditions and product mixes change?
Model drift is the most underestimated operational risk in automotive AI programmes. Production AI models are trained on historical data that reflects the conditions at training time — the product mix, the material suppliers, the tooling state, the seasonal temperature profile. When any of these change — a new material lot, a new model variant, an equipment change — the model's prediction accuracy degrades, often silently, until a performance review catches it or a quality escape makes it visible. The solution is a formal MLOps pipeline: automated performance monitoring on every deployed model, drift detection triggers that flag when model output distribution shifts beyond a threshold, a retraining protocol that specifies when and how models are updated, and a version control system that allows rollback to a previous model version if a retrained model underperforms. This infrastructure must be part of the 2026 foundation phase — it cannot be retrofitted cheaply onto models that are already in production. iFactory's platform includes drift monitoring and retraining triggers as a standard component of every production deployment. Contact our support team for technical specifications of the MLOps architecture.
The Roadmap Exists. The Window Is Open. The Sequence Matters.
Start the 2026 Foundation Phase Before the Fast-Follower Window Closes
iFactory works with automotive OEMs and Tier-1 suppliers to design, sequence, and execute the full AI roadmap from 2026 infrastructure through 2030 operational autonomy. The engagement begins with a maturity assessment that benchmarks your current programme against the roadmap above, identifies the specific structural blockers preventing scale, and delivers a prioritised 90-day action plan for phase progression — with investment ranges, organisational requirements, and vendor recommendations for each capability.