Paint is often the biggest source of rework in a vehicle plant, yet leadership meetings still open with a slide of last week's averages. By the time a drop in first-pass yield reaches the boardroom, thousands of bodies have been painted and the cause has changed. A leadership dashboard should answer three questions at a glance: how many vehicles went through clean, how many defects each hundred carried, and where the repair hours went. Everything else should sit one click below. Plant leaders can see how iFactory AI builds a live paint scorecard from inspection data before they agree on a KPI set.
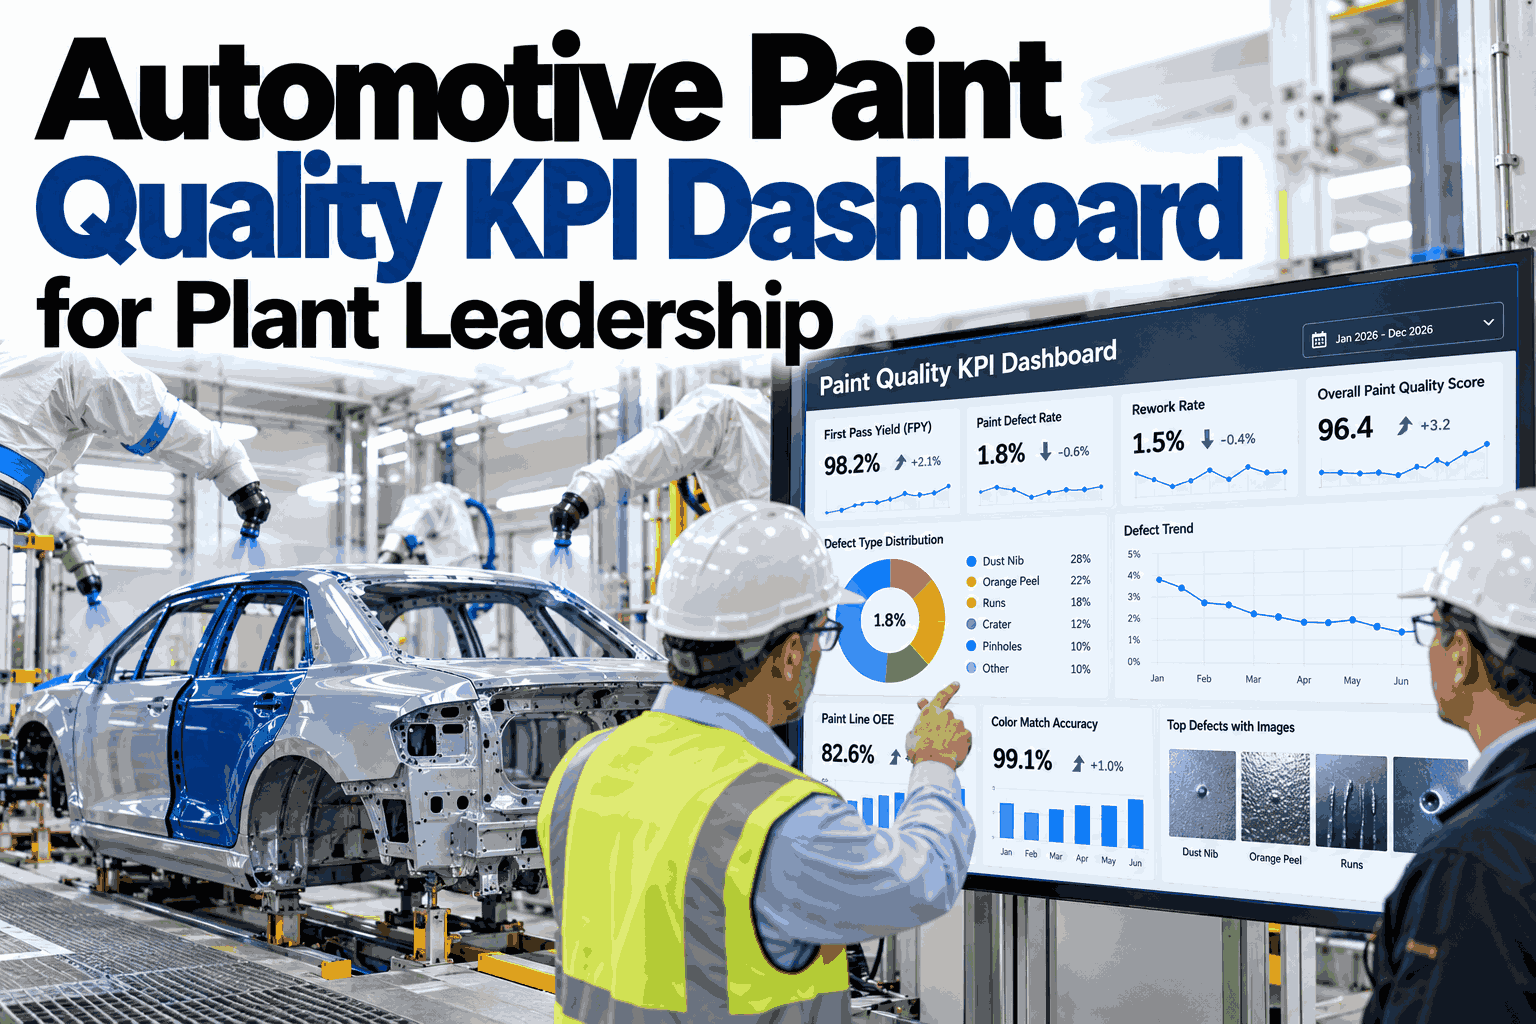
Automotive Paint Quality KPI Dashboard for Plant Leadership
Three headline KPIs, one drill-down path and a review rhythm that keeps paint quality in front of leaders every day.
What Leadership Needs From a Paint Dashboard
A good dashboard is short. It shows the current state, the trend and the place to look next.
Where is yield right now, compared with the target for this shift?
Is quality improving, flat or slipping over the last several weeks?
Which defect type, booth or shift is behind the movement?
If a number cannot lead to a decision, it belongs on a second screen, not on the leadership view.
The Three Headline KPIs
Define each one in writing so every shop and shift counts the same way.
Vehicles that pass paint inspection with no repair, divided by vehicles painted.
Total defects found divided by vehicles inspected, multiplied by 100. It can exceed 100 because one body can carry several defects.
Vehicles sent to spot repair, polish or repaint, divided by vehicles painted.
A Worked Example: One Day, 400 Vehicles
The figures are illustrative and show how the three KPIs relate.
Put Paint Yield on One Live Screen
Book a 30-minute session and iFactory AI will show first-pass yield, defect rate and repair rate updating from your own inspection data.
Sketch of the Leadership View
The mock-up below pairs a yield trend with a defect ranking. Values are illustrative.
The trend shows progress, and the ranking says the next fight is dirt. Together they tell leaders where to send resources.
The Drill-Down Ladder
Every headline number should open into the layer below it, down to a single body.
Review Rhythm for Leaders
The same data serves three meetings. Each has a different question.
Yesterday's yield, top defect and any booth alarms. Ten minutes, standing, actions assigned.
Trend, root causes and repair hours. Check that last week's actions moved the number.
Cost of repair, target progress and investment decisions for the paint shop.
KPI Scorecard Template
Copy this table and complete it before building any dashboard.
| KPI | Formula | Review | Owner |
|---|---|---|---|
| First-pass yield | Clean vehicles / vehicles painted | Daily | Paint shop manager |
| Defects per 100 vehicles | Defects / vehicles x 100 | Daily | Quality lead |
| Repair rate | Repaired vehicles / vehicles painted | Daily | Repair area lead |
| Repair hours per vehicle | Repair labor hours / vehicles painted | Weekly | Operations manager |
| Top defect share | Defects of one type / all defects | Weekly | Process engineer |
Pitfalls That Mislead Leaders
A dashboard is only as honest as its definitions.
Different counting rules
If one shop counts in-line polish as clean and another does not, comparisons fail.
Sampling versus full inspection
Small samples hide short bursts of defects that full inspection would catch.
Targets without a baseline
Set goals only after four weeks of consistent data on the same definitions.
Averages that hide shifts
Always show yield by shift, since night and day results often differ.
Where iFactory AI Fits
iFactory AI turns surface inspection results into a leadership scorecard that updates as bodies leave the booth.
Live KPI tiles
Yield, defect rate and repair rate refresh continuously from inspection data.
Drill to the vehicle
Open any KPI down to the booth, zone and the image of the defect itself.
Defect ranking
Defect types are ordered by share and cost so the biggest loss comes first.
Ask in plain language
Leaders can ask why yield fell on nights and see the ranked drivers.
Frequently Asked Questions
What is a good first-pass yield for a paint shop?
It depends on the vehicle, colours and process, so compare against your own baseline and best demonstrated rate first. External benchmarks vary widely and are rarely defined the same way. Aim for steady gains from a clear baseline. You can review baseline setting on your own data in a live session.
Why can defects per 100 vehicles exceed 100?
One body can have several defects, such as two dirt nibs and a sag. The measure counts defects, while first-pass yield counts vehicles. Both are useful, and leaders should read them together. To see both on one screen, request a scorecard walkthrough with the iFactory AI team, or ask support about KPI setup.
How often should the dashboard refresh?
Live or near-live is best for the shop floor, while leaders may review hourly or per shift. Slow refresh hides a problem until it has grown. Automated capture makes frequent updates easy. A short product tour of live refresh shows how it looks in practice.
Can the dashboard include cost of repair?
Yes. Multiply repair hours and material by your own rates to show cost per vehicle and per defect type. This helps rank problems by money, not just count. See how repair cost is added to the scorecard in a guided session.
How do we roll the dashboard out across plants?
Agree the definitions once, build the scorecard on one plant and copy it to others. Shared definitions let leaders compare sites fairly. Start with the plant that has the clearest data. Schedule a multi-plant rollout walkthrough to see a typical plan.
Give Leaders One Live View of Paint Quality
iFactory AI turns inspection data into a scorecard leaders can trust and drill into. Book a walkthrough to see it on your paint shop.