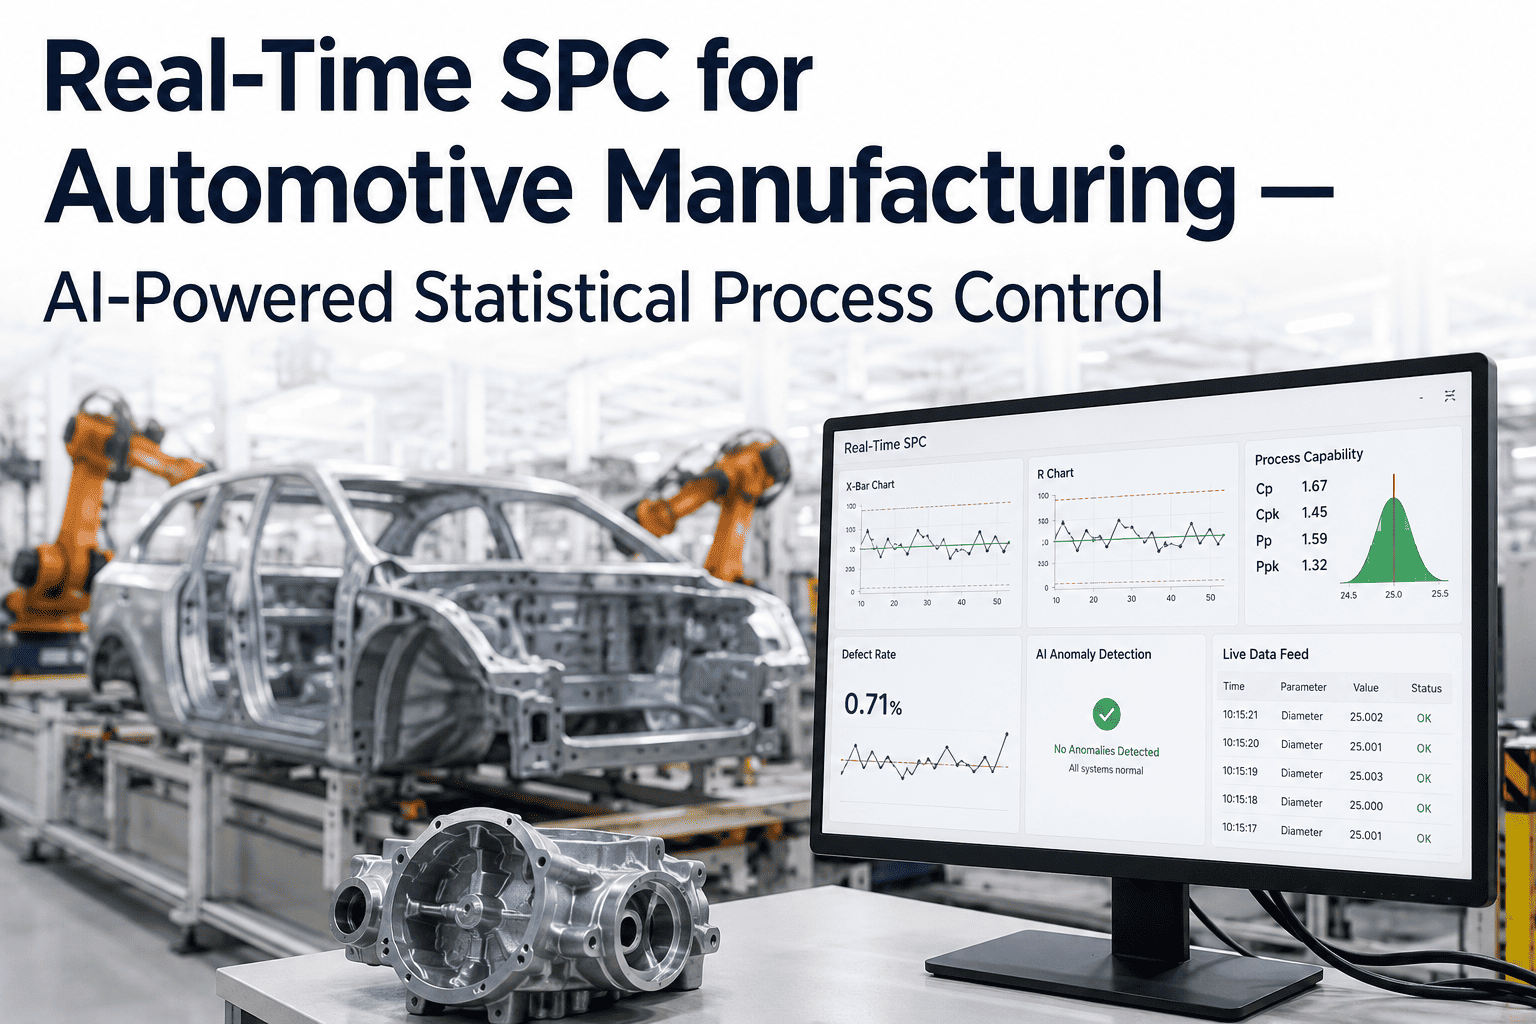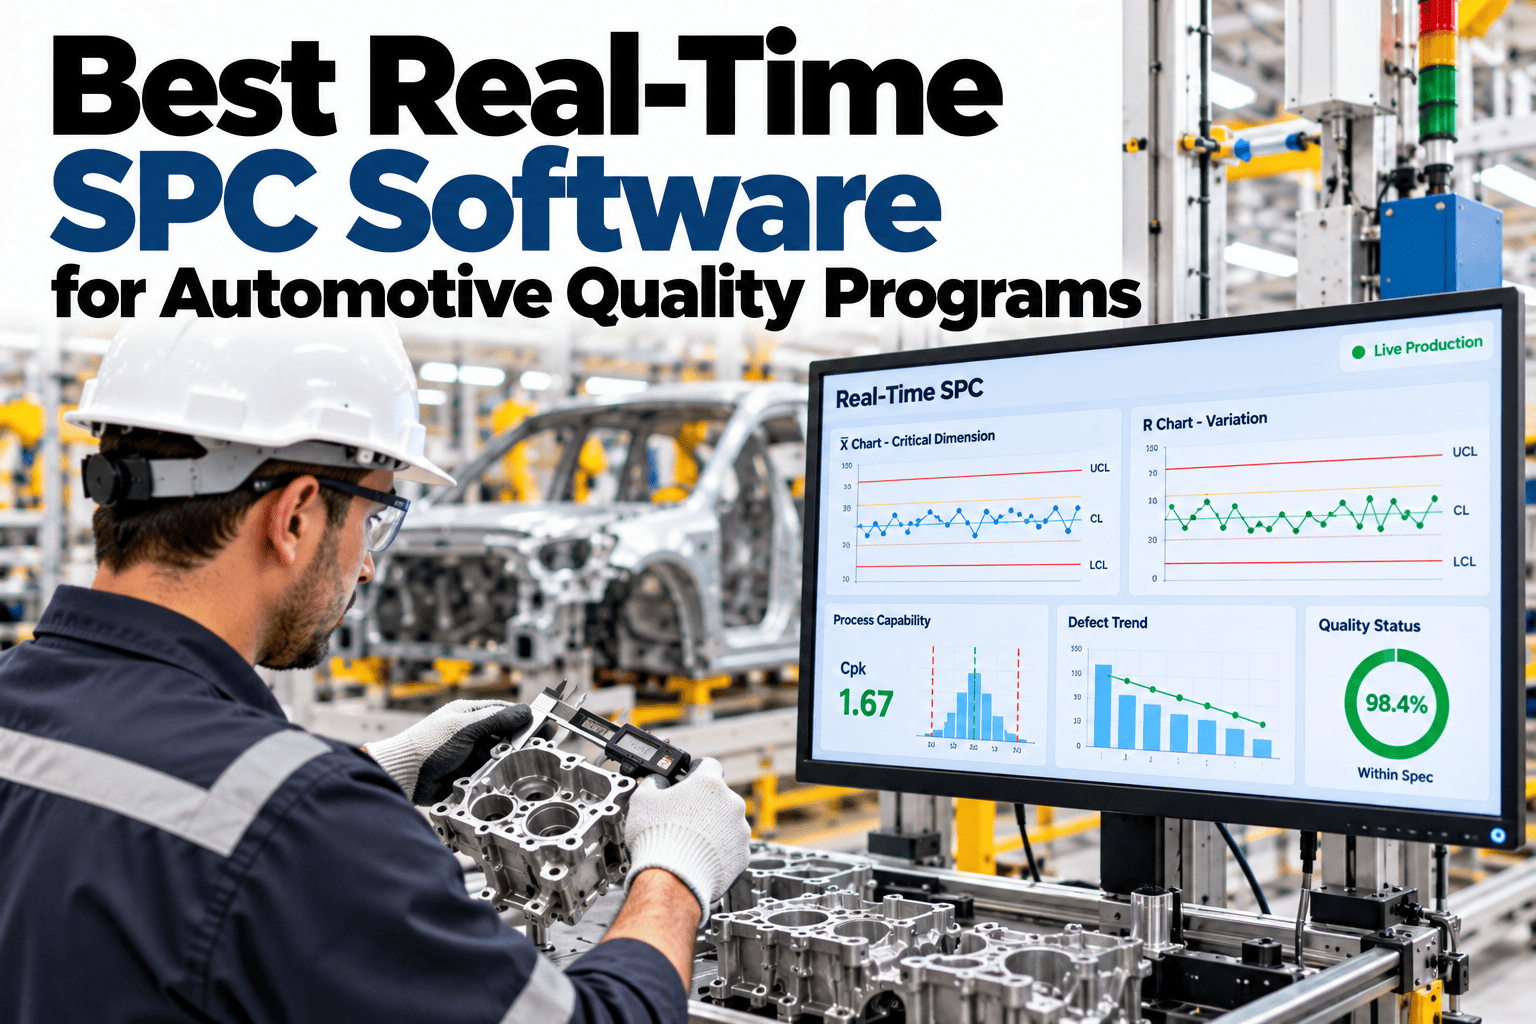
Statistical process control is supposed to catch a process drifting out of spec before it produces a bad part, yet in many automotive plants the control chart is still built at the end of the shift from a spreadsheet someone updates by hand. By the time that chart shows a trend, the parts behind it are already made. Real-time SPC flips the order: measurements feed the chart as parts are produced, Cpk and Ppk recalculate automatically, and an out-of-control signal reaches the operator before the next part leaves the station. That shift turns SPC from an audit artifact into an operational tool the floor actually uses. Quality teams evaluating SPC platforms can see a live control chart update as parts are measured before choosing a system.
Best Real-Time SPC Software for Automotive Quality Programs
Live control charts, automatic Cpk and Ppk, and out-of-control alerts that make SPC an operational tool, not a paper audit.
Illustrative control chart: one point breaching the upper control limit triggers an alert
Why End-of-Shift SPC Misses the Point
A chart built after the fact can only tell a story. It cannot stop a problem from happening in the first place.
A drift visible at shift end means every part made since it started is already in question.
Hand-entered measurements introduce transcription errors and delay the chart further.
A chart built only to satisfy an audit rarely gets used to actually adjust the process.
Real-time SPC removes the lag between measurement and signal, which is the entire point of control charting in the first place.
Reading Cpk and Ppk Automatically
Both indices answer a slightly different question, and automatic calculation keeps both current without manual spreadsheet work.
Short-term process capability, calculated from a stable, in-control sample of data.
Long-term process performance, including shift-to-shift and day-to-day variation.
See Cpk and Ppk Calculated on Your Own Gage Data
Book a 30-minute session and bring recent measurement data. iFactory AI will show live Cpk and Ppk calculation and alerting.
What Triggers an Out-of-Control Alert
Most SPC rules follow a small set of recognized patterns rather than a single point crossing a limit.
What iFactory AI Supports
SPC runs from live gage and sensor data, with charts and indices that update as parts are measured.
Live Control Charts
Charts update as each measurement arrives, instead of being rebuilt at shift end.
Automatic Cpk and Ppk
Both indices recalculate continuously as new data feeds the chart.
Pattern-Based Alerts
Out-of-control signals follow recognized SPC rules, not just a single limit breach.
Gage Connectivity
Digital gages and sensors feed measurements directly, removing manual entry.
iFactory AI ships on a pre-configured NVIDIA server, racked and ready with software pre-loaded. Scope covers gage integration, control limit setup, team training and 24x7 remote monitoring.
Expert Review
The value of real-time SPC rarely shows up as a dramatic save. It shows up as a dozen small adjustments an operator makes through a shift that never would have happened waiting for an end-of-shift chart. Those small adjustments are what keep Cpk stable instead of discovering a problem after a batch has already shipped.
Pattern-based alerting matters more than most teams expect going in. A single point outside the limit is rare; a seven-point run on one side of the center line is far more common and is usually the earlier, cheaper warning to act on.
Frequently Asked Questions
Do we need new gages to use real-time SPC?
Most digital gages already in use on the floor can connect directly, and manual gages can often be upgraded with a low-cost data connector rather than full replacement. The goal is to remove manual transcription, not replace equipment that already works. Bring your current gage list to a session to check compatibility.
Can control limits be set differently per part or characteristic?
Yes, control limits and sampling frequency are configured per characteristic, since a critical dimension and a cosmetic check rarely need the same level of scrutiny. This keeps alerting focused on what actually matters for each part. Ask support about setting limits for a new part family.
How are out-of-control alerts delivered to the floor?
Alerts can route to the station display, a supervisor's dashboard, or a notification system, depending on how the plant wants to respond. The goal is getting the signal to someone who can act on it within the same shift, not buried in a report reviewed days later. See alert routing options in a live walkthrough.
Can historical SPC data be imported from our current system?
Yes, historical measurement data can be imported to establish baseline control limits and capability indices before go-live, so the system does not start from zero. This also supports year-over-year trend comparisons once the new system is running. Contact support about importing your historical data.
Does this replace our quality audit documentation?
Control charts, Cpk and Ppk values generated in real time can be exported for audit documentation, so the same system serves both operational control and audit evidence. This removes the need to maintain a separate manual chart just for the audit record. Request a sample audit export to review the format.
Catch Drift While It's Still a Signal, Not a Scrapped Batch
iFactory AI updates control charts, Cpk and Ppk as parts are measured. Book a walkthrough on your own gage data.