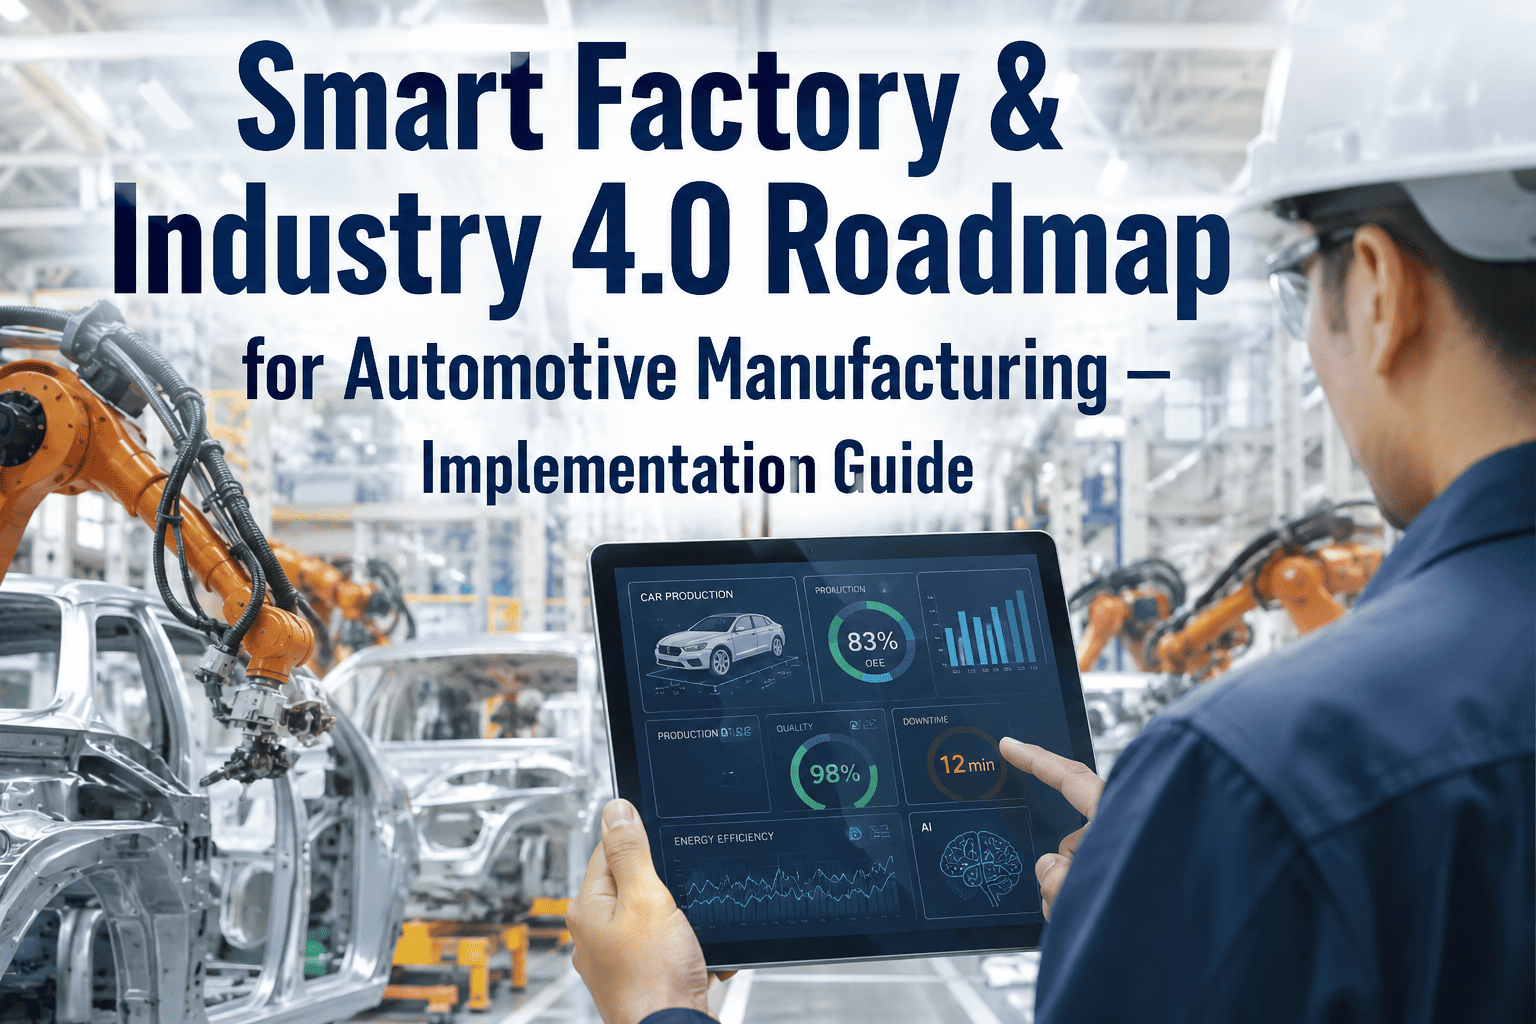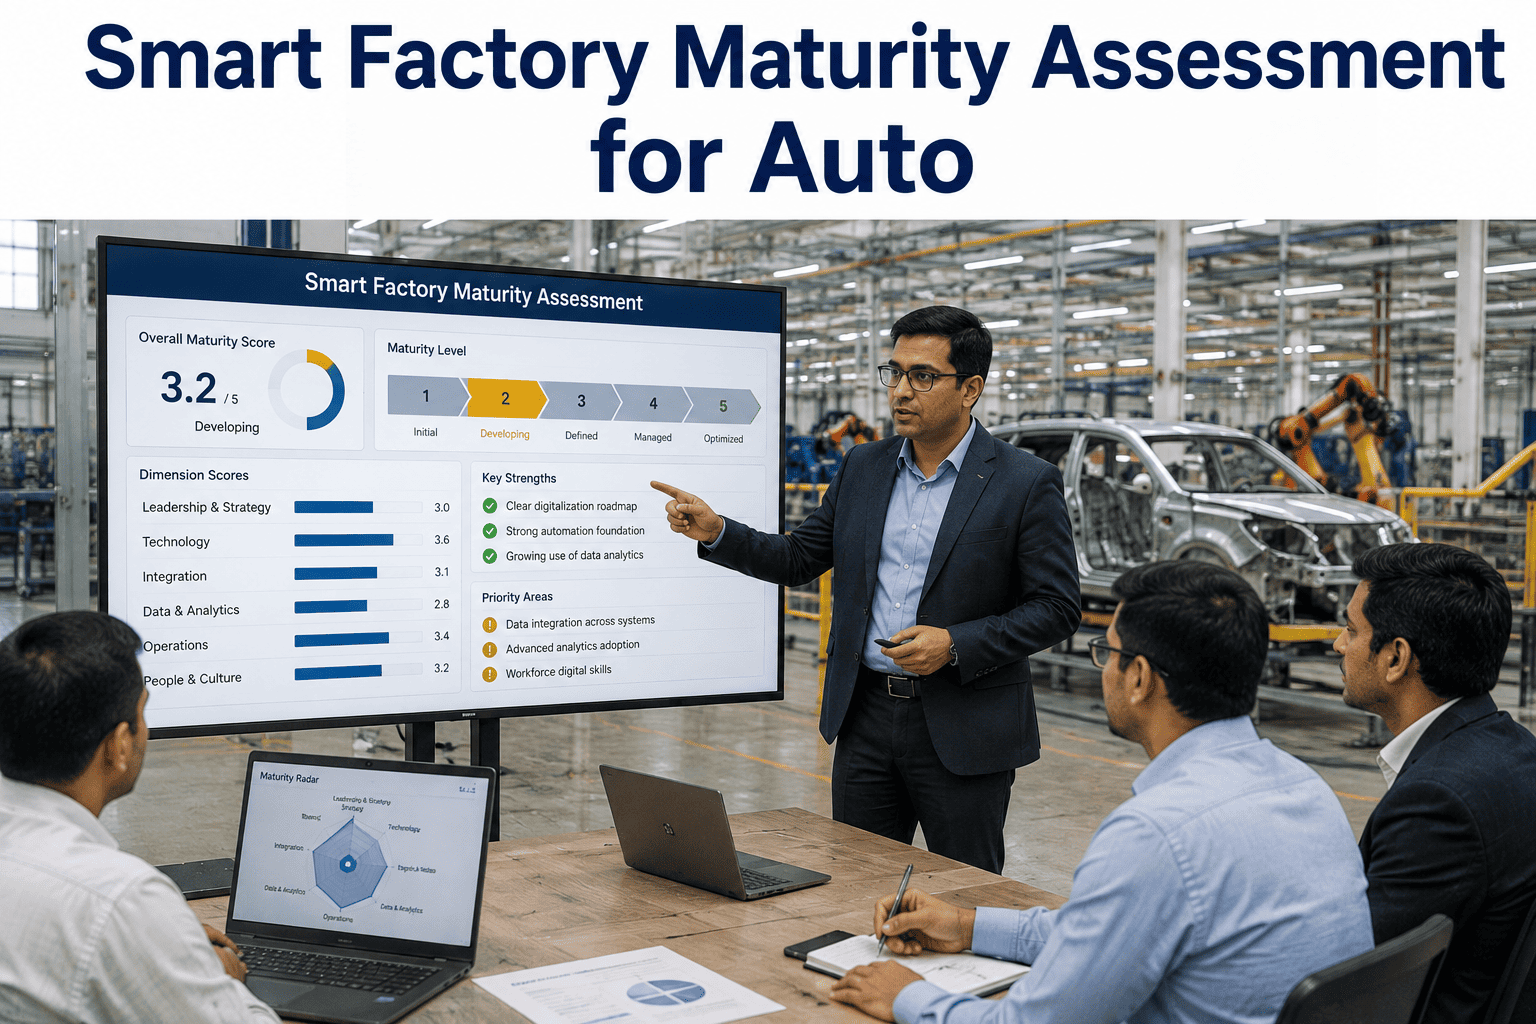
Most automotive plants have invested in automation, connectivity, and data systems over the past decade, yet when a plant head is asked to describe their smart factory maturity level, the answer is usually a guess rather than a measured assessment. The problem is not a lack of technology on the floor. The problem is that maturity has never been measured systematically across the dimensions that actually determine whether AI investments will deliver returns or become expensive shelfware. Without an honest baseline, every vendor pitch sounds equally plausible and every budget request lacks the evidence to justify prioritization. If you are a plant head preparing an AI investment case for the next fiscal cycle, the first step is not selecting a technology. It is knowing where you actually stand today. Book a Demo with iFactory AI to walk through a structured maturity assessment calibrated for automotive operations.
Smart Factory Maturity Assessment for Automotive Plants — Know Your Baseline Before You Invest
iFactory AI delivers a structured maturity assessment framework across data infrastructure, automation depth, AI readiness, organizational capability, and integration maturity — designed specifically for automotive plant heads building investment roadmaps.
The Five Levels of Automotive Smart Factory Maturity
Every automotive plant sits somewhere on a maturity spectrum that runs from purely reactive operations to fully autonomous decision-making. The five-level model below is not an academic framework. It is a practical classification tool that maps directly to the types of AI use cases a plant can successfully deploy, the data infrastructure those use cases require, and the organizational capabilities needed to sustain them. Most automotive plants in North America and Europe currently sit between Level 2 and Level 3, which creates a specific set of opportunities and constraints that a maturity assessment must surface honestly before any investment plan is built.
Autonomous Optimization
Target StateAI systems continuously optimize production parameters, supply chain coordination, and quality control without human intervention for routine decisions. Human roles shift to exception management, strategic oversight, and system governance. The plant operates as a self-tuning system where AI agents manage scheduling, thermal profiles, maintenance sequencing, and energy consumption in real time. Fewer than 2 percent of automotive plants globally have reached this level, and those that have invested eight or more years in progressive capability building through Levels 1 through 4.
Predictive and Prescriptive Operations
AdvancedAI models predict equipment failures, quality deviations, and demand shifts 24 to 72 hours in advance and generate prescriptive recommendations that operators approve or modify before execution. Predictive maintenance covers critical assets, quality prediction models run on every major line, and production scheduling incorporates AI-generated scenarios. The organizational capability exists to evaluate AI recommendations critically rather than accepting or ignoring them wholesale. Approximately 10 to 15 percent of automotive plants operate at this level.
Connected and Analytical
IntermediatePlant floor systems are networked with centralized data infrastructure. Historians, MES, and ERP systems exchange data, and basic analytics dashboards provide visibility into OEE, energy, and quality trends. However, analysis is primarily descriptive rather than predictive, and most decisions still rely on human interpretation of dashboard data. This is where the majority of automotive plants sit today, and it is also where the largest maturity gap exists between perceived capability and actual operational impact. Plants at Level 3 have the data but not yet the analytical layer to convert it into decisions.
Automated but Siloed
FoundationalIndividual machines and cells are highly automated with modern PLCs, robotic stations, and local control systems, but data remains trapped within equipment-level silos. There is no unified view of plant performance, and cross-line or cross-process analysis requires manual data extraction and spreadsheet consolidation. Many automotive plants have invested heavily in automation hardware without building the data integration layer that would allow that automation to contribute to plant-level intelligence.
Reactive and Manual
BaselineOperations rely on operator experience, paper-based or basic digital logs, and reactive maintenance. Data collection is minimal and inconsistent. Decision-making is driven by tribal knowledge and escalation rather than systematic analysis. While rare in major automotive OEM plants, this level still exists in tier-2 and tier-3 supply chain operations and in specific legacy process areas within larger plants that have not received modernization investment.
Six Dimensions That Determine Your True Maturity Score
A single maturity number is useful for board-level communication but useless for investment planning. Plant heads need to see their maturity broken down by dimension because the gap between dimensions determines the sequencing of investments. A plant with strong automation but weak data infrastructure cannot jump to AI. A plant with excellent data systems but no organizational AI capability will build models that no one uses. The six dimensions below, each scored from 1 to 5, create the diagnostic profile that drives a credible investment roadmap.
Data Infrastructure
Covers the completeness and accessibility of plant data. Are all critical machines connected to a historian? Is data tagged with consistent naming conventions? Can an analyst query two years of production data across multiple lines in under an hour? Plants scoring below 3 on this dimension cannot support any meaningful AI deployment regardless of their automation level.
Score Range: 1–5Automation Depth
Measures the extent of automated control on the floor beyond basic machine operation. Includes automated quality inspection, adaptive process control, automated material handling, and closed-loop systems that adjust parameters without human input. High automation with low data connectivity is a common pattern that maturity assessment must flag as a risk rather than a strength.
Score Range: 1–5AI and Analytics Capability
Evaluates whether the plant has deployed, or has the infrastructure to deploy, machine learning models, predictive algorithms, or AI-assisted decision tools. This is not about having a data science team on site. It is about whether the data and compute environment can support model training, validation, and production deployment within the plant's operational context.
Score Range: 1–5Integration Maturity
Assesses how well plant systems communicate with each other and with enterprise systems. MES-to-ERP connectivity, historian-to-quality-system data flow, and maintenance-system-to-production-scheduling integration are the critical links. Plants with high individual system capability but low integration cannot execute cross-functional AI use cases like predictive quality or integrated scheduling.
Score Range: 1–5Organizational Readiness
Measures whether the plant workforce, from operators to shift supervisors to engineering leads, has the skills and mindset to work with AI-augmented decision tools. This includes data literacy, willingness to trust model recommendations, and the presence of feedback loops where operators can confirm or correct AI outputs. Technical maturity without organizational readiness is the most common reason AI projects fail in manufacturing.
Score Range: 1–5Governance and Security
Covers data governance policies, cybersecurity measures for operational technology, model validation protocols, and change management processes for AI system updates. As plants move beyond descriptive analytics into predictive and prescriptive AI, governance becomes the dimension that prevents reckless deployment. A plant scoring 4 on AI capability but 1 on governance is a liability rather than an asset.
Score Range: 1–5Dimension Scoring Criteria — What Each Score Actually Means
Self-assessment only produces honest results when the scoring criteria are specific enough to prevent subjective inflation. The matrix below defines what each score from 1 to 5 means for every dimension, giving plant heads a concrete reference that resists the temptation to score the plant one level higher than evidence supports. During iFactory AI maturity assessments, this matrix is applied through structured evidence review rather than self-report, which typically results in scores 0.5 to 1.0 points lower than initial self-assessments.
| Score | Data Infrastructure | Automation Depth | AI Capability | Integration | Org Readiness | Governance |
|---|---|---|---|---|---|---|
| 1 | Paper or local logs only, no central historian | Manual operations, minimal PLC control | No analytics beyond basic reporting | Standalone systems, no data exchange | No data literacy training or expectations | No OT cybersecurity or data policies |
| 2 | Partial historian coverage, inconsistent tagging | Modern PLCs but no closed-loop adaptation | Static dashboards, no predictive models | Point-to-point connections, manual transfers | Some Excel-trained analysts, operators not involved | Basic network security, no AI governance |
| 3 | Full historian coverage, consistent naming, queryable | Automated inspection and material handling on some lines | Pilot ML models in shadow or limited production | MES-ERP connected, cross-system queries possible | Operators use dashboards, basic data interpretation | Documented policies, model validation in place |
| 4 | Real-time data lake, standardized taxonomy, sub-second latency | Adaptive control on critical processes, automated SPC | Multiple models in production, continuous retraining | Unified data platform, all systems interoperable | Operators trust and validate AI outputs, feedback loops active | Full OT security, model governance board, audit trails |
| 5 | Edge-cloud hybrid, automated data quality, self-healing pipelines | Self-optimizing cells, autonomous quality loops | AI agents manage decisions, human-in-loop for exceptions only | Real-time digital twin, supply chain to shop floor unified | AI literacy embedded in all roles, continuous upskilling | Automated compliance, continuous risk monitoring, adaptive policies |
What Each Maturity Level Looks Like on an Automotive Shop Floor
Abstract maturity levels become actionable when grounded in specific automotive production scenarios. The three scenarios below describe the same stamping-to-assembly process at three different maturity levels, illustrating how the same physical equipment produces dramatically different outcomes depending on the data, analytics, and organizational layers built around it.
Automated but Siloed Stamping Operation
The press line runs at 12 strokes per minute with modern servo drives and automated die change. When a cushion pressure drift causes wrinkling on the third station, the inline vision system catches the defect but can only flag it. The operator stops the line, calls the die setter, who adjusts cushion pressure by trial and error over 18 minutes. The shift log records 18 minutes of downtime. No one correlates this event with the three similar events last week because the vision system data lives in a separate database from the press historian and the shift log. The plant head sees an availability number and a quality number but has no mechanism to connect them to a root cause.
Result: Reactive quality response, repeated failures, no cross-system learningConnected and Analytical Stamping Operation
The same press line now feeds vision data, press parameters, and shift logs into a unified historian. A dashboard shows that cushion pressure drift correlates with 78 percent of detected wrinkles over the past 90 days. The quality engineer can pull this correlation report in minutes instead of days. However, the insight still requires a human to notice it, interpret it, and decide to act. The plant is data-rich but analysis-dependent. The cushion pressure issue is visible but not yet actionable in real time. The plant head has better visibility but the same fundamental reactive response pattern with shorter investigation time.
Result: Faster root cause identification, but still human-dependent for actionPredictive and Prescriptive Stamping Operation
The AI model monitoring cushion pressure trends detects the drift pattern 45 minutes before the quality threshold would be breached. It generates a prescriptive alert recommending a 0.3 bar cushion adjustment with 92 percent confidence, referencing the last 12 similar events where this adjustment prevented wrinkling. The operator reviews the recommendation, confirms, and the adjustment is applied automatically through the press control system. The line never stops. The quality defect never occurs. The event is logged and feeds back into the model. The plant head sees a leading indicator dashboard where potential quality events are resolved before they become actual defects.
Result: Defect prevention, zero unplanned stops, continuous model improvementInvestment Requirements and Expected Returns by Maturity Jump
Not all maturity jumps require the same investment or deliver the same return. Moving from Level 1 to Level 2 is primarily a capital expenditure on automation hardware. Moving from Level 3 to Level 4 is primarily a software and capability investment with much higher returns per dollar spent. The investment map below helps plant heads sequence investments by identifying which maturity jump delivers the highest ROI for their current position, ensuring budget is directed where it creates the most value rather than where vendor marketing is loudest.
Measured Returns from Maturity Advancement in Automotive Plants
The ROI metrics below are drawn from structured maturity advancement programs where plant heads established baseline maturity scores, executed targeted investments to close specific dimension gaps, and measured outcomes against pre-deployment performance. These are not vendor-reported case studies. They are plant-reported outcomes from programs where iFactory AI provided the assessment framework and analytics platform. The data demonstrates that the highest returns come not from the absolute maturity level but from closing the most critical gap in the maturity profile.
A tier-1 stamping plant scored 4 on automation but 2 on data infrastructure. Closing the data gap to 3.5 enabled AI models that recovered 11 OEE points within 9 months, primarily from predictive maintenance and micro-stoppage detection on press lines.
An powertrain plant advanced from Level 3 to Level 4 on AI capability by deploying predictive quality models on machining lines. Customer escape rates dropped 42 percent in the first year, with the majority of prevented defects originating from process drift patterns invisible to SPC alone.
A vehicle assembly plant that invested in operator AI literacy and feedback loop design before deploying predictive models saw 3.5 times higher model adoption rates and 2.8 times faster time-to-value compared to a sister plant that deployed the same models without the organizational readiness investment.
A paint shop that advanced integration maturity from 2 to 4 by connecting maintenance systems to production scheduling and quality data reduced maintenance costs 28 percent through optimized preventive scheduling and elimination of redundant inspections across interoperable systems.
12-Month Roadmap From Assessment to Measured Maturity Advancement
A maturity assessment that does not produce an actionable roadmap is an academic exercise. The 12-month structure below takes a plant from initial assessment through baseline establishment, targeted gap closure, first AI deployment, and measured outcome validation. Each phase has defined deliverables that the plant head can present to leadership as evidence of progress, creating the accountability framework that prevents smart factory investments from drifting into open-ended technology exploration.
Structured Assessment and Baseline Establishment
Execute the six-dimension maturity assessment through structured evidence review, operator interviews, and system audits. Produce a scored maturity profile with gap analysis identifying the one or two dimensions whose closure will deliver the highest ROI. Establish quantitative baselines for OEE, quality escape rate, maintenance cost ratio, and decision latency on the target lines. Document current-state process maps for the first three AI use case candidates.
Infrastructure Gap Closure and Data Preparation
Execute the infrastructure investments identified in Phase 1, typically historian extensions, data tagging standardization, network connectivity for isolated systems, and integration middleware deployment. Simultaneously, begin data extraction and preparation for the first AI use case. This parallel execution is critical because infrastructure work alone does not generate visible returns and can lose executive sponsorship if not paired with an analytical deliverable. By month 5, the first use case should have a validated dataset ready for model training.
AI Deployment and Organizational Enablement
Deploy the first AI use case into production with human-in-the-loop validation. Begin operator and supervisor training on interpreting AI recommendations, providing feedback, and understanding model confidence levels. Launch the feedback loop mechanism where operator confirmations and corrections flow back into model retraining. This phase is where organizational readiness investment pays off or where its absence causes failure. For structured guidance on AI deployment sequencing, Book a Demo with the iFactory AI team.
Outcome Measurement and Second-Use-Case Planning
Measure outcomes against Phase 1 baselines with statistical rigor. Re-run the maturity assessment on the same six dimensions to produce a before-and-after maturity profile. Quantify the ROI of the first use case and present the evidence to leadership as justification for the next investment tranche. Select the second and third use cases based on updated maturity scores and lessons learned from the first deployment. The goal of month 12 is not a finished transformation. It is a proven process that can be repeated and scaled with increasing speed and confidence.
Smart Factory Maturity Assessment — FAQs for Automotive Plant Heads
How long does a structured smart factory maturity assessment take for an automotive plant?
A thorough six-dimension assessment typically requires four to six weeks for a mid-size automotive plant. This includes two weeks of system audits and data infrastructure review, one week of structured interviews with operators, supervisors, engineers, and maintenance leads, and one to two weeks of analysis and scoring. The assessment can be accelerated to three weeks for single-line pilot scopes, but full-plant assessments need the longer timeline to produce reliable dimension scores. Rushed assessments consistently produce inflated scores because evidence gaps are filled with assumptions rather than verification. For a timeline tailored to your plant scope, Book a Demo to discuss with our assessment team.
What is the most common maturity gap found in automotive plants today?
The most frequently identified gap is between Automation Depth and Data Infrastructure. Automotive plants have invested heavily in modern automation equipment over the past 15 years, frequently scoring 3.5 to 4.5 on Automation Depth. However, Data Infrastructure scores typically lag by 1.0 to 1.5 points because the data generated by that automation was never integrated into a unified, queryable infrastructure. This creates a dangerous illusion of maturity where the plant looks advanced on the floor but cannot support the AI use cases that would capitalize on the automation investment. Closing this specific gap is where iFactory AI's assessment framework delivers the highest immediate ROI for most automotive plants.
Can a plant skip maturity levels and jump directly to AI deployment?
Individual use cases can sometimes be deployed at a higher maturity level than the plant's overall score, but this is the exception rather than the rule and it carries significant risk. A plant scoring 2 on Data Infrastructure cannot sustain AI models that require clean, labeled, accessible training data regardless of how advanced the AI platform itself is. Attempting to skip levels typically results in AI proof-of-concepts that perform well in controlled demos but fail in production because the supporting infrastructure and organizational capabilities are not in place. The maturity assessment exists specifically to prevent this waste by identifying the prerequisite gaps that must be closed before AI investments can deliver returns. For help evaluating your readiness for specific AI use cases, contact iFactory Support.
How does this assessment differ from Industry 4.0 maturity models from consulting firms?
Most Industry 4.0 maturity models are designed as benchmarking tools for board-level presentations. They produce a single aggregate score and a benchmark position against an industry average. The iFactory AI assessment framework is designed as an investment planning tool for plant heads. It produces a six-dimension profile rather than a single score, identifies the specific dimension gap whose closure delivers the highest ROI, maps investment requirements to each maturity jump, and includes a 12-month execution roadmap with measurable phase gates. The difference is between knowing where you rank and knowing what to do next with a justified budget request.
What evidence do we need to prepare before starting the assessment?
Minimal preparation is required because the assessment process is designed to gather evidence rather than rely on pre-prepared submissions. However, having the following available accelerates the process: a current plant network diagram showing connected systems, a list of all historians and data platforms with their coverage scope, the last 12 months of OEE reports for target lines, and an organizational chart showing reporting relationships from operators to the plant head. The assessment team will conduct independent verification of all claims against actual system access and data quality checks, so the value of preparation is in speed rather than influencing the outcome. To schedule your assessment kickoff, Book a Demo with iFactory AI.
Stop Guessing Your Maturity — Measure It, Then Invest With Evidence
Connect with iFactory AI to execute a structured six-dimension maturity assessment for your automotive plant, identify the highest-ROI gap to close, and receive a 12-month investment roadmap with measurable phase gates that justify your next AI budget request.