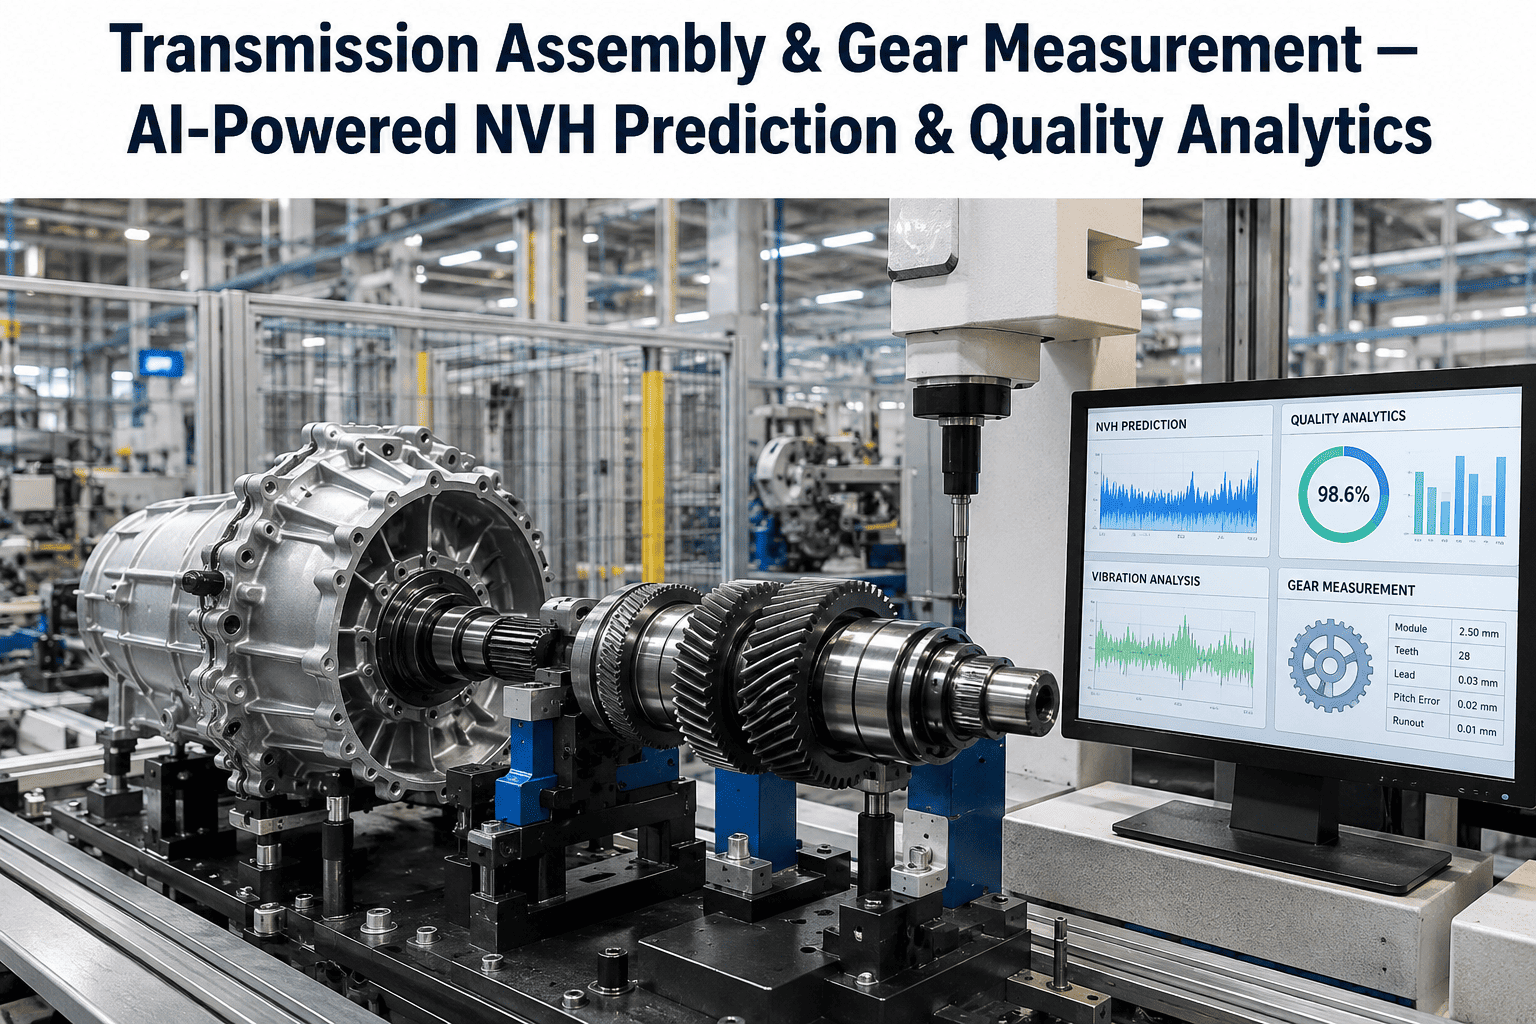
A transmission that passes every dimensional gear check can still fail end-of-line noise testing, and an engineer staring at a clean inspection report has no easy way to explain why. Gear whine and rattle come from interactions between tooth profile, lead, runout, and surface finish that no single measurement fully captures on its own. Correlating those measurements against actual NVH test results is where most quality teams get stuck, checking each gear parameter in isolation while the noise complaint that reaches warranty traces back to a combination nobody flagged. AI-powered gear measurement analytics changes this by learning which parameter combinations actually predict a noisy transmission before it ever reaches final test.
Predict Transmission NVH Failures From Gear Measurement Data, Not After Final Test
Correlate gear tooth profile, lead, and runout with end-of-line noise results to catch the parameter combinations that actually cause warranty-driving NVH complaints.
Why Isolated Gear Checks Miss Real NVH Risk
Standard gear inspection checks profile, lead, pitch, and runout against individual tolerance bands, and a gear that passes all four checks is stamped good. The problem is that NVH performance is rarely driven by a single parameter crossing its limit, it is usually driven by a specific combination, for example a profile deviation near the middle of its tolerance band combined with a runout value near the upper edge of its own band, that together produce a mesh interaction loud enough to fail acoustic testing even though every individual number looked acceptable on paper.
This is exactly the kind of pattern that traditional pass or fail gauging cannot see, because it requires correlating four or five continuous variables against a downstream acoustic outcome measured on a different machine entirely, often hours or shifts later. Machine learning models trained on historical gear measurement data paired with end-of-line NVH results can learn these interaction effects and score new gears for predicted noise risk the moment they come off the gear inspection machine, long before a transmission ever reaches the test cell.
iFactory correlates gear tooth profile, lead, and runout data against your end-of-line NVH results automatically, flagging risky combinations before assembly.
Five Gear Measurement Parameters That Drive NVH Outcomes
Deviation from the ideal involute tooth shape across the active profile. Profile errors change the contact pattern and load distribution during mesh.
Deviation along the tooth's helical or straight line across its width. Lead errors concentrate load at one end of the tooth, a common source of localized noise.
Radial deviation of the gear as it rotates on its axis. Excess runout produces periodic noise at a frequency tied to shaft rotation speed.
Inconsistent spacing between teeth around the gear. Uneven pitch creates irregular mesh timing, often heard as a rattle rather than a steady whine.
Micro-texture of the tooth flank affects friction and micro-impact noise during mesh, particularly relevant on ground versus shaved gear surfaces.
Correlation Snapshot: Parameter Combinations and NVH Fail Rate
The table below illustrates how NVH fail rates climb when two parameters land in adjacent risk bands simultaneously, even when each one individually would be classified as passing. This is the pattern-level insight that isolated pass or fail gauging cannot surface.
| Parameter Combination | Individually Passing | Observed NVH Fail Rate |
|---|---|---|
| Profile mid-band, runout low-band | Yes | Low |
| Profile mid-band, runout upper-band | Yes | Elevated |
| Lead upper-band, pitch variation upper-band | Yes | High |
| All parameters mid-band or better | Yes | Very low |
From Gear Machine to Test Cell: Closing the Data Loop
Gear inspection machine captures profile, lead, pitch, and runout for every gear, tagged with a unique serial or batch identifier.
Gear moves through assembly into a completed transmission, carrying its measurement identity forward through the build.
End-of-line acoustic and NVH test produces a pass, fail, or graded noise score for the assembled transmission.
The model links the test result back to the originating gear measurements, learning which combinations correlate with failures.
New gears are scored for predicted NVH risk immediately after measurement, before they ever reach assembly.
Stop discovering NVH problems at final test. Score every gear for predicted noise risk the moment it leaves the measurement machine.
What This Means for Warranty and Cost of Quality
Transmission NVH complaints are among the most expensive quality issues a powertrain plant faces after the vehicle ships, because they surface as customer-reported warranty claims rather than plant-floor scrap, and each claim carries diagnostic labor, part replacement, and goodwill cost on top of the original manufacturing defect. A model that catches the parameter combinations driving these complaints before assembly converts an expensive warranty event into an inexpensive gear sort or rework decision made on the plant floor, where the cost of catching a problem is a small fraction of what it costs once the transmission has shipped.
Beyond direct cost avoidance, this kind of correlation analysis also gives process engineering teams something they rarely have today, a data-driven answer to which specific gear-cutting or heat-treat process step is actually driving a given NVH pattern, rather than a generic instruction to tighten tolerances across the board. That specificity is what turns a recurring warranty theme into a permanently closed process issue.
Frequently Asked Questions
Can this work if our gear inspection and NVH test systems are not currently linked?
Yes, this is the most common starting point. The first step is establishing a shared identifier, typically a serial number or batch code, that follows a gear or transmission from the measurement machine through assembly to the test cell. Once that traceability link exists, historical data from both systems can be joined retroactively to train an initial correlation model, and going forward new measurements and test results link automatically. Our support team can help map out what traceability already exists in your current systems.
How much historical data is needed to find reliable correlations?
Reliable pattern detection generally requires several months of paired measurement and test data covering a meaningful number of NVH failures, since rare failure patterns need enough examples to distinguish real correlation from noise. Plants with a higher baseline NVH fail rate can often build a useful initial model faster simply because they have more failure examples to learn from, while very low fail rate lines may need a longer collection window to accumulate enough cases.
Does this replace the need for tight individual gear tolerances?
No, individual tolerance bands remain the foundation of gear quality control and should not be loosened based on correlation findings alone. What this analysis adds is a second layer of screening that catches combinations of individually passing measurements that still carry elevated NVH risk, which pure tolerance-band checking cannot detect. Think of it as a more precise risk filter layered on top of, not instead of, existing dimensional controls.
Can the model identify which upstream process step is causing a pattern?
With sufficient process data tagged alongside the gear measurements, such as which cutting machine, heat-treat batch, or grinding wheel produced a given gear, the model can often narrow a recurring NVH pattern down to a specific upstream source rather than just flagging the symptom at the gear measurement stage. This turns a generic tightening instruction into a targeted process fix, which is usually far more effective and less costly to implement across the line.
What kind of NVH fail rate reduction is realistic after deployment?
The achievable reduction depends heavily on how concentrated the current fail rate is around a small number of identifiable parameter combinations versus spread broadly across many contributing factors. Plants with a few dominant failure patterns typically see the fastest and largest improvement once those patterns are identified and addressed at the source. Book a demo with your own historical gear and NVH data to get a realistic estimate for your specific program.
Bring your gear measurement and NVH test data to a live session and see the correlation patterns iFactory finds in your own transmission line.