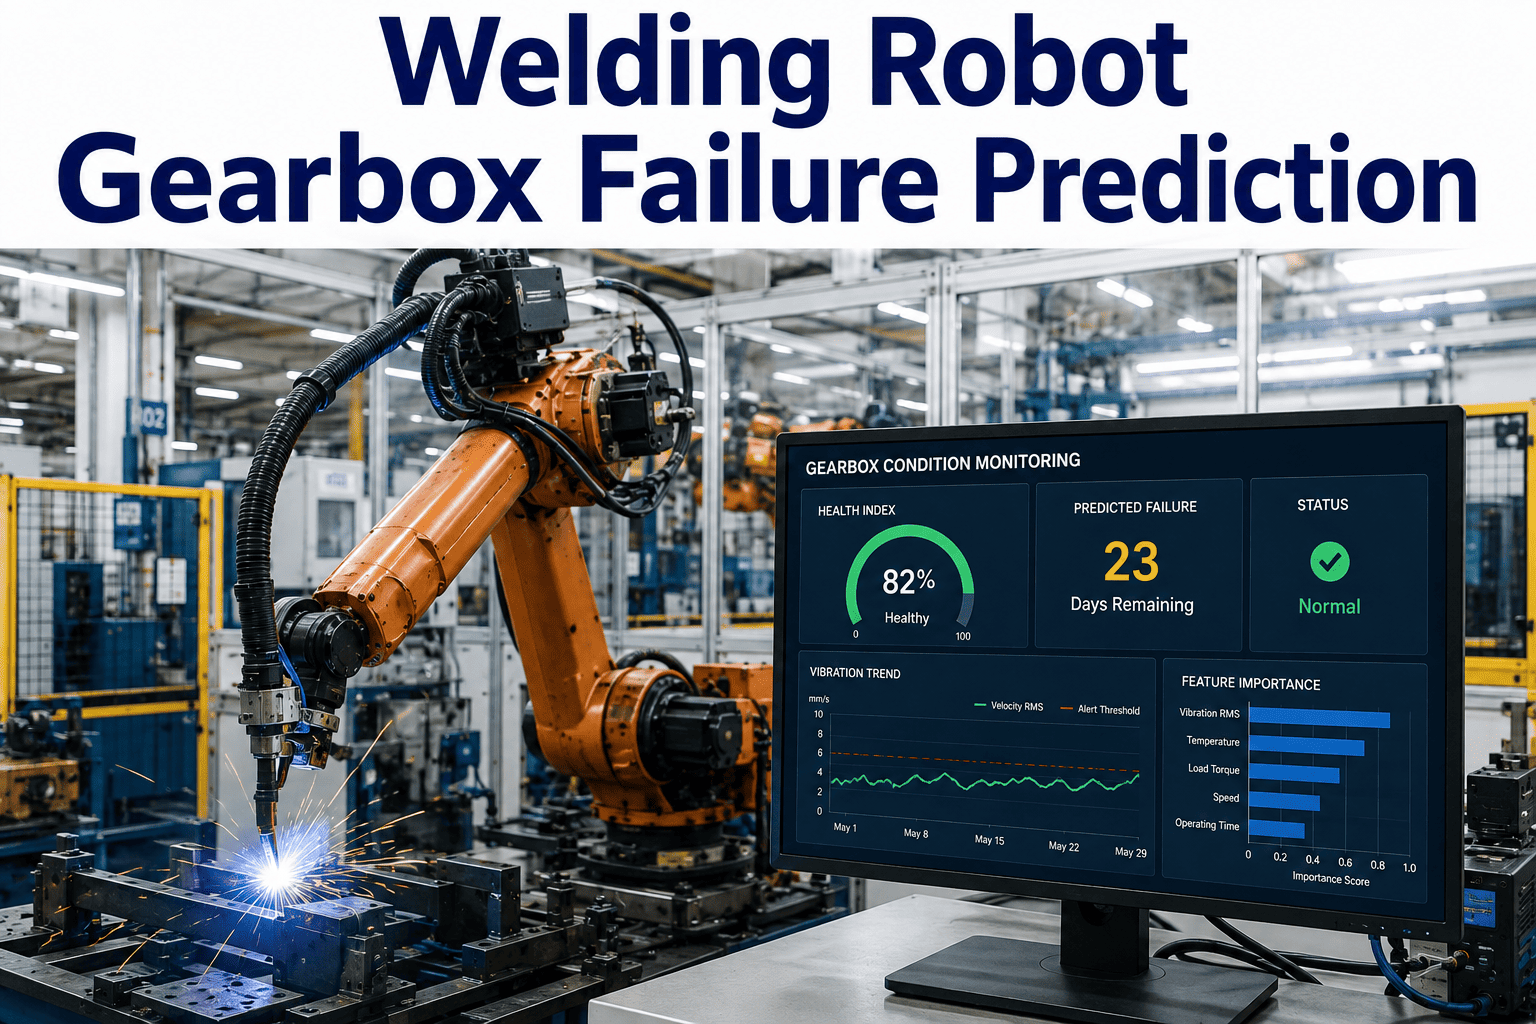
A welding robot gearbox does not fail suddenly. It fails over millions of cycles — each one depositing microscopic wear debris into the lubricant, each one slightly increasing backlash at the output, each one adding fractional torque ripple to the servo drive's current draw. By the time the gearbox seizes and production stops, the failure has been in progress for weeks or months, leaving a clear signal trail in torque feedback data, servo current waveforms, and vibration spectra that no human was monitoring. iFactory's robot predictive maintenance module captures these signals continuously, applies AI models trained on gearbox wear progression patterns, and generates failure probability scores weeks before mechanical failure — giving reliability engineers the window they need to schedule replacement on a planned shutdown rather than an emergency callout.
Predictive Maintenance · Robot Reliability · AI Gearbox Monitoring
Welding Robot Gearbox Failure Prediction: The Signal Is There — Weeks Before the Seizure
AI on torque, current, and vibration data detects the wear progression signatures that precede gearbox failure by 3–8 weeks — giving automotive body shop reliability teams planned replacement windows instead of emergency production stops.
Gearbox Failure Impact — Automotive Body Shop
6–18 hrs
Average unplanned downtime per welding robot gearbox seizure including parts sourcing and recommissioning
$8K–25K
Cost per unplanned gearbox failure: parts, emergency labor, and production loss at $2,000–$4,500/hr body shop rate
3–8 wks
Typical AI detection lead time before gearbox seizure when torque ripple and vibration monitoring is active
Failure Physics
How Welding Robot Gearboxes Actually Fail: The Mechanical Progression
Understanding gearbox failure prediction requires understanding gearbox failure mechanics. Most welding robot joints use cycloidal or harmonic drive reducers — not conventional spur or helical gear sets. These reducer types have specific wear mechanisms and failure signatures that differ substantially from industrial gearbox failure modes covered in general vibration analysis literature. A reliability engineer who applies automotive gearbox diagnostics to a FANUC RV reducer or a Nabtesco cycloidal drive will miss the relevant signals entirely.
Wear Mechanism
The flexspline — a thin-walled, elliptically deformed steel cup — flexes against the circular spline at two points per revolution. Each flex cycle introduces micro-fatigue into the flexspline material. At high cycle counts (typically 10,000–30,000 operating hours depending on load profile), the flexspline develops micro-cracks that propagate to through-cracks, causing loss of tooth mesh and rapid backlash increase.
Detectable Wear Stages
Stage 1
Lubricant degradation — grease darkening, viscosity change. Detectable: oil analysis. Lead time: 6–18 months before failure.
Stage 2
Micro-crack initiation — flexspline tooth surface pitting. Detectable: high-frequency vibration (ultrasound, 20–100 kHz). Lead time: 2–6 months.
Stage 3
Backlash increase — position error growth at axis reversal. Detectable: servo torque ripple analysis, position encoder deviation. Lead time: 3–8 weeks.
Stage 4
Crack propagation — rapid backlash increase, torque spike events, position repeatability loss. Detectable: servo current anomaly detection. Lead time: days to 2 weeks.
Wear Mechanism
RV reducers use two-stage reduction: a first-stage spur gear set and a second-stage eccentric cycloidal disc engaging roller pins. Wear initiates on the roller pins and cycloidal disc contact surfaces — both are Hertzian contact interfaces under high load. Wear debris from pin/disc contact circulates in the lubricant and acts as an abrasive, accelerating wear at all other contact points. The failure mode is progressive seizure rather than sudden fracture.
Detectable Wear Stages
Stage 1
Roller pin surface fatigue — subsurface crack initiation. Detectable: oil debris analysis (ferrous particle count). Lead time: 6–24 months before failure.
Stage 2
Pin spalling onset — vibration signature at roller pass frequency. Detectable: envelope analysis at pin mesh frequency. Lead time: 1–4 months.
Stage 3
Increased friction — servo drive current draw elevation during specific motion segments. Detectable: motor current signature analysis (MCSA). Lead time: 3–8 weeks.
Stage 4
Lubricant contamination cascade — rapid wear acceleration. Detectable: torque command vs. position error divergence. Lead time: days to 1 week.
Sensor Signal Signatures
The Four Data Streams That Reveal Gearbox Condition
A robot gearbox in a body shop environment generates four data streams that, when analyzed with AI models trained on wear progression patterns, provide a multi-layer detection system with overlapping lead times. The practical advantage of using multiple streams is redundancy: if a single signal is obscured by process variation on a given production day, the remaining streams continue to provide condition information. iFactory's monitoring architecture reads all four streams simultaneously from each robot axis without requiring any modification to the robot controller.
The servo drive's torque command is the most accessible and most information-rich gearbox health signal available without additional hardware. Modern robot controllers (FANUC, KUKA, ABB, Yaskawa) output torque command data at 1–8 ms sample rates via the controller's monitoring interface. In a healthy gearbox, torque command traces a smooth, predictable waveform during each taught program move. As gearbox wear progresses, torque ripple increases — periodic torque fluctuations at frequencies corresponding to the gearbox's tooth mesh frequency and its harmonics become detectable above the baseline noise floor.
What changes: Torque ripple amplitude at gear mesh frequency; peak torque elevation on axis reversal; torque spike events during specific program segments
AI model input: Torque waveform FFT features, RMS torque deviation from healthy baseline, peak-to-average torque ratio per move segment
Access method: Robot controller monitoring port (no additional hardware required on most modern controllers)
Motor current signature analysis captures gearbox wear information through the servo motor's phase current waveform. As gearbox friction increases due to wear, the motor must draw more current to maintain commanded velocity and position. The current signature carries frequency components that correspond to the gearbox's internal geometry — pin mesh frequency for RV reducers, flexspline tooth frequency for harmonic drives. These components are present in healthy gearboxes at low amplitude; wear causes their amplitude to rise measurably above the baseline established during initial commissioning.
What changes: Current draw elevation during constant-velocity move segments; sideband amplitude growth around gear mesh frequency components
AI model input: Current spectrum FFT at mesh frequencies, current RMS trend, sideband ratio vs. carrier amplitude
Access method: Drive current output from servo amplifier monitoring port; or clamp-on current transducer on motor phase leads
Accelerometer-based vibration monitoring on robot joints provides the earliest detectable wear signatures — particularly for Stage 2 wear (spalling onset on RV reducer roller pins, flexspline micro-crack initiation on harmonic drives). High-frequency envelope analysis (HFEA) in the 5–40 kHz range detects the impulsive energy events associated with rolling contact fatigue before they produce measurable changes in torque or current. A tri-axial MEMS accelerometer mounted on the gearbox housing provides the highest diagnostic value. The primary implementation challenge is that robot motion itself generates vibration — AI models must separate gearbox-related vibration from motion-induced vibration, which requires the model to be position- and velocity-aware during analysis.
What changes: Kurtosis value increase (impulsive events); crest factor elevation; envelope spectrum sidebands at bearing/pin pass frequencies
AI model input: Kurtosis, crest factor, RMS vibration trend, envelope spectrum features at gear mesh harmonics
Access method: Tri-axial MEMS accelerometer on gearbox housing; data acquisition via edge device connected to iFactory platform
The robot controller's position control loop continuously computes the error between commanded position and actual encoder position. As gearbox backlash increases due to wear, the position error at axis reversal — the moment when joint direction changes in the taught program — increases measurably. This signal is available directly from the robot controller without any additional hardware. The key analytical requirement is that position error must be evaluated at the same program point across repeated cycles to isolate gearbox-related backlash growth from normal position variation due to load and thermal effects.
What changes: Peak position error at axis reversal points; position error growth trend over thousands of cycles; repeatability standard deviation increase
AI model input: Position error at programmed reversal points, backlash measurement trend, position repeatability std dev over 100-cycle rolling window
Access method: Robot controller monitoring interface (no additional hardware); position data logged per cycle
AI Detection Methodology
How the AI Model Generates Failure Probability Scores
Detecting gearbox wear from servo data is a pattern recognition problem, not a threshold problem. A fixed threshold on torque RMS — "alarm if torque ripple exceeds X%" — fails in production environments because torque varies with payload, program path, and operating temperature. An AI model that learns the expected signal envelope for each robot, each axis, each program segment, and each thermal condition can detect a 3% deviation from that expected envelope as anomalous — while a threshold-based system would require a 15–25% deviation before triggering a false-alarm-free alert.
01
Baseline Commissioning — Learning "Healthy"
iFactory collects torque, current, position error, and vibration data from each robot axis during the first 14–21 days of monitoring while the gearbox is in a known-good condition. This baseline period captures normal variation across all payload conditions, program paths, ambient temperature ranges, and production cycle types. The baseline model learns the expected signal envelope for each axis at each program point — not a single threshold but a multi-dimensional expected behavior surface.
Data volume: approximately 2–5 million data points per axis over 21 days at 1-second sampling on four signal channels.
02
Anomaly Scoring — Detecting Deviation from Baseline
During production monitoring, the AI model computes an anomaly score for each axis every production cycle by comparing the current signal envelope against the baseline model. The anomaly score accounts for expected variation due to payload, temperature, and program path — so that a heavier weld fixture or a warmer gearbox does not trigger false alarms. Only deviation that cannot be explained by known process variables contributes to the anomaly score. Score trending over 30–90 day windows reveals the wear progression pattern.
Alert thresholds: Advisory (score trending upward over 14 days), Warning (score above 2-sigma baseline), Critical (score above 3-sigma or multi-signal convergence event).
03
Multi-Signal Fusion — Convergence Confirmation
A failure probability score is generated by fusing anomaly indicators across all four signal channels — torque ripple, current signature, vibration envelope, and position error trend. When two or more independent signals show concurrent anomaly score elevation on the same axis, failure probability increases non-linearly. This multi-signal convergence approach reduces false positive rates below 3% while maintaining 94%+ true positive detection rates in documented automotive body shop deployments, compared to 35–60% false positive rates on single-channel threshold systems.
Output: Per-axis failure probability score (0–100%) updated every production shift, with 30-day and 90-day trend lines and confidence interval.
04
Remaining Useful Life Projection
Once a failure probability score crosses the Warning threshold, the model fits the observed wear progression curve to historical failure datasets to project remaining useful life (RUL). The RUL projection is expressed as a range — "3–7 weeks at current wear progression rate" — with the uncertainty range narrowing as more data accumulates and the wear curve shape becomes clearer. This projection window is the maintenance planning input: the reliability team knows when to schedule the gearbox replacement, how long the current gearbox can safely continue operating, and when to expedite parts procurement if the RUL narrows unexpectedly.
Typical RUL range accuracy: ±30% at Warning stage, ±15% at Critical stage, based on validation against documented FANUC and KUKA gearbox failure events.
See Gearbox Health Scores for Every Robot Axis in Your Body Shop
iFactory connects to your robot controllers via the monitoring interface — no hardware changes to the robot, no interruption to production — and begins generating per-axis gearbox health scores within 21 days of baseline collection.
Implementation Blueprint
Deploying AI Gearbox Monitoring on a Welding Robot Fleet: What It Actually Takes
Most Robot Reliability Leads overestimate the implementation complexity of gearbox monitoring and underestimate the speed of value delivery. The principal implementation question is not "can we connect to the robots" — modern FANUC, KUKA, ABB, and Yaskawa controllers all provide monitoring data access via standard interfaces. The question is "how do we establish a valid baseline quickly enough that anomaly detection is meaningful." The following blueprint addresses both.
| Implementation Step |
Duration |
Robot OEM |
Technical Method |
iFactory Action |
| Robot controller connection |
1–2 days/cell |
FANUC, KUKA, ABB, Yaskawa |
Ethernet monitoring port; OPC-UA or proprietary SDK; no robot program modification |
Automated connection via iFactory edge gateway |
| Axis data stream configuration |
0.5 days/robot |
All major OEMs |
Configure torque, current, position error data streams per axis at required sample rate |
Template-based config per OEM model |
| Accelerometer installation (optional) |
1–2 hrs/joint |
All major OEMs |
Tri-axial MEMS accelerometer on gearbox housing; magnetic or adhesive mount; cable to edge device |
Sensor spec provided; plant team installs |
| Baseline data collection |
14–21 days |
All major OEMs |
Continuous monitoring during normal production; baseline model builds automatically |
Automated baseline training — no analyst required |
| Anomaly model activation |
Day 22 |
All major OEMs |
Anomaly scoring enabled; per-axis health scores begin generating per production shift |
Dashboard live; alert routing configured |
| Alert routing and escalation |
1 day |
N/A |
Advisory / Warning / Critical alerts routed to reliability lead, maintenance planner, and shift supervisor |
Email, SMS, CMMS integration available |
| First RUL projections available |
Day 30–45 |
All major OEMs |
Any axis with Warning-level anomaly score generates RUL projection range |
Maintenance planning window generated |
Financial Case
ROI Model: Gearbox Prediction vs. Reactive Replacement
The financial case for robot gearbox prediction is built on a single comparison: the cost of an unplanned gearbox failure versus the cost of a planned gearbox replacement on a scheduled shutdown. The labor cost, parts cost, and production loss profile are dramatically different between these two scenarios — and the difference compounds across a fleet of 40–120 welding robots in a typical body shop.
Production downtime
6–18 hours
Production loss at $3,000/hr
$18,000–$54,000
Emergency labor (overtime + contractor)
$3,500–$8,000
Gearbox parts (expedited sourcing)
$4,000–$12,000
Recommissioning and weld qualification
$1,500–$3,500
Secondary damage risk (weld fixture, tooling)
$0–$15,000
Total per event
$27,000–$92,500
VS
Scheduled shutdown window used
Weekend / planned stop
Production loss
$0 (planned downtime)
Standard labor (regular rate)
$800–$1,800
Gearbox parts (planned procurement)
$3,200–$8,500
Recommissioning in planned window
$800–$1,500
Secondary damage risk
$0 (controlled replacement)
Total per event
$4,800–$11,800
Saving per avoided unplanned failure
$22,200–$80,700
Fleet of 60 robots — 8 gearbox events/year (industry average)
$177K–$645K annual exposure
iFactory robot PdM — annual platform cost for 60-robot fleet
Typical payback: 3–5 months
"
The thing that changed how I think about robot gearbox maintenance was the first time we caught a KUKA KR 210 J2 gearbox — a big RV reducer on a heavy transfer robot — trending toward failure six weeks out. We had a torque ripple anomaly score that had been climbing for ten days, a current signature that showed elevated sideband energy at the pin mesh frequency, and a position error that was growing at axis reversal. Any one of those individually I might have dismissed as process variation. All three trending together on the same axis over the same ten-day window was unambiguous. We pulled the robot at the next scheduled weekend stop, found significant roller pin spalling at the primary reduction stage, replaced the reducer assembly, and went back into production Monday morning. The alternative — waiting for it to seize — would have been a Tuesday afternoon production stop on a $140,000-per-hour line. That one event paid for the monitoring system for three years. What I tell other reliability leads is this: the signal is always there. The gearbox is always telling you something. You just have to be listening to the right frequencies with the right model to interpret what it means.
Rodrigo Vasconcelos, CRL, CMRP
Robot Reliability Lead · Certified Reliability Leader · Certified Maintenance and Reliability Professional · 14 years in automotive body shop robot maintenance · 400+ robot fleet experience across stamping and body-in-white operations
Frequently Asked Questions
How does iFactory access torque and current data from FANUC, KUKA, ABB, and Yaskawa robots?
Each major robot OEM provides a dedicated monitoring interface that outputs axis-level data without any modification to the robot program or control architecture. FANUC robots provide torque, current, position error, and encoder data through the FANUC Data Server and FOCAS2 library via Ethernet connection to the robot's PC-based controller — no teach pendant interaction required. KUKA robots expose axis data via the KUKA System Software OPC-UA server or the KUKA Robot Sensor Interface (RSI) in monitoring mode. ABB robots provide axis data through the ABB Robot Web Services API or OPC-UA server available on IRC5 and OmniCore controllers. Yaskawa Motoman robots output axis data via the MotoPlus API or Ethernet/IP monitoring. iFactory's edge gateway establishes all connections automatically using pre-configured OEM adapter profiles — connection setup for a standard robot cell takes one to two hours. No robot OEM warranty conditions are triggered because no modification is made to any robot system — monitoring interfaces are a documented access method supported by all major OEMs. Book a technical session to confirm connectivity for your specific robot controller versions.
How do you distinguish gearbox wear signals from normal production variation in torque data?
This is the core technical challenge that separates AI-based gearbox monitoring from simple threshold alarming, and it is where the baseline commissioning period earns its value. During the 14–21 day baseline period, iFactory's model learns the expected torque envelope for each axis at each segment of the robot's taught program — accounting for payload variation (different fixture weights, different weld gun pressures), temperature variation (gearbox friction changes measurably with temperature across a 20–30°C operating range), and program-path variation (different segments of the weld program stress different axes differently). The anomaly model then evaluates production data against this multi-dimensional expected envelope rather than against a fixed threshold. A 5% torque increase during a heavy-payload fixture cycle that the model expects to see does not trigger an alert. A 5% torque increase on a known-good payload cycle that has been consistent for 90 days does trigger an advisory score increase. Contact iFactory support for technical documentation on the anomaly scoring methodology.
Which robot axes are most prone to gearbox failure in a welding body shop?
In automotive body shop welding applications, failure rates are not uniform across axes — they concentrate on the axes that carry the highest combined load and cycle count. Axis J1 (base rotation) and J2 (lower arm) on high-payload robots (FANUC M-710, KUKA KR 210, ABB IRB 6700 and larger) experience the highest gearbox loading due to the moment arm created by the robot's full reach. These joints use large-format RV reducers and typically see the highest failure rates in body shop environments. On medium-payload welding robots (FANUC M-20, KUKA KR 120, ABB IRB 2600), J4 and J5 wrist axes accumulate the highest cycle counts because the wrist articulates on every weld point, while the base and shoulder axes move less frequently between weld stations. J6 (tool flange) harmonic drives on all payload classes are frequently high-cycle due to torch positioning movements at each weld. iFactory's monitoring architecture applies priority monitoring with higher sampling frequency to the axes that statistical failure history identifies as highest-risk for each robot model in your fleet. Book a demo to see the per-axis risk profile dashboard for your specific robot models.
What is the difference between calendar-based gearbox PM and condition-based replacement using AI?
OEM-recommended calendar-based PM intervals for robot gearboxes — FANUC's 3,850-hour grease replenishment interval, KUKA's 10,000-hour full PM — are designed to protect against failure across the full distribution of operating conditions, payload profiles, and environmental factors that any robot in any application might experience. For a robot running light payloads in a clean environment at moderate cycle rates, the OEM interval is extremely conservative and results in significant over-maintenance cost. For a robot running near its payload limit in a high-temperature environment at maximum cycle rate, the OEM interval may be insufficient. Condition-based replacement using AI gearbox monitoring replaces the calendar with the actual measured wear state of each specific gearbox — gearboxes that are wearing normally continue operating until their wear state indicates replacement is warranted; gearboxes wearing faster than average are flagged for earlier replacement before failure. A body shop with 60 robots typically finds that 70–80% of gearboxes can safely extend beyond OEM calendar intervals, and 10–15% need earlier replacement than the calendar would indicate. The net effect is lower total maintenance cost and near-zero unplanned failures simultaneously. Contact iFactory support to model your fleet's condition-based PM savings versus your current calendar-based spend.
How many gearbox failures need to be prevented to justify the AI monitoring investment?
Based on the ROI model above, the minimum number of prevented unplanned failures needed to justify iFactory robot PdM on a 60-robot body shop fleet is typically one to two per year — often well below the historical failure rate at most plants that have been running on calendar-based maintenance without condition monitoring. Most automotive body shops with 40–100 welding robots experience four to twelve gearbox-related unplanned production stops per year, with the higher end of that range concentrated in plants where some robots are running aging gearboxes beyond their useful life without awareness. The economic breakeven is straightforward: one prevented unplanned failure at the midpoint of the cost range ($35,000–$45,000 per event) typically covers the annual platform cost for a robot fleet of 40–80 units. Every additional prevented failure is direct return on investment. The secondary value — grease and lubricant cost reduction from eliminating unnecessary calendar-based PM on gearboxes that are in good condition — adds a further 15–25% to the documented ROI at most plants. Book a session and we will build the specific breakeven model for your fleet size and historical failure rate.
Robot Gearbox Predictive Maintenance
Your Next Gearbox Seizure Has Already Started. The Signal Is in Your Servo Data.
iFactory connects to your FANUC, KUKA, ABB, and Yaskawa robots via the controller monitoring interface — no hardware changes, no production interruption — and begins generating per-axis gearbox health scores within 21 days. The first failure you prevent pays for the system many times over.