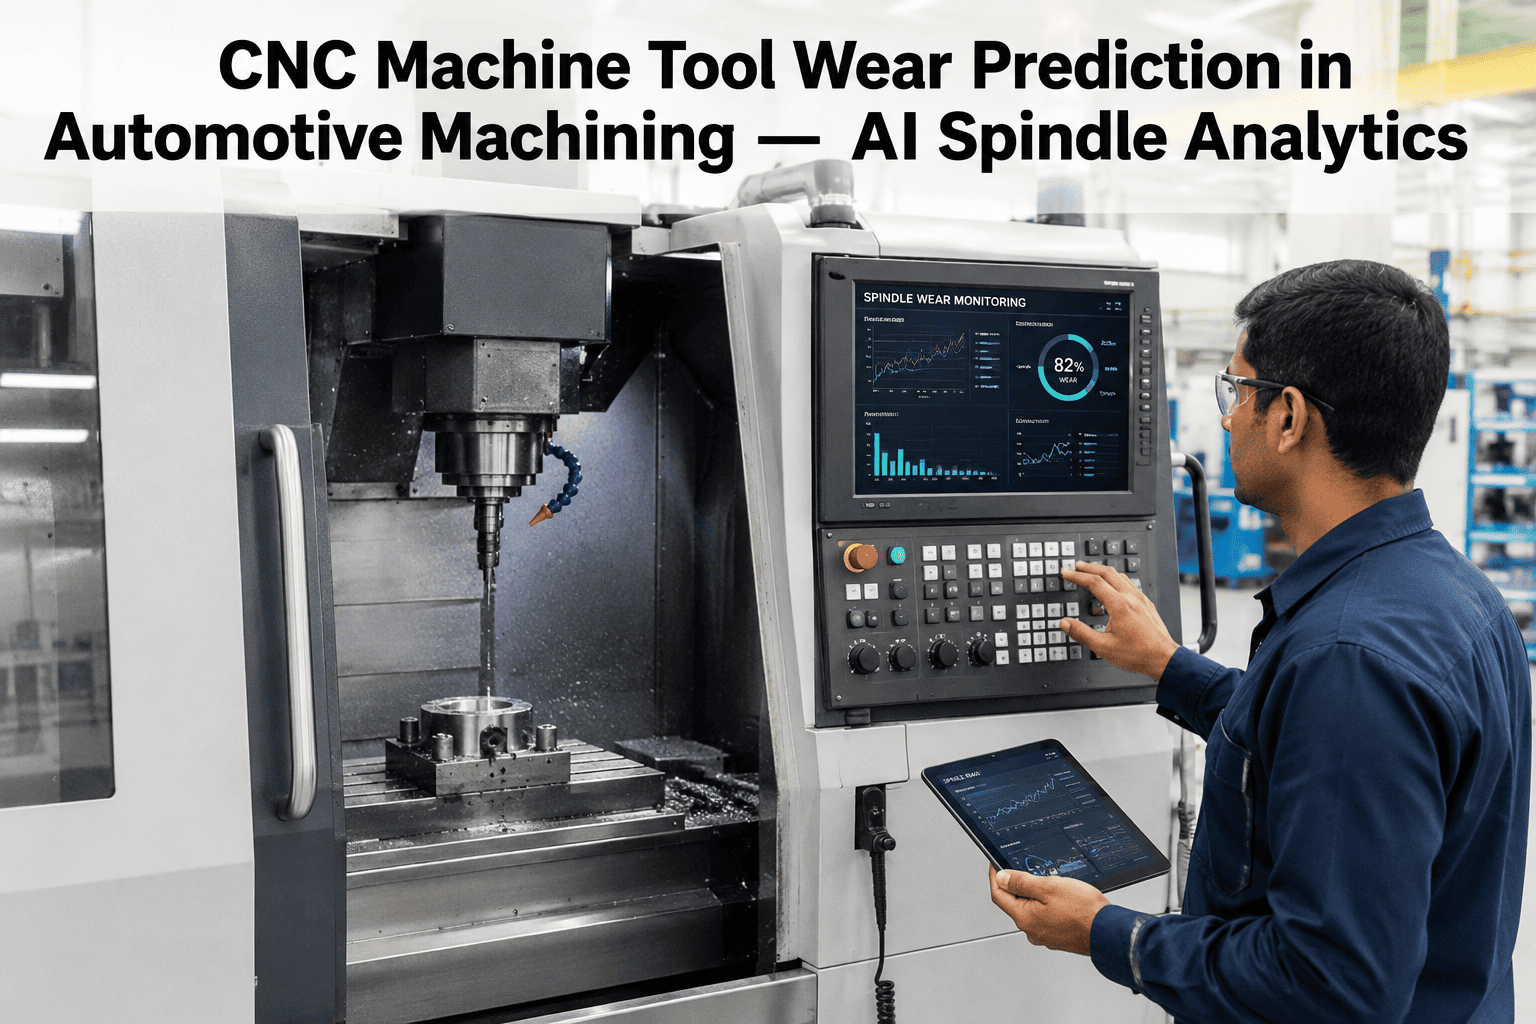
A cutting tool never fails all at once. It edges from sharp to dull over hundreds of cuts, and by the time an operator hears the whine or sees a burr on the part, the tolerance is already gone and the spindle bearings have often taken damage too. Aerospace shops, medical component makers, and high-mix job shops all lean on the same fragile habit: a fixed tool-change interval set by memory rather than by what the cut is actually telling them. Spindle speeds from 5,000 to 30,000 RPM, cutting loads that shift with every batch of material, coolant contamination, and thermal drift during long cycles all move tool life around far more than a calendar can track. AI models trained on spindle power, vibration, and acoustic signals read the cut itself, catching the shift from healthy tool to failing tool long before a person would notice, and iFactory's predictive maintenance platform puts that reading on your shop floor in real time.
AI Spindle and Tool Wear Monitoring for CNC Machines
Why a Calendar Can't Tell You When a Tool Is Dying
Time-based and part-count tool changes exist because they are simple to schedule, not because they match how wear actually happens. The same insert can last two hundred parts longer in a soft batch of aluminum than it does in a hard, inconsistent casting, and the same spindle bearing can run flawlessly for a year of light finishing passes and then degrade in weeks under heavy roughing. Coolant contamination accelerates bearing wear quietly, thermal drift changes tolerances during a single long cycle, and vibration excursions during aggressive cuts stress components that a fixed schedule never accounts for. The result of relying on the calendar instead of the cut is a machine shop that is constantly either changing tools too early and wasting good tool life, or too late and living with scrap, surface finish rejects, and the occasional spindle crash that costs far more than any tool ever would.
The Three Stages of Tool Wear — and Where AI Steps In
Cutting tool wear follows a well-documented curve, the same one that underlies tool-life testing standards like ISO 3685 for single-point turning tools. A fresh edge goes through rapid initial wear as it seats into the cut, settles into a long, gradual, largely predictable steady-state wear region, and then tips into an accelerated wear zone where flank wear, edge chipping, and thermal softening compound quickly toward catastrophic failure. The danger is that steady-state wear looks calm right up until it doesn't — the transition into accelerated wear can happen within a handful of parts. A monitoring model that has learned what steady-state looks like for a specific tool, material, and feed rate can flag the exact moment the curve bends upward, well inside the steady-state region and long before the accelerated zone begins.
Five Signals, One Picture of Tool and Spindle Health
No single sensor tells the whole story of a cut. Spindle power moves with cutting resistance, vibration reveals bearing condition and chatter, acoustic emission catches micro-scale events no accelerometer can, current signature tracks motor load without adding a single extra sensor, and thermal data shows the slow drift that precedes both tool failure and bearing seizure. iFactory's models fuse all five so a spike in one signal that looks ambiguous alone becomes a clear, high-confidence flag when it lines up with a matching shift in two or three others.
Curious what these five signals actually look like on your own spindle? Book a 30-minute walkthrough and we'll run the model against real data from your machine.
From Raw Signal to Shop-Floor Decision
Collecting five signals is only useful if it turns into something an operator or a maintenance planner can act on in seconds, not a stream of numbers nobody reads. The pipeline is built as a continuous loop: sense the signals, fuse them into a single model, compare that fused reading against the machine's own learned baseline, score the result with a simple status, and act on it before the part is scrapped or the bearing is damaged. The loop repeats on every cut, so the picture of tool and spindle health stays current instead of going stale between scheduled checks.
What Changes When You Stop Guessing
The honest comparison is between what each detection method actually catches and how much warning it realistically gives before something breaks. Manual inspection and fixed schedules aren't worthless, but they were never designed to catch a bearing that is degrading quietly under a smooth-sounding cut, or a tool edge that is chipping at a scale no eye can see on a moving spindle. The table below lays out where each approach sits, so the case for fusing signals together is visible in the lead time column, not just in the marketing copy around it.
| Detection Method | What It Catches | Typical Lead Time | Key Limitation |
|---|---|---|---|
| Fixed interval tool change | Nothing specific — it's a schedule, not a detector | 0 (reactive by design) | Scraps good tools early, misses tools that fail sooner than expected |
| Manual operator inspection | Visible chipping, obvious wear, gross bearing noise | Minutes before failure | Intermittent, subjective, and unsafe to perform near a running spindle |
| Vibration-only monitoring | Bearing imbalance, misalignment, some chatter | Hours | Misses acoustic and thermal precursors that show up earlier |
| Acoustic emission sensing | Micro-cracking, early lubrication faults | Minutes to hours | High-frequency data needs specialized processing to be useful |
| AI multi-signal fusion | Tool wear, bearing wear, chatter onset, holder wear | Up to 72 hours | Needs a short baseline period on each machine before it's fully tuned |
The Numbers Behind the Shift
A CNC spindle failure routinely costs between fifteen and fifty thousand dollars in repairs alone before production losses are even counted, which is why shops that adopt fused, multi-signal monitoring tend to report the same handful of outcomes regardless of industry: fewer surprise breakdowns, longer bearing life, and maintenance that happens on a planned Tuesday afternoon instead of in the middle of a Friday production run.
Built on Standards, Not Guesswork
Predictive tool and spindle monitoring works because it borrows its logic from established test and measurement standards instead of inventing thresholds from scratch. ISO 3685 defines how tool-life testing with single-point turning tools is structured and how wear criteria are measured, which is the same wear-curve logic the monitoring models are trained against. ISO 20816 sets out how vibration on rotating machinery like a spindle should be measured and evaluated across its operating speed range, giving the vibration signal a grounded severity scale rather than an arbitrary one. Building on recognized measurement practice, rather than a black-box threshold nobody can explain, is also what makes the alerts defensible when a maintenance planner has to justify pulling a machine out of production.
Want to see how these standards translate into the alerts your team would actually receive? Talk to our reliability engineers about your spindle fleet.