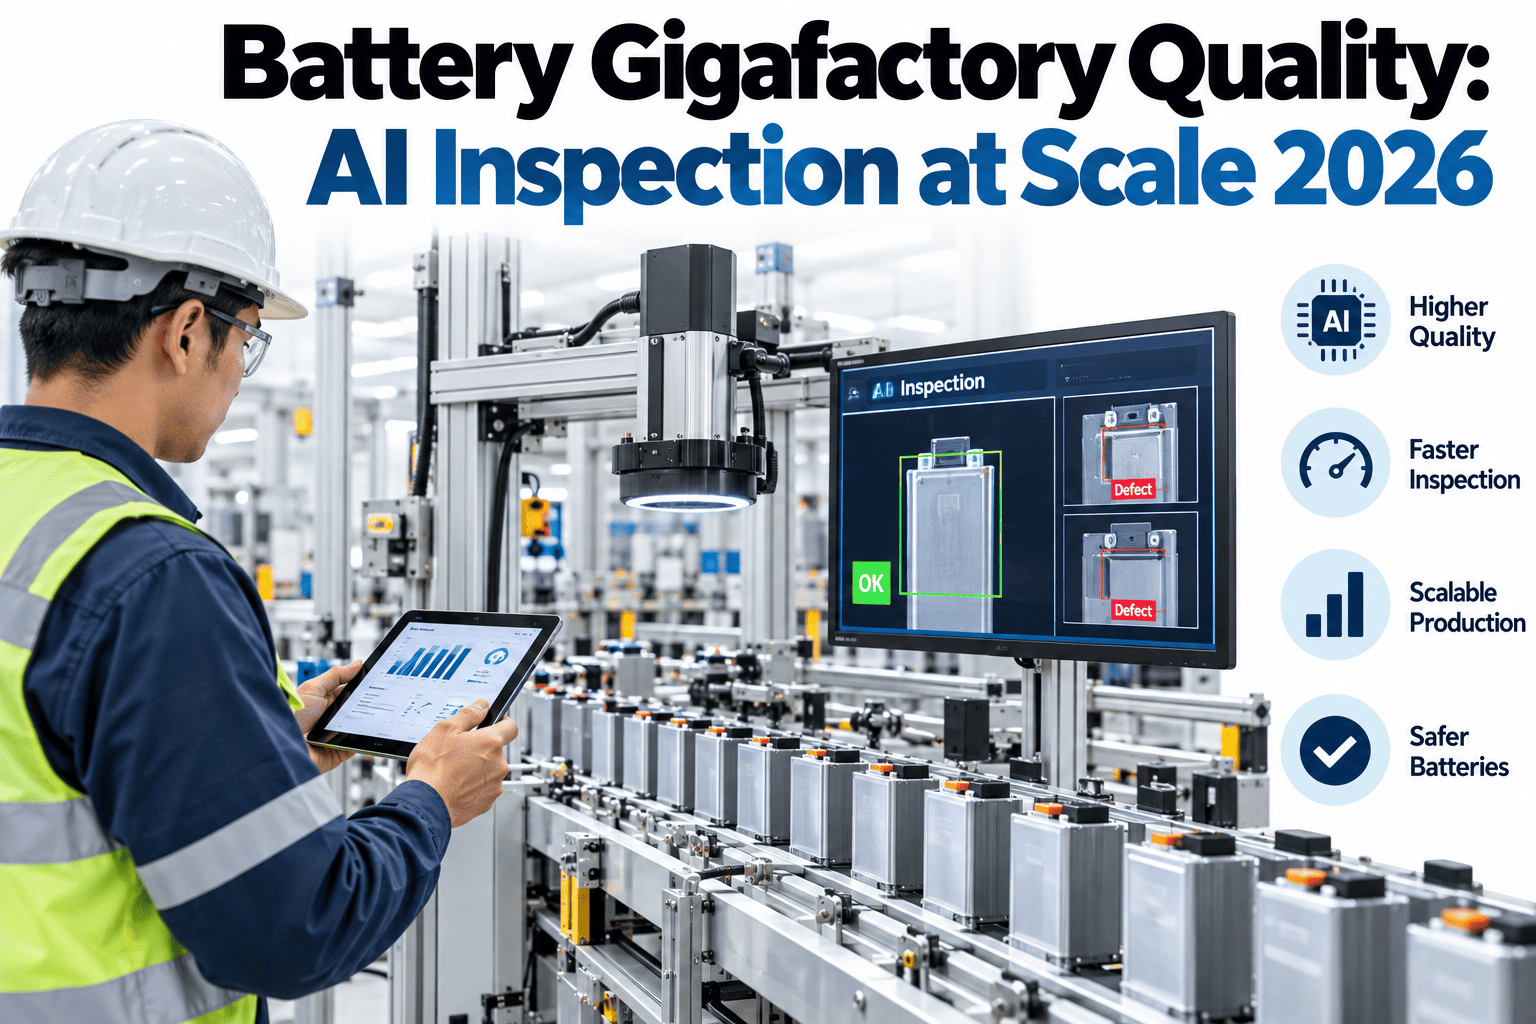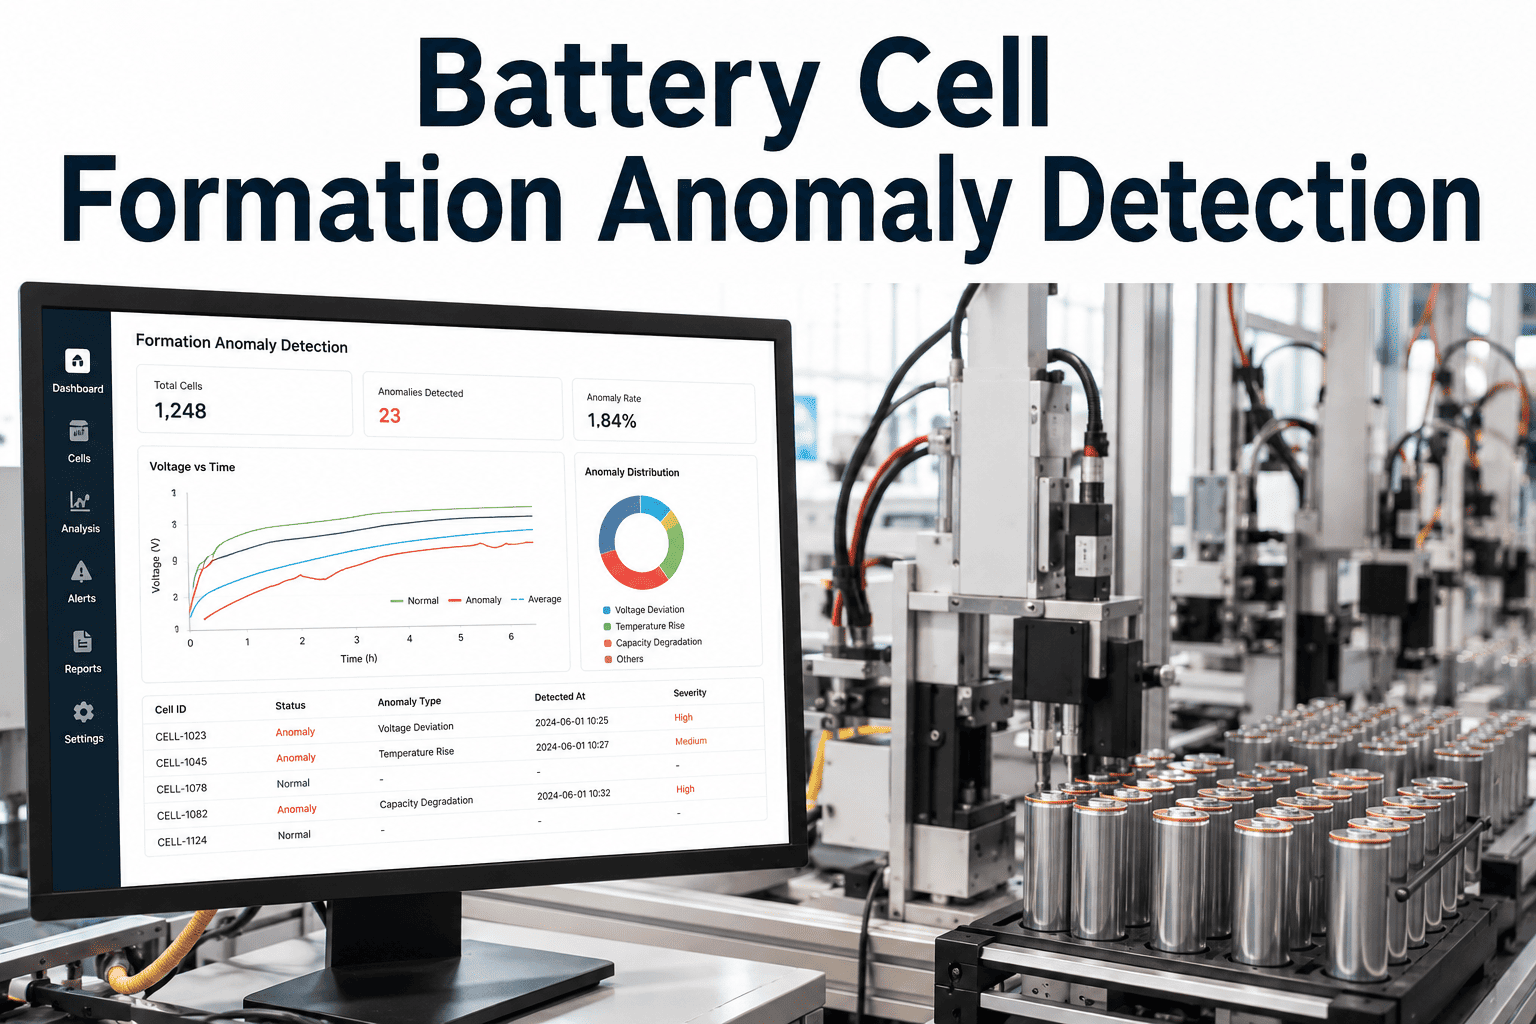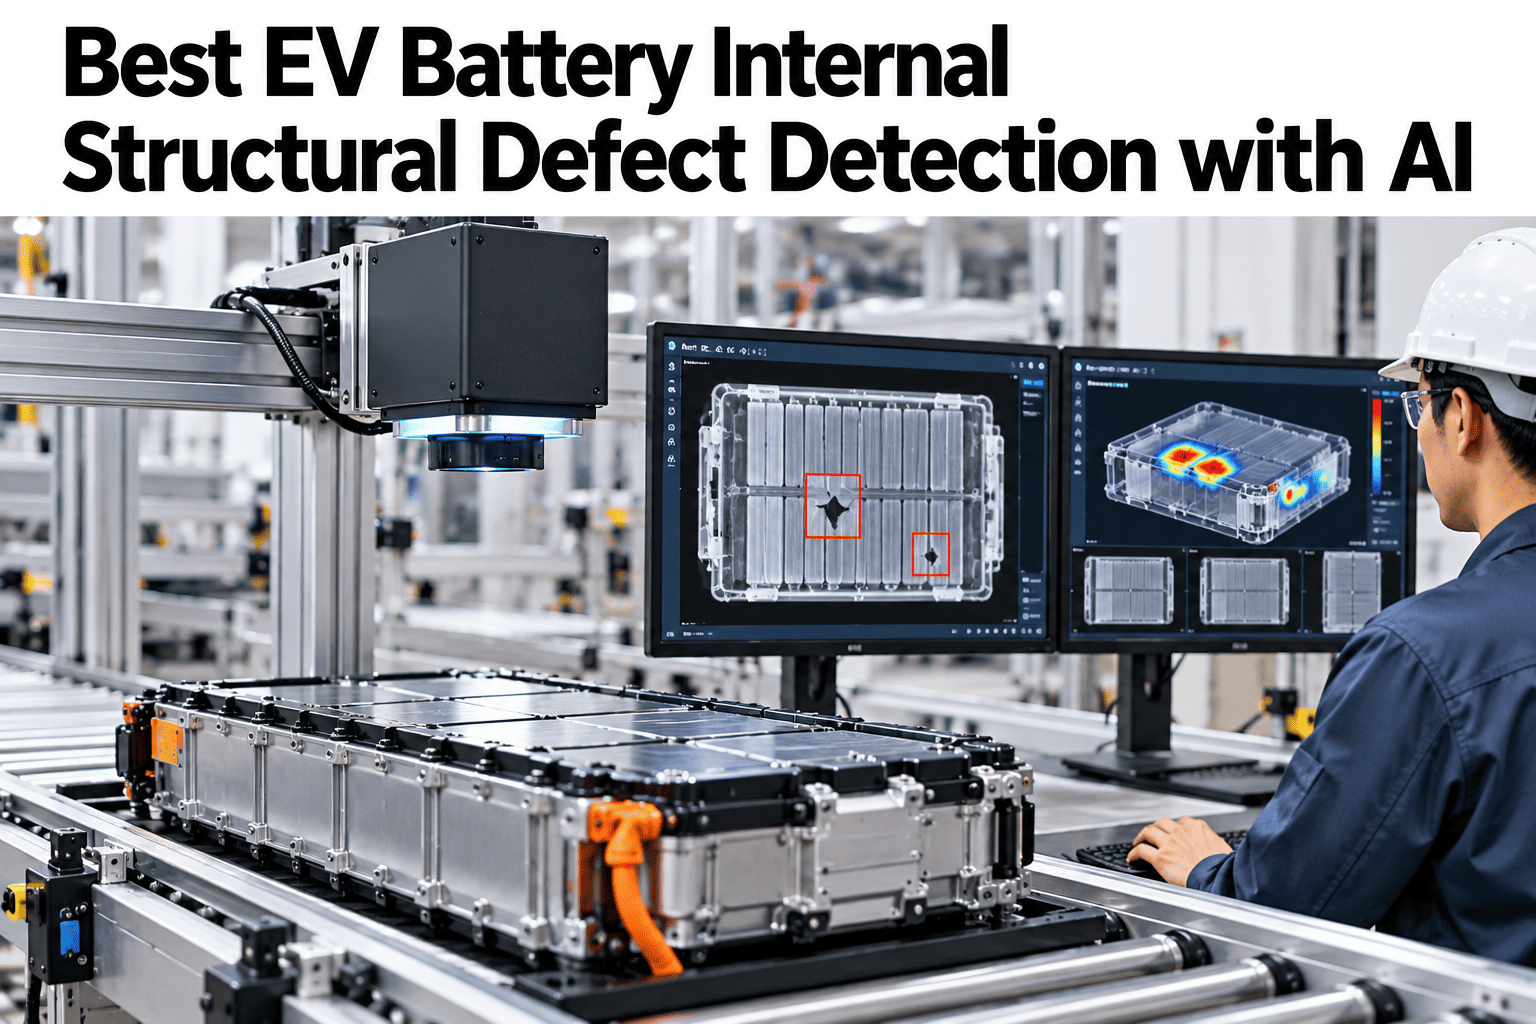
A battery cell can look flawless from the outside and still carry a structural flaw sealed invisibly inside it, a fold in the jelly roll, a misaligned electrode stack, or a void between layers that will not show up on any visual inspection. These defects do not announce themselves at the factory. They surface weeks or months later as capacity fade, swelling, or in the worst case, thermal events in the field. Gigafactories that want to see inside every cell before it ships can walk through an internal defect detection review on real production data.
See Inside Every Cell, Not Just the Outside of It
iFactory AI combines X-ray CT, ultrasonic imaging, and delamination classification to catch internal structural defects that no surface inspection can see.
Four Defects You Cannot See From Outside
Internal structural defects share one trait: they are invisible to a camera and often invisible to a basic dimensional check. Each requires imaging that can see through the cell casing.
Electrode misalignment
Anode and cathode layers shifted relative to each other, raising lithium plating risk at the exposed edge.
Jelly roll folding
Wrinkles or folds introduced during winding that create uneven pressure and local stress points.
Delamination
Separation between coating and current collector, or between layers, that reduces usable capacity and creates voids.
Internal voids
Gas pockets or unfilled regions, often electrolyte wetting issues, that reduce active surface area.
What makes these four defects especially difficult is that they often originate from upstream process steps that look completely normal on their own station's metrics. A winding machine running within its speed and tension tolerances can still introduce a fold if the electrode stiffness changes slightly between coils, and nothing on the winder's own dashboard would flag that as an anomaly.
Cylindrical, pouch, and prismatic formats each carry a different dominant risk among the four. Cylindrical cells are more prone to winding-related misalignment given the continuous spiral geometry, pouch cells are more sensitive to delamination because of their flexible casing and layered stacking, and prismatic cells often show void-related risk concentrated near fill ports. A detection program built around one format's typical failure pattern can under-detect the dominant risk of another format running on the same line.
Severity also matters as much as defect type when deciding what to do with a flagged cell. A minor, localised void well away from the tab connections may pose negligible practical risk, while the same void type positioned near a current collector weld can meaningfully change the failure probability. Treating every flagged defect as equally serious either wastes good cells through over-rejection or, worse, treats a genuinely risky defect the same as a cosmetic one. A severity scale tied to defect location, size, and type gives quality teams a consistent basis for disposition decisions instead of relying on an individual reviewer's judgment call each time.
Where Structural Defects Originate
A composite root-cause breakdown across several cell lines, grouped by the process step where the defect was most likely introduced. Bar length shows an illustrative share of flagged structural defects traced to that step.
Winding and stacking account for the largest share because these steps physically shape the jelly roll or stack, and any misalignment introduced there is extremely difficult to correct later in the process. This is also why winding is usually the first station a structural inspection program targets.
Calendering's contribution is often underestimated because its effects do not appear until later. Uneven roll pressure changes electrode density locally, and that density variation can translate into uneven expansion during cycling, eventually contributing to delamination far downstream of the calendering step itself. Tracing a delamination event back to a calendering roll that was due for maintenance weeks earlier is a common pattern once the data is connected.
Electrolyte fill and wetting issues tend to cluster by cell design rather than by shift or operator, since fill port geometry and electrode porosity are design-level variables. This is one of the few structural risk categories where a manufacturing team's corrective options are partly limited to process parameters like vacuum profile and fill volume, with the underlying design itself sitting outside their direct control.
See Where Your Structural Defects Originate
Book a 30-minute session and iFactory AI will map internal defect trends against your winding, calendering, and fill process data.
Comparing Imaging Technologies
No single imaging method covers every structural defect type at gigafactory speed. Most programs combine two or more technologies based on what each one sees best.
| Technology | Best For | Typical Limitation |
|---|---|---|
| X-ray CT scanning | Electrode alignment, folding, foreign objects | Slower throughput, often used on sampled cells |
| 2D X-ray line scan | Alignment and gross structural defects at line speed | Lower resolution than full CT for fine delamination |
| Ultrasonic imaging | Delamination and void detection | Requires good coupling and is sensitive to cell geometry |
| Acoustic emission sensing | Detecting active defect formation during formation cycling | Identifies that something is happening more than exactly where |
Why Sampling Alone Leaves Risk on the Table
Full CT scanning every cell is often impractical at gigafactory volumes, which pushes many programs toward statistical sampling. Sampling catches systemic issues but can miss isolated ones. Lines weighing this trade-off can review a sampling versus full-coverage comparison for their own volumes.
The economics of tiered scanning usually favour it once throughput is modelled properly. Full CT on every cell at gigafactory line speeds would require either an impractical number of CT systems or a line speed reduction that costs far more than the scanning equipment itself. Fast 2D screening, by contrast, can typically run at or near line speed, reserving the slower full CT step for the small percentage of cells that actually need it.
The isolated-defect risk that sampling misses is not evenly distributed either. It tends to concentrate around transition events, a tooling change, a material lot change, a shift handover, rather than appearing randomly across production. A tiered system that screens continuously is far better positioned to catch a defect clustered around one of these transitions than a fixed sampling interval that may land its samples well away from the window where the issue actually occurred.
Building a Case for Internal Inspection
Internal inspection investments compete for capital like any other quality program, so the case usually needs to connect to costs a plant already tracks.
Field warranty exposure
Fewer structural defects reaching the field reduces exposure to delayed capacity fade and swelling claims.
Formation yield improvement
Catching severe defects before formation avoids consuming formation capacity on cells likely to fail or underperform.
A Composite Line: Field Return Rate Before and After Internal Inspection
Twenty production months across a cell line compared on structural-defect-related field returns before and after tiered internal inspection was added. Each cell represents one month, illustrative data.
The improvement tracked closely with catching a recurring winding misalignment pattern that had been intermittently escaping sample-based inspection for months before full-line 2D scanning made it visible on nearly every affected batch.
Five Practices That Reduce Structural Defect Rates
Detection finds defects that have already formed. These five practices reduce how often they form in the first place.
Winding tension control
Tight, consistent tension control during winding is the single biggest lever against folding and misalignment.
Calendering pressure uniformity
Even roll pressure across the web width prevents localised density variation that contributes to delamination risk.
Electrolyte fill vacuum profile
A well-tuned vacuum fill cycle reduces trapped gas pockets that become internal voids.
Alignment feedback at winding
Real-time edge detection during winding catches drift before an entire roll is affected.
Formation data correlation
Linking formation test anomalies back to imaging results helps confirm which defects actually matter for performance.
Signals Worth Watching
A short list of readings tells a process engineer where internal defect risk is building, often before scan data confirms it directly.
Find Out What Is Hiding Inside Your Cells
A short session with iFactory AI on your own imaging and process data shows exactly where structural defect risk is concentrated.
Where iFactory AI Fits
iFactory AI joins CT, 2D X-ray, ultrasonic, and formation test data into one continuous view of structural quality, by cell, by batch, and by process step.
Tiered Scan Triage
Fast 2D scanning flags anomalies that automatically trigger full CT review, balancing coverage and throughput.
Defect Classification
Scans are automatically classified by defect type, severity, and likely process origin rather than left as raw images.
Process Correlation
Defect patterns are matched against winding, calendering, and fill parameters to trace root cause.
Formation Outcome Linking
Imaging results are connected to formation test outcomes, helping confirm which defect types actually predict failure.
Connecting Imaging Teams, Process Engineering, and Quality
Structural defect data touches imaging operators, process engineers, and quality leads, and each typically needs a different slice of the same scan results.
Imaging operators need to know which cells to scan and at what resolution, which is where tiered triage reduces manual decision-making during a shift. Process engineers need defect patterns connected to winding, calendering, and fill parameters so they can trace a recurring issue to its source rather than treating each flagged cell as an isolated event. Quality leads need the aggregate view, defect rate by type and by line, to track whether corrective actions are actually reducing structural risk over time rather than just reacting to individual flagged units.
A shared scan record also supports supplier and design discussions that extend beyond the factory floor. When a structural defect pattern correlates with a specific electrode material lot or separator thickness, that evidence carries far more weight with a supplier or a design team than a general complaint about field performance, because it is traceable to an identifiable batch rather than inferred after the fact.
Comparing Coverage Strategies by Cell Volume
The right inspection coverage level depends heavily on production volume. A pilot line and a high-volume gigafactory line face very different throughput constraints.
| Line Type | Typical Coverage | Primary Constraint |
|---|---|---|
| Pilot or low-volume line | Full CT on most or all cells | Throughput rarely a limiting factor at low volume |
| Mid-volume production line | 2D scan on every cell, CT on flagged samples | Balancing scan time against line speed targets |
| High-volume gigafactory line | 2D screening plus statistically triggered CT sampling | CT throughput becomes the binding constraint |
Lines that scale production volume over time often need to revisit their coverage strategy more than once, since a sampling plan calibrated for a pilot line's volume can leave meaningful gaps once the same line ramps toward full gigafactory output.
Frequently Asked Questions
Do we need to scan every single cell with full CT?
Most programs do not, since full CT throughput is usually too slow for 100% inline coverage at gigafactory volumes. A tiered approach, fast 2D scanning on every cell with CT triggered by anomaly flags, is the more common and practical configuration. Support can model a tiered coverage plan for your line speed.
How accurate is automated defect classification compared with a trained reviewer?
Automated classification is trained against reviewer-labelled scans and generally matches well on common defect types once tuned to a specific cell format, though a human review step is typically kept for ambiguous or novel-looking anomalies. Accuracy improves over time as more labelled scans are collected from your own lines, and most programs track classifier agreement against reviewer decisions as an ongoing quality check on the system itself.
Can this work with imaging equipment we already have installed?
In most cases, yes. The analytics layer typically connects to existing CT, X-ray, and ultrasonic systems rather than requiring new imaging hardware, focusing the investment on classification, correlation, and triage rather than on replacing equipment that already works. A short review can confirm compatibility with your current imaging setup.
What data do we need to get started?
Imaging output from whatever scanning technology is currently installed, along with process parameters from winding, calendering, and fill stations, form the core. Formation test results add the ability to correlate defects with actual performance outcomes. Most gigafactory lines already generate this data across separate systems that have simply never been connected into one view before.
How does this help with field-failure root cause analysis?
When a field failure is suspected to have a structural origin, batch-level scan records let a quality team check whether an anomaly was flagged for that batch at the time of manufacture, often substantially narrowing an investigation. Ask support how scan records support field-failure investigations alongside your existing quality workflow.
Stop Shipping Defects You Cannot See From Outside
iFactory AI turns CT, X-ray, and ultrasonic data into early warnings that catch structural defects before cells leave the factory. Book a walkthrough on your own line.