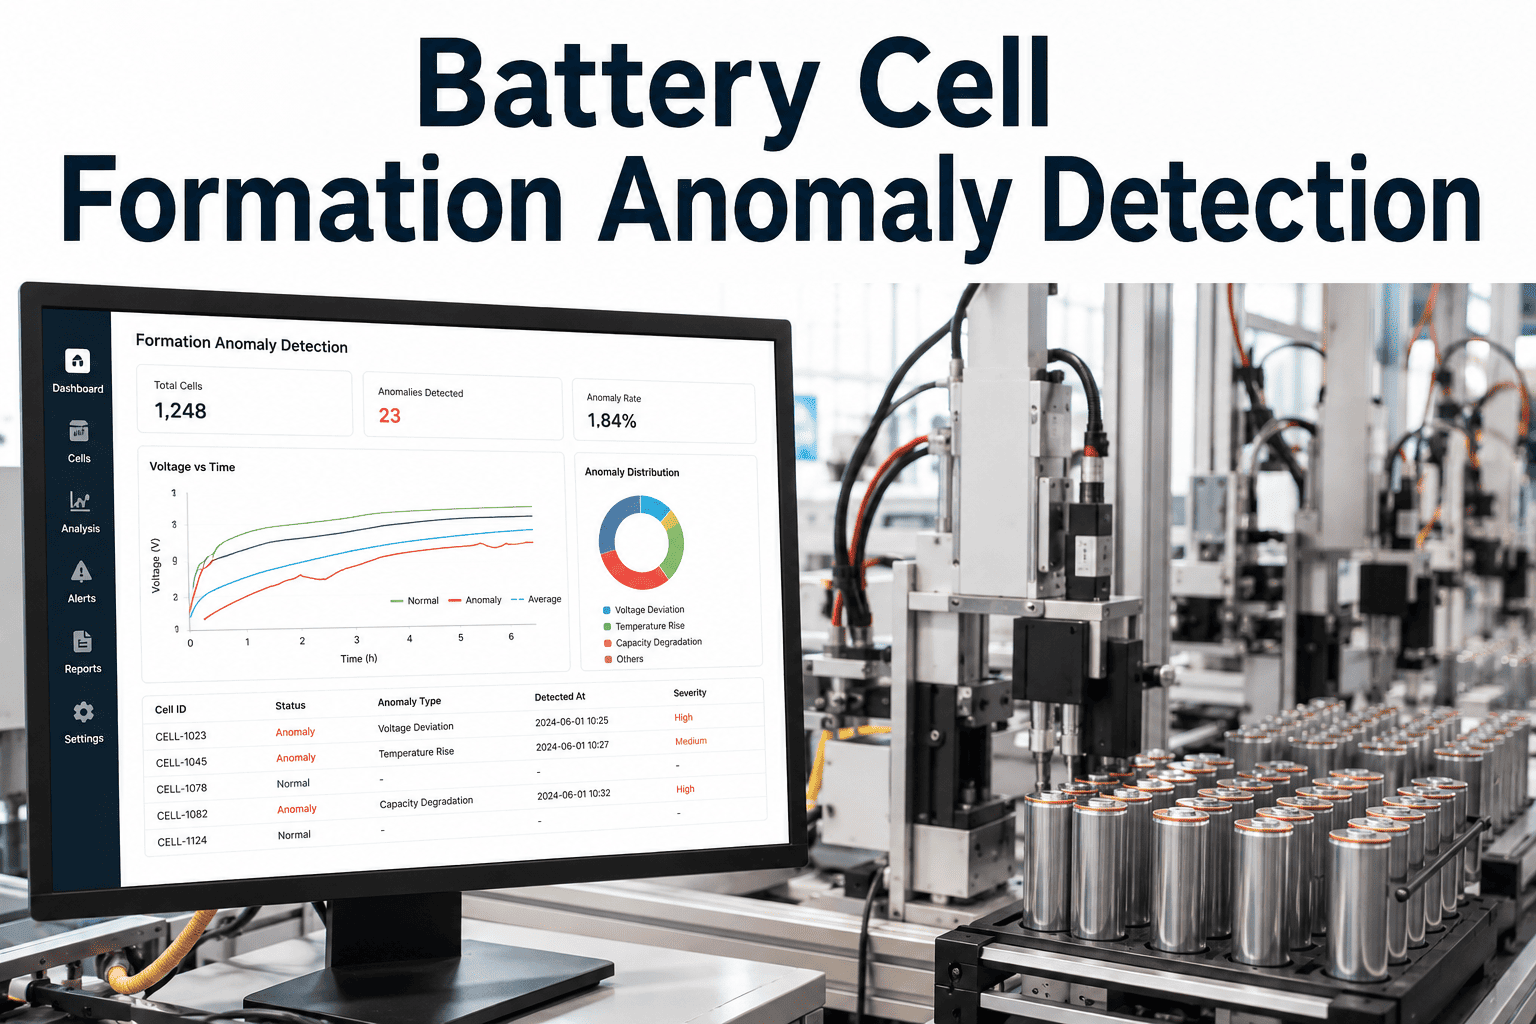
A single metallic particle smaller than a grain of sand, trapped between an electrode and a separator, can be the difference between a cell that performs for a decade and one that develops an internal short months after it leaves the factory. Battery cell lines run inside controlled cleanroom environments for exactly this reason, yet particles still get in, from tooling wear, packaging, operator movement, or the raw materials themselves. Cell lines that want a clearer picture of where contamination actually enters their process can walk through a contamination source review on real production data.
Find the Particle Before It Finds a Short Circuit
iFactory AI combines particle counting, metallic contamination scanning, and cleanroom condition monitoring into one view of where contamination risk is building on your cell line.
Three Layers of Contamination Risk
Cell line contamination is not one problem with one fix. It separates into three layers, each requiring a different detection method and a different response.
Particulate contamination
Dust, fibres, and general debris that can interfere with separator integrity or electrolyte wetting.
Metallic contamination
Fe, Cu, Zn, and other conductive particles that pose the highest internal-short risk, even at microscopic size.
Environmental drift
Humidity, pressure differential, and air change rate deviations that make a cleanroom less effective without a single visible particle.
The three layers interact in a way that makes single-metric monitoring misleading. A cleanroom can show an acceptable total particle count while a metallic contamination event goes undetected, because metallic particles are a small fraction of total particle volume. Conversely, an environmental excursion can occur with the room still appearing visually clean, since humidity and pressure drift do not leave a visible trace until they show up later as a wetting or adhesion defect.
Dry rooms used for electrolyte fill add a fourth consideration that is easy to overlook when contamination control is framed purely around particles. Moisture is itself a contaminant for lithium-ion chemistries, and a dew-point excursion during fill can degrade a cell just as reliably as a metallic particle, through a completely different failure path. Programs that treat humidity as an environmental nuisance rather than a contamination category tend to under-invest in dew-point monitoring relative to its actual risk, even though a prolonged excursion can affect every cell filled during that window rather than a single isolated unit.
The size distribution of particles found on a line also tells a story worth reading on its own. A line generating mostly large, visible particles usually has a packaging or transfer issue, while a line generating a steady background of sub-micron particles more often points to HVAC filtration performance or a process step generating fine debris continuously, such as slitting or trimming.
Where Contamination Enters the Line
A composite root-cause breakdown across several cell lines, grouped by contamination source. Bar length shows an illustrative share of flagged contamination events traced to that source.
Mechanical sources top the list for a simple reason: winding, stacking, and slitting equipment wears continuously, and worn tooling sheds exactly the kind of fine metallic debris that poses the greatest risk. A maintenance program tuned to contamination control, not just mechanical uptime, is often the single highest-leverage fix available.
Operator-related contamination carries its own pattern worth separating from general garment shedding. Movement speed and frequency through a zone matters as much as gowning compliance, since every door cycle and every pass through a doorway briefly disturbs the pressure cascade protecting that zone. Two operators in identical gowning can contribute very differently to contamination risk depending on how often they transit between zones during a shift.
Incoming material contamination is the hardest category to fix at the cell line itself, because by the time a contaminated foil or separator lot reaches the line, the contamination is already embedded in the material. This is why many programs push particle and metallic screening upstream to receiving inspection, catching a bad lot before it enters the cleanroom rather than relying on in-process detection to catch it after the fact.
Supplier-level contamination data closes this loop further. When receiving inspection results are tracked by supplier and lot over time, a plant can identify a supplier whose material consistently runs closer to contamination limits before that supplier ever sends a lot that actually fails, turning a reactive screening step into an early warning system for the supply chain itself.
See Your Own Contamination Sources, Ranked by Risk
Book a 30-minute session and iFactory AI will map particle, metallic, and environmental trends against your cell line's zones and equipment.
What Each Detection Method Actually Catches
Contamination detection on a cell line combines several technologies, because no single method covers particulate, metallic, and environmental risk at once.
| Method | What It Detects | Typical Placement |
|---|---|---|
| Airborne particle counters | Total particle concentration by size bin | Fixed monitoring points across cleanroom zones |
| X-ray fluorescence scanning | Metallic particle composition and size | Inline on electrode or separator web, or at sampling stations |
| Vision-based surface inspection | Visible particles and foreign material on electrode surface | Inline at coating, calendering, or winding stations |
| Humidity and dew-point sensors | Moisture ingress risk, especially before electrolyte fill | Dry room and electrolyte fill zones |
| Differential pressure sensors | Cleanroom zone pressure cascade integrity | Zone boundaries and doorways |
Why Metallic Contamination Gets Separate Attention
Not all contamination carries equal risk. A fibre trapped in a separator is usually harmless; a conductive metallic particle in the same spot is a latent short circuit. Plants comparing detection coverage can review metallic-specific detection options for their own line.
The risk gap between metallic and non-metallic particles widens further once a cell goes into service. A trapped fibre is static once the cell is sealed, but a metallic particle under electrical stress can migrate slowly through the separator over repeated charge cycles, meaning a cell can pass formation testing and still develop a short months or years later. This delayed failure path is exactly why field-failure investigations increasingly request contamination records going back to manufacturing, not just formation test results.
Building a Case for Expanded Contamination Monitoring
Like most quality investments, contamination monitoring upgrades compete for capital, so the case usually needs to tie back to costs a plant already tracks closely.
Formation yield recovered
Fewer contamination-driven formation failures translate directly into recovered cells and recovered formation capacity.
Warranty and field risk
Reduced metallic contamination lowers exposure to delayed internal-short failures that surface after cells are in the field.
Investigation time saved
Batch-level contamination records cut the time needed to trace a field or formation failure back to a likely cause.
A Composite Line: Contamination Events Before and After Added Monitoring
Twenty production weeks across a cell line compared on flagged contamination events before and after metallic scanning and zone-level environmental monitoring were added. Each cell represents one week, illustrative data.
The improvement tracked closely with identifying and fixing two worn tooling components in the winding section, which had been the largest unmeasured contamination source on the line before metallic scanning made the pattern visible.
Five Practices That Reduce Contamination Risk
Detection finds contamination that has already occurred. These five practices reduce how often it happens in the first place.
Tooling wear tracking
Scheduling replacement by wear indicators rather than a fixed calendar interval reduces metallic shedding at its source.
Gowning and access discipline
Consistent gowning protocol and controlled access points reduce the largest human-driven contamination source.
Incoming material screening
Checking foil, separator, and powder lots before they enter the cleanroom catches contamination that originates upstream.
Pressure cascade verification
Confirming zone-to-zone pressure differentials stay within range keeps less-clean air from migrating into critical zones.
Filter change tracking
Linking HVAC filter condition to particle count trends shows when a filter change is needed before counts drift upward.
Signals Worth Watching
A short list of readings tells a cleanroom supervisor where to look first, before contamination becomes a yield problem.
Find Out Where Your Cell Line Is Most Exposed
A short session with iFactory AI on your own cleanroom data shows exactly where contamination risk is building.
Where iFactory AI Fits
iFactory AI joins particle counter, metallic scan, and environmental sensor data into one zone-by-zone and shift-by-shift view of contamination risk.
Zone-Level Risk Mapping
Particle, metallic, and environmental readings are tracked by cleanroom zone, not just as a single plant-wide number.
Metallic Event Correlation
Metallic detection events are matched against equipment maintenance records to trace wear-driven contamination to its source.
Environmental Drift Alerts
Humidity and pressure trends are flagged before they cross a hard limit, giving facilities teams time to respond.
Batch-Level Traceability
Contamination events are linked to affected cell batches, supporting faster disposition and root-cause closure.
Keeping Facilities and Quality Teams Aligned
Contamination control sits at the intersection of facilities, maintenance, and quality, and each team tends to see a different piece of the picture.
Facilities teams own HVAC and pressure cascade performance and typically respond fastest to environmental drift alerts. Maintenance teams own the tooling wear that drives much of the metallic contamination risk, and they respond best to specific equipment-level signals rather than a general contamination report. Quality teams need the batch-level view to make disposition decisions and close out field or formation failures. A shared data layer lets each team work from their own relevant slice without waiting on a combined report assembled after the fact.
This shared view also shortens the loop between detecting a contamination trend and confirming a fix worked. Rather than waiting weeks for a formation yield report to show improvement, a maintenance action on a specific piece of tooling can be checked against metallic detection counts within days, long before the effect would otherwise be visible in downstream yield numbers.
Comparing Detection Coverage Options
Not every cleanroom starts from the same baseline, and the right next investment depends on which layer of contamination risk is currently least visible.
| Current State | Most Likely Gap | Suggested Next Step |
|---|---|---|
| Particle counters only | No metallic-specific detection | Add X-ray fluorescence or equivalent metallic scanning |
| Metallic scanning, periodic | Gaps between sampling intervals | Move toward inline or higher-frequency sampling |
| Strong particle and metallic coverage | Limited environmental trend visibility | Add continuous humidity and pressure differential monitoring |
| Good sensor coverage, siloed systems | No shared, correlated view across teams | Integrate data into one zone and batch-level analytics layer |
Most plants find that the final step, moving from good individual sensors to a correlated view, delivers more practical benefit than adding another standalone sensor type, because the biggest blind spot is usually not a missing measurement but a missing connection between measurements that already exist. Sensors that have been reporting into separate systems for years often reveal patterns the moment they are viewed side by side that neither system showed on its own.
Frequently Asked Questions
How small a particle can this actually detect?
Detection thresholds depend on the specific technology and configuration, but X-ray fluorescence and similar metallic scanning methods are typically tuned to catch particles well below what is visible to the naked eye, since that is the size range most associated with internal short risk. The right threshold also depends on cell chemistry and separator thickness, since thinner separators tolerate smaller particles before risk rises meaningfully. Support can review detection thresholds appropriate for your cell chemistry.
Does this replace our existing cleanroom certification process?
No. Formal cleanroom classification and certification remain a separate, standards-based process. Continuous contamination monitoring complements certification by catching drift and events between certification cycles, giving teams visibility in the gaps that periodic certification does not cover, and giving facilities teams earlier warning of a filtration or pressure issue than the next scheduled certification audit would provide.
Can this distinguish which equipment caused a metallic event?
In most cases, yes, by correlating the location and timing of a detected event with zone layout and equipment maintenance records. The precision depends on sensor placement density, and a short review can show what resolution is achievable on your current layout. Walk through equipment-level correlation on your own line in a short session.
What data do we need to get started?
Particle counter feeds, metallic scanning data where installed, and environmental sensor readings such as humidity and differential pressure form the core. Equipment maintenance records add the ability to trace events to specific tooling. Most gigafactory cleanrooms already generate this data across separate systems that simply need to be connected.
How does this help with field-failure investigations?
When a field or formation failure is traced back to a suspected internal short, batch-level contamination records let a quality team check whether an elevated particle or metallic event was logged for that batch, narrowing the investigation considerably compared with starting from scratch. Ask support how contamination records support failure investigations in your existing quality workflow.
Protect Every Cell From Contamination You Cannot See
iFactory AI turns particle, metallic, and environmental data into early warnings that keep your cell line clean batch after batch. Book a walkthrough on your own line.