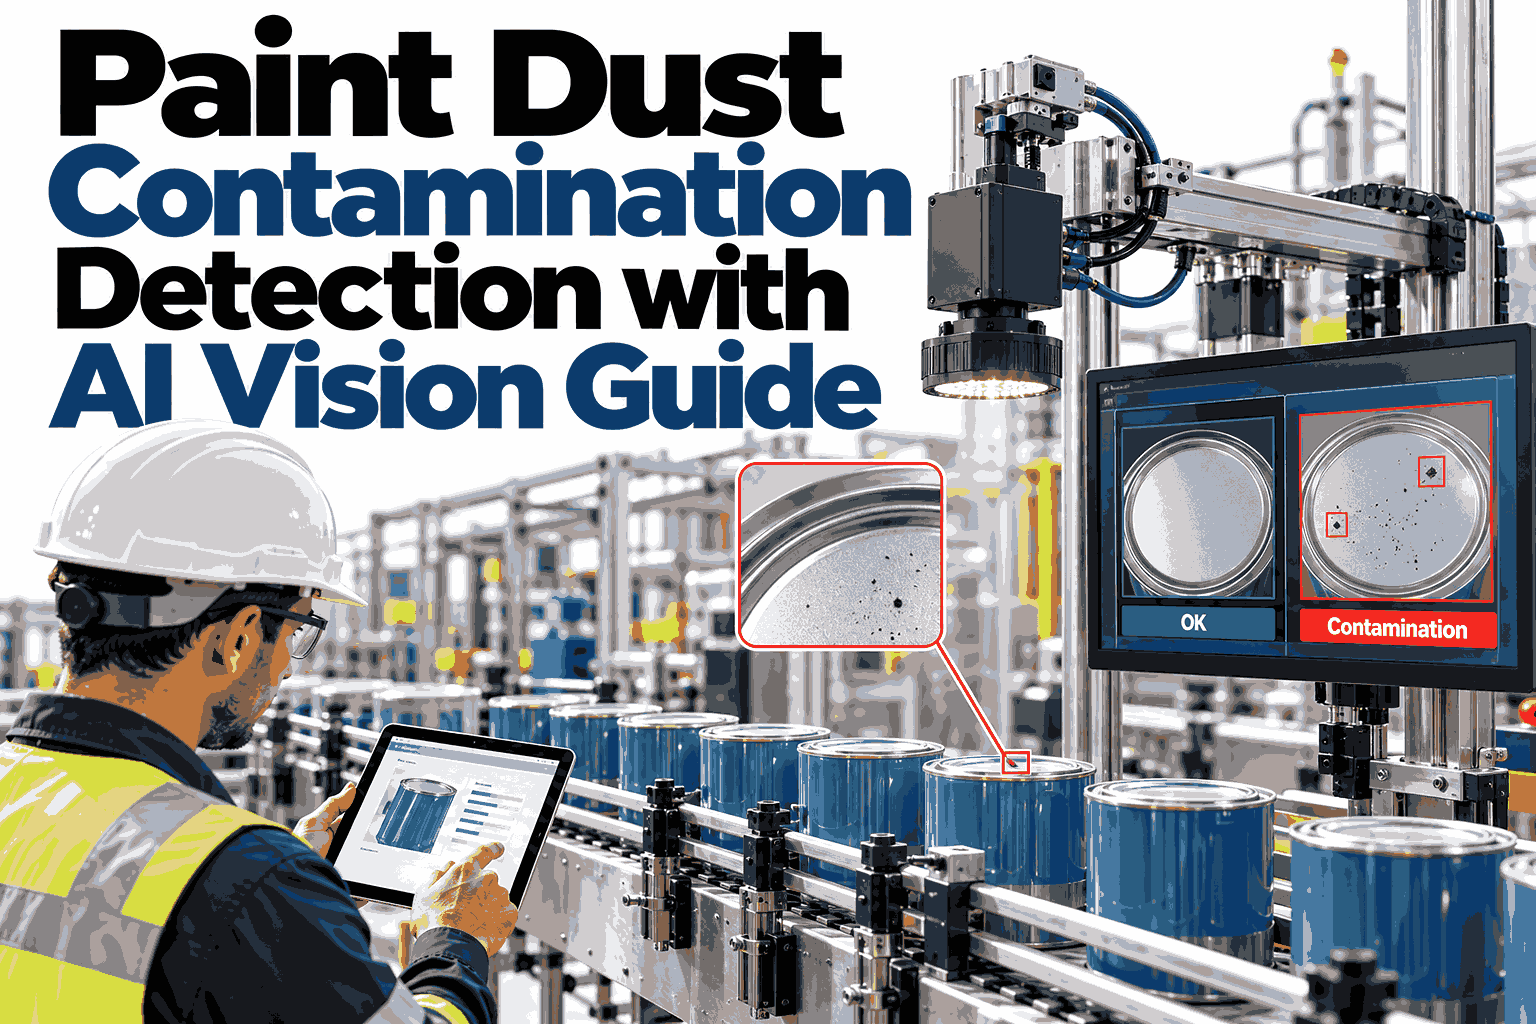
Paint Dust Contamination Detection with AI Vision Guide

By James Smith on October 8, 2026

paint-dust-contamination-detection-with-ai-vision-guide

A single speck of dust under a clear coat is small enough to miss on a quick glance and large enough to send a body back through repair. Dust, fibers and lint are among the most common paint finish complaints because they come from everywhere: supply air, conveyors, clothing, surface prep and the booth itself. Inspectors can find the nibs they see, but tracing where they came from takes pattern analysis that human eyes cannot do at line speed. To see how particle recognition and booth correlation work on real panels, explore a recorded dust-defect case from a paint line like yours with iFactory.

P2 · AUTOMOTIVE PAINT DEFECT DETECTION

Paint Dust Contamination Detection With AI Vision

Recognize micron-scale particles, analyze where they cluster and link each pattern to the booth conditions that caused it.

Fleck
Grit
Lint
Fiber
WHERE DUST COMES FROM

Five Entry Points Into a Paint Booth

Every dust nib has an origin, and the first step to removing it is knowing which entry point is most likely responsible.

1
Supply Air
Clogged or leaking filters pass fine particles into the spray zone.
2
Body Surface
Seams, sealer edges and sanding residue release debris after wipe-down.
3
Conveyor and Fixtures
Moving parts shed flakes and old overspray onto passing bodies.
4
People and Garments
Fibers and lint travel with each entry and exit.
5
Booth Surfaces
Dried paint on walls and grates breaks loose with airflow changes.
SPECIMEN TRAY

What Each Particle Type Looks Like to the Camera


Fleck
Small round bump, often from paint or sealer debris.

Grit
Angular, sharp-edged, usually sanding or abrasive residue.

Lint
Soft, uneven blob that often traces back to wipes or clothing.

Fiber
Long, thin line, commonly from garments or tack cloths.

Shapes are simplified illustrations of typical appearance.

Classify every nib instead of just counting them

iFactory can label particle shape and size from your panel images and show which types dominate each shift.

CLUSTER ANALYSIS

Random Specks Versus a Pattern Pointing to a Source

When defects land evenly across a panel the cause is usually general air quality, but a tight cluster points to one specific place.

Scattered
Suggests airborne dust or general cleanliness.
Clustered
Suggests a local source such as a seam or fixture.
BOOTH CORRELATION

Matching Defect Spikes to What Happened in the Booth


Normal run

Shift change

Door opened

Filter overdue

Pressure dip

Bars are illustrative of defect counts by booth event, not measured data.

TRACE THE SOURCE

From Particle Type to the Most Likely Cause

Particle TypeLikely SourceVision SignatureFirst Action
FiberGarments, tack clothsLong thin line, random angleCheck garment and wipe routine
GritSanding or prep residueAngular, clusters near repair zonesReview blow-off and wipe step
FleckOverspray or sealer debrisRound, repeats at same positionInspect fixtures and booth walls
LintWipes, air handlingSoft blob, spread across panelsCheck filters and airflow
THE INVESTIGATION

Five Moves That Turn Dust Data Into a Fix

KNOW THE LIMITS

What AI Vision Still Needs From Your Team

Lighting Discipline
Inconsistent lighting hides small particles, so the imaging setup must be controlled.
Labeled Examples
Classification improves with your inspectors confirming real particle types.
Booth Data Access
Correlation needs airflow, pressure and event logs from your systems.
FREQUENTLY ASKED QUESTIONS

Questions Paint Quality Teams Ask About Dust Detection

How small a particle can the system detect?
Detectable size depends on camera resolution, lighting and surface finish, so the practical limit is confirmed on your own panels. Setup is tuned to the smallest defect your standard rejects. Test your smallest reject size against real panel imagery in a session.
Does it work on every color, including metallics?
Dark and solid colors show dust most clearly, while metallics and pearls need tuned lighting and models. Coverage is verified color by color during calibration. Review your difficult colors with an iFactory specialist before rollout.
How does it link defects to booth conditions?
Defect timestamps and positions are lined up with booth logs such as pressure, airflow, door events and filter status. Recurring overlaps become suspects worth testing. See a defect-to-booth timeline built from sample data on a call.
Will it replace our final inspectors?
It supports them by checking every body consistently and pointing them to the areas that matter. Judgment on borderline defects and repair decisions stays with your team. Discuss how inspector workflow changes with a short walkthrough for your line.
How long before the source analysis is useful?
Particle detection can start early, while source correlation grows stronger as more shifts and booth events are recorded. Most patterns need several weeks of data to separate signal from noise. Plan a realistic first-month analysis target together for your booth.
FIND THE DUST, THEN FIND WHERE IT CAME FROM

Cut Dust Defects by Fixing Their Source, Not Their Symptoms

Give your paint line particle-level visibility and booth-aware analysis that points repair effort in the right direction.


Share This Story, Choose Your Platform!