Every automotive plant can quote a Cpk for its critical dimensions. Far fewer can say what it was yesterday, which way it is heading, or whether the number from the CMM room agrees with the laser cell on the line. Capability is usually a study — thirty parts, one afternoon, one report — and a study is out of date the day a clamp is changed. iFactory turns it into a live measure: on-prem AI that combines CMM, photogrammetry and laser data into one plant-wide view of dimensional Cpk, by feature and by day. To see it on your own characteristics, book a capability walkthrough.
Know Your Dimensional Cpk Across the Whole Plant — Every Day, Not Every Audit
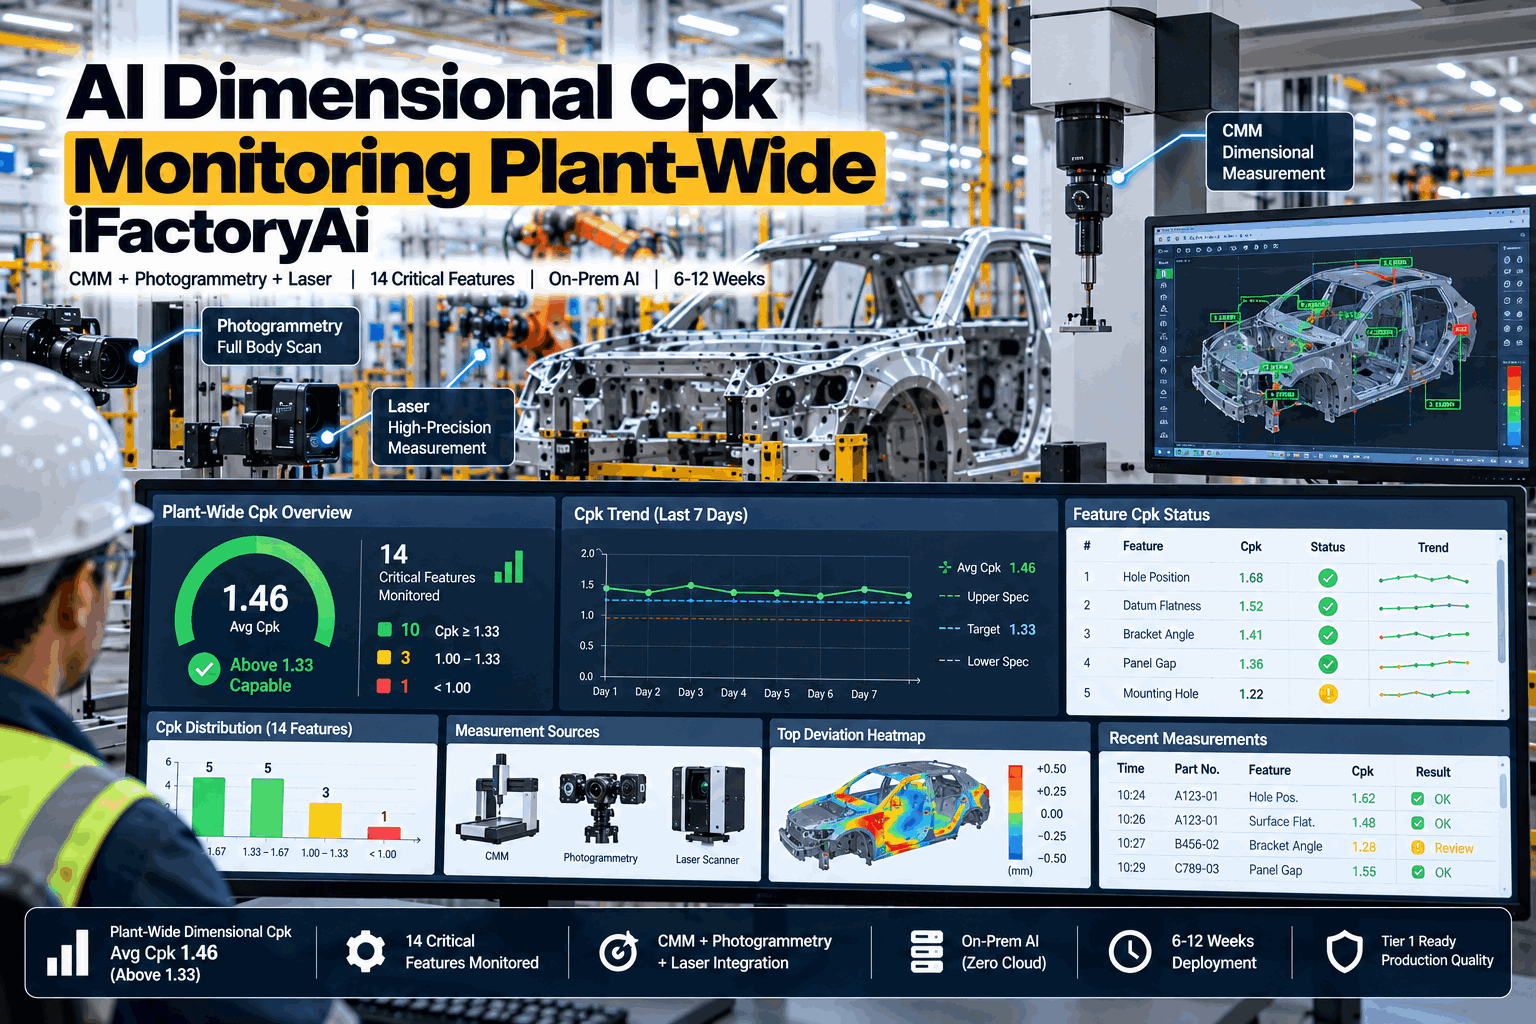
iFactory tracks each critical feature against its tolerance as parts are measured, recalculates Cpk on a rolling window, and shows the plant-wide picture on one screen: the average, the weakest feature, the seven-day trend and the features about to slip below 1.33. The AI then points to where the shift began.
- CMM, photogrammetry and laser data on one capability model
- Seven-day Cpk trend for every critical feature
- Runs on an NVIDIA AI server inside your plant
An Average of 1.46 Is Good News — and Not the Whole Story
A plant-wide average Cpk is a useful headline for a management review: one number, comfortably above 1.33. It is not a statistic to certify against, because customers and auditors judge each characteristic on its own, and an average can sit well above the line while individual features sit below it. In the example behind the dashboard above, the 14 critical features average exactly 1.46 — and three of them are under 1.33. iFactory always shows the average alongside the weakest feature and the count below threshold. For a view like this of your own control plan, speak with our quality engineers.
What Cpk Measures, and What It Needs to Be Trusted
Cpk compares the distance between the process mean and the nearer tolerance limit with three standard deviations of the process. It rewards a process that is both tight and centred, and it penalises drift even when the spread has not changed. Three things decide whether a quoted figure deserves confidence: the threshold it is judged against, the number of parts behind it, and the measurement system that produced the data. To review how your current studies are built, book a method review.
The threshold depends on the stage
Under PPAP, an index above 1.67 meets acceptance for an initial study; between 1.33 and 1.67 may be acceptable with the customer's agreement; below 1.33 does not. Customer-specific requirements can be stricter.
Thirty parts is a thin basis
A Cpk of 1.33 calculated on 30 parts has a 95% lower confidence bound near 1.03. On 125 parts it is about 1.18. Continuous data narrows that band every day without anyone running a study.
The gauge is part of the number
Measurement variation is counted as process variation. AIAG guidance treats gauge R&R under 10% as adequate and over 30% as unacceptable, so a poor gauge can make a good process look incapable.
Three Measurement Sources, One Capability Model
No single instrument sees the whole plant. The CMM is the reference but measures few parts; inline laser cells measure every body but with less absolute accuracy; photogrammetry covers large assemblies and fixtures quickly. A published evaluation of laser radar on body-in-white found exactly this trade — lower absolute accuracy than the CMM, with repeatability well within body-shell specification. iFactory uses each source for what it does best and reconciles them. Our metrology specialists can check which of your systems connect directly.
The reference
Highest accuracy, traceable, the figure a customer will accept. A bridge CMM can take 12 to 20 minutes per part, so it samples. iFactory reads its reports and uses them to anchor everything else.
The wide view
Optical measurement of large parts, apertures and whole assemblies in minutes, on or near the line. Strong for openings, flushness and fixture checks where a CMM would be slow or impractical.
Every unit
Inline laser sensors and laser radar measure features on every body within the station cycle. Their volume is what makes a daily Cpk and a seven-day trend statistically meaningful.
Putting them on one model takes three steps the AI maintains continuously: all results aligned to the same datum scheme; the offset between each inline source and the CMM tracked per feature, so a bias is corrected instead of read as drift; and the repeatability of each source monitored, so a deteriorating sensor is flagged before it distorts the capability figure.
See Your Weakest Feature Explained in Six Weeks
Share your control plan and three months of measurement exports. The pilot returns a live Cpk for each critical feature, the seven-day trend, and for every feature under 1.33 a clear answer to the first question — is it centring or is it spread?
What the AI Adds to a Capability Number
A dashboard tells you a Cpk has fallen. The useful part is knowing why, and knowing before it crosses the line. iFactory's models run on a GPU server in the plant and work on every measurement as it arrives — images, point clouds and results all stay on site. To watch the analysis run on live data, book a live session.
- Drift caught early. The mean and spread of each feature are tracked separately, so a slow shift of a few hundredths of a millimetre is flagged days before Cpk reaches 1.33.
- Centring or spread. Every weak feature is classed by cause type — the split that decides whether you adjust a fixture or investigate the process.
- Where it started. Shifts are matched against station, fixture, tool change, material lot and shift to rank the likely source.
- Related features together. A locating hole that moves takes several downstream gaps with it. The AI groups features that move as one, so you fix the cause once.
Where the Critical Features Come From
Dimensional capability is a plant-wide subject because the dimensions that matter to the customer are built in several shops and only meet at the end. A gap measured in final assembly is decided by a hole pierced in the body shop. iFactory keeps features from every area on one screen and one datum scheme. For help deciding which characteristics belong on yours, ask our application engineers.
Capability Study, Machine Report and Plant-Wide Monitoring Compared
Most plants already produce Cpk figures two ways. Neither was designed to answer the question a plant manager asks on Monday morning.
The tools exist because the need is established: the coordinate measuring machine market alone has been forecast at about USD 4.3 billion, growing near 9% a year, led by Hexagon, Zeiss, Nikon, FARO, Mitutoyo and Keyence. What plants lack is not measurement but a single layer that turns all of it into one capability picture.
Delivered as a Turnkey AI System — Hardware and Software Together
iFactory ships as a complete bundle: a pre-configured NVIDIA AI server, racked and ready, with the capability engine, connectors and AI models pre-loaded. Rack it, plug in power and Ethernet, and the AI is live on your plant network. Our team handles cabling, network setup, connections to measuring systems, PLC and SCADA integration, operator training and 24×7 remote monitoring. For a scoped proposal, book a deployment call.
Ship, network and data
Server delivered and racked. CMM, photogrammetry and laser results connected. Control-plan features, tolerances and datums loaded, with three months of history brought across.
Model training and pilot
Source offsets and drift models trained per feature. Cpk figures run in parallel with your existing studies and are reconciled with your metrology team.
Go-live and training
Dashboards and alerts go live for quality, production and management. Engineers are trained, and reaction plans are agreed for each critical feature.
What Each Team Gets
Plant manager
One number for the review, the three features behind any concern, and a trend that shows whether last week's fix held.
Quality manager
Capability evidence for every special characteristic on demand, for customer reviews and IATF 16949 audits.
Dimensional engineer
Mean and spread separated, related features grouped, and a ranked starting point for each investigation.
Metrology lead
Source-to-source agreement watched continuously, so a sensor or probe problem is found before it reaches a report.
Frequently Asked Questions
What is a good dimensional Cpk in automotive manufacturing?
A Cpk of 1.33 is the usual minimum for a capable process in ongoing production, and 1.67 or higher is the level at which an initial process study meets PPAP acceptance without further agreement. Safety-related and customer-designated characteristics often carry higher targets. The requirement that counts is the one in your customer's specific requirements.
Is a plant-wide average Cpk a meaningful number?
As a summary, yes; as proof of capability, no. An average such as 1.46 shows the general level and the direction of travel, which is what a management review needs. But each characteristic is judged individually, and an average can hide features below 1.33. iFactory always reports the average with the minimum and the count below threshold.
What is the difference between Cp and Cpk?
Cp compares the tolerance width with the process spread and ignores where the process is centred. Cpk uses the distance to the nearer limit, so it falls when the mean drifts. A feature with a Cp of 1.60 and a Cpk of 0.93 has an acceptable spread and a centring problem — usually a fixture or offset correction.
Can data from a CMM and an inline laser system really be combined?
Yes, with care. The two are aligned to the same datums, and the offset between them is tracked for each feature so a systematic difference is corrected instead of being read as process change. The CMM stays the reference; the inline data supplies the volume that makes daily capability figures reliable.
How is the seven-day Cpk trend calculated?
Each day's Cpk is calculated on a rolling window of the most recent measurements for that feature, using the tolerance in the control plan. Seven consecutive values form the trend. The window length is set per feature so that there are enough parts behind each point for the figure to be stable.
Does iFactory replace our CMM software or SPC package?
No. Measuring machines keep their own software for programming and reporting. iFactory reads their results, combines them across sources and areas, and adds the trend, the cause analysis and the plant-wide view. Many plants keep their SPC package for operator charts and use iFactory above it.
How long does deployment take, and what do we need to provide?
A typical plant is live in 6–12 weeks. You provide rack space, power, an Ethernet connection, access to measurement results, your control plan with tolerances and datums, and a metrology contact. iFactory supplies the pre-configured NVIDIA AI server, software, integration and training. To scope your plant, contact our scoping team.
One Capability Picture for the Whole Plant
One turnkey system — NVIDIA AI server, capability software, measurement connectors and training — delivered and live inside 12 weeks. Start with the features your customer watches most closely and extend across every shop.
- 1What is our average Cpk, and which way is it moving?
- 2Which features are below 1.33, and by how much?
- 3Which will fall below it this week?
- 4Is each one a centring problem or a spread problem?