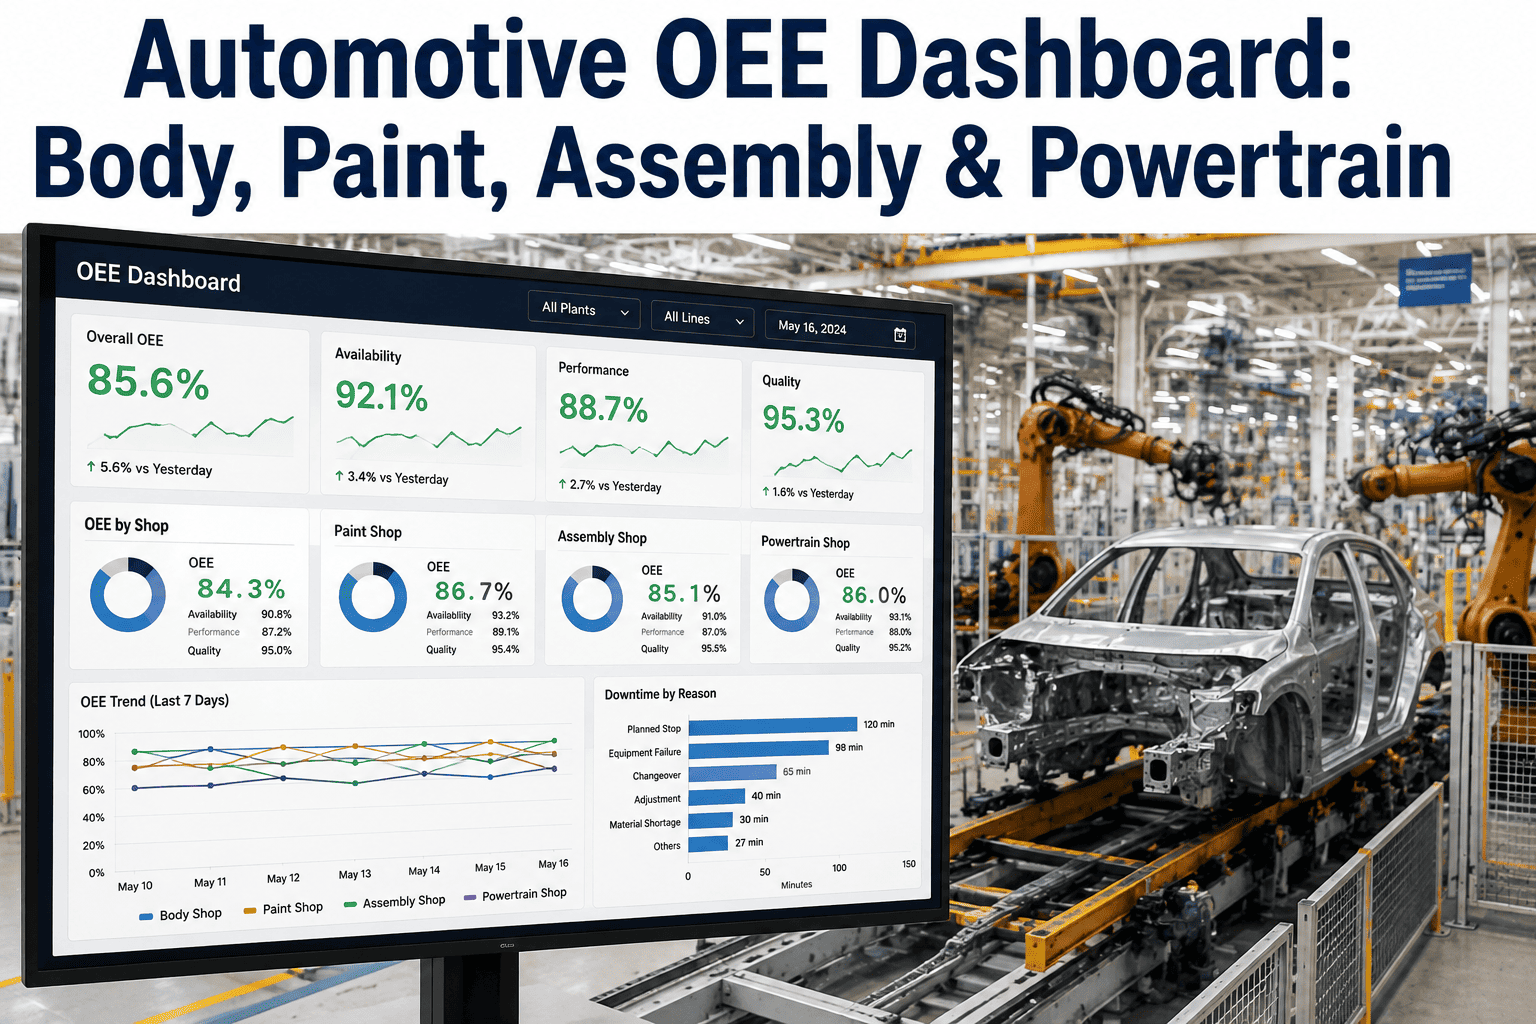
Ask a plant manager how the body shop is running today and they'll usually have an answer. Ask how that compares to paint, assembly, and powertrain on the same day, using the same metric, and the conversation tends to slow down. Each shop typically tracks performance its own way, built up over years by different supervisors with different reporting habits, which means a number that looks strong in one shop might mean something entirely different in another. OEE — availability, performance, and quality multiplied together — exists specifically to fix that, but only if it's calculated the same way, from the same underlying data, across every shop in the plant. Without that consistency, a plant-wide dashboard just displays four different opinions about performance side by side instead of one comparable picture of the whole operation.
OEE Dashboard · Plant-Wide Visibility
One OEE Standard Across Body, Paint, Assembly, and Powertrain
Four shops, four different histories of how performance gets measured. iFactory standardizes OEE calculation across the whole plant, so leadership can compare body shop output against paint shop uptime against assembly line performance using the same formula, the same data pipeline, and the same dashboard.
Four Shops, One Standard
What OEE Actually Measures in Each Shop
Body Shop
Weld and Framing Line Availability
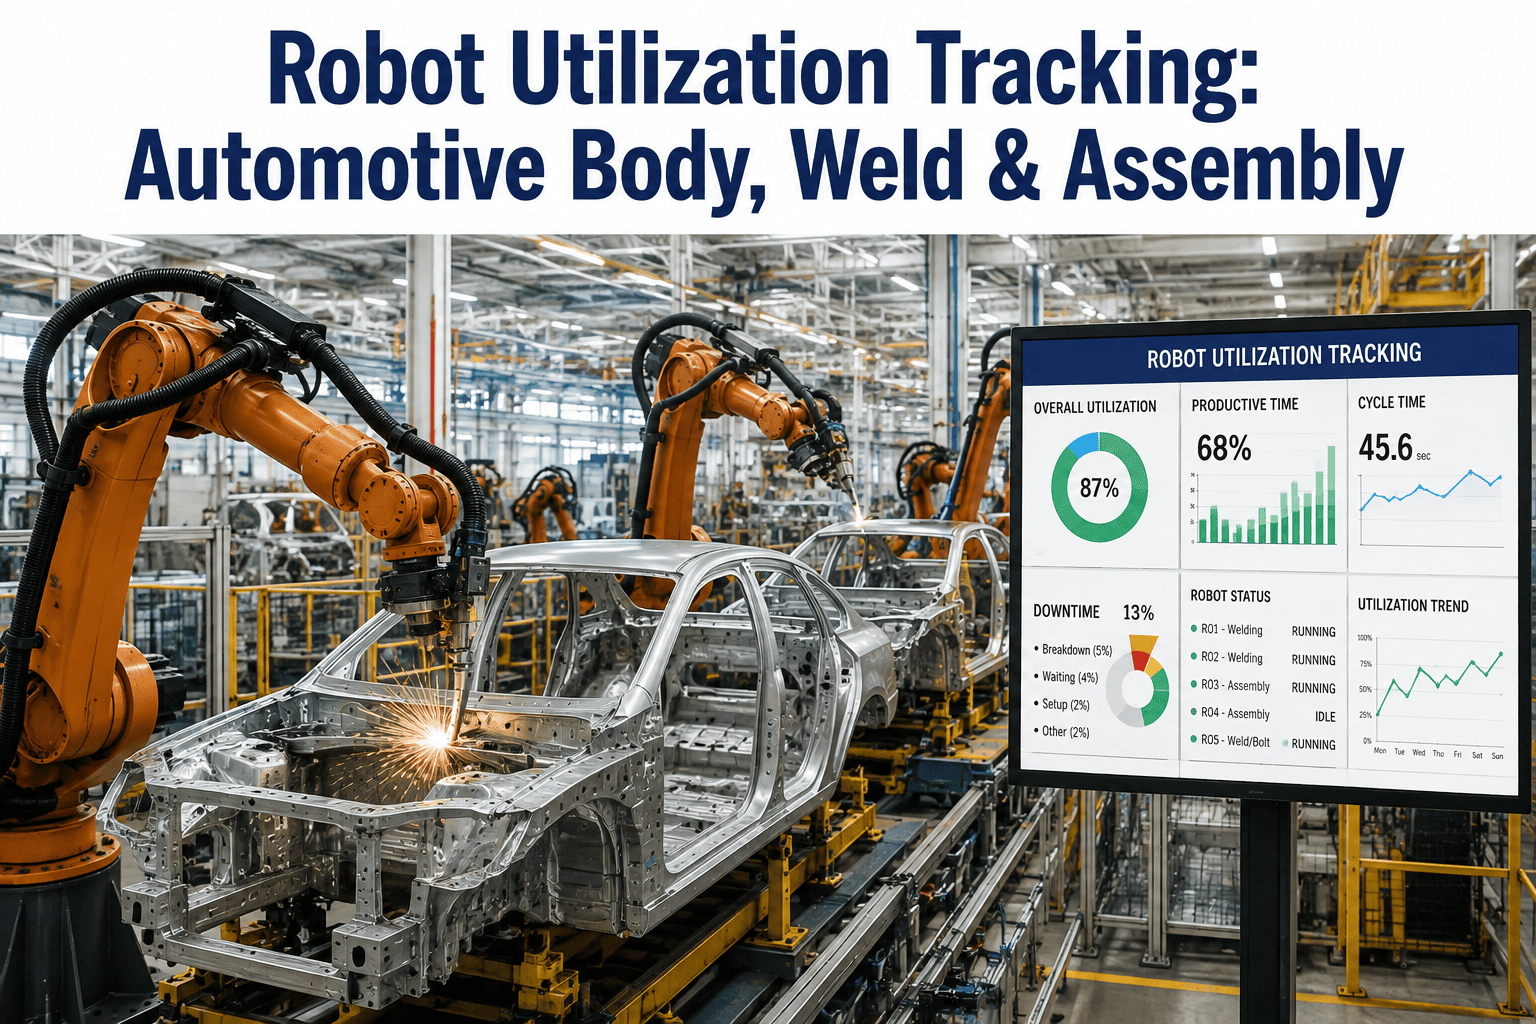
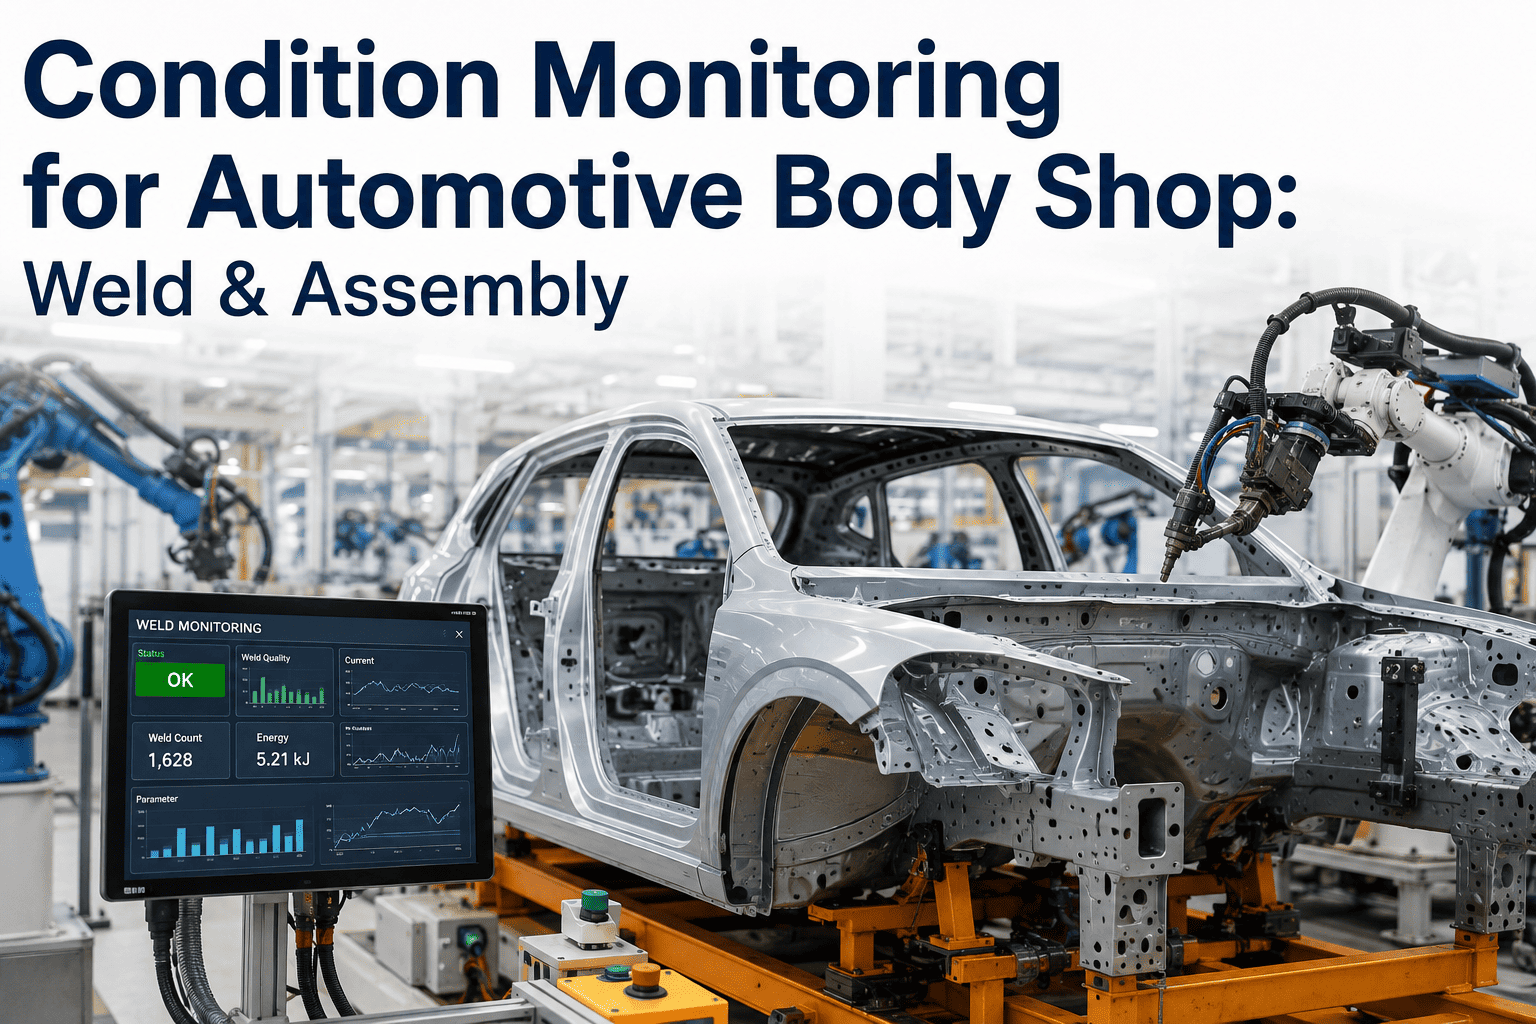
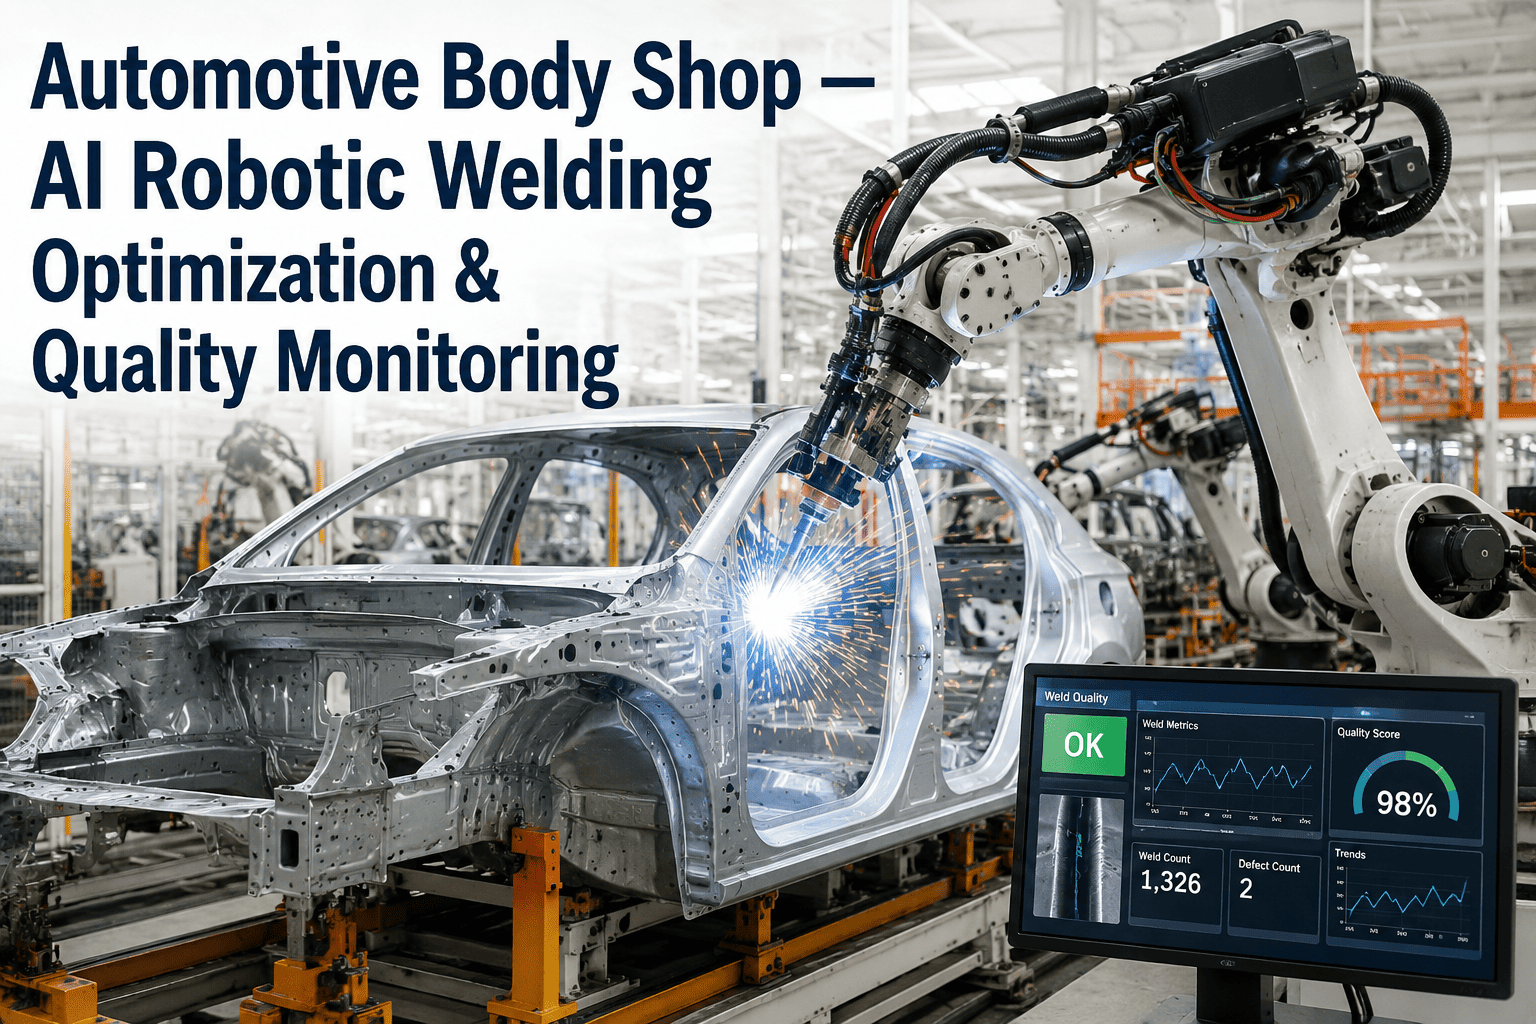
Robot cycle consistency, weld cell downtime, and line balance drive availability and performance here, while quality reflects weld integrity and dimensional accuracy of the assembled body-in-white before it moves to paint.
Paint Shop
Booth Uptime and Finish Quality
Availability here is shaped by oven and booth changeovers between color runs, performance by conveyor speed consistency, and quality by defect rates like runs, orange peel, or contamination caught at final inspection.
Assembly
Line Balance and Station Cycle Time
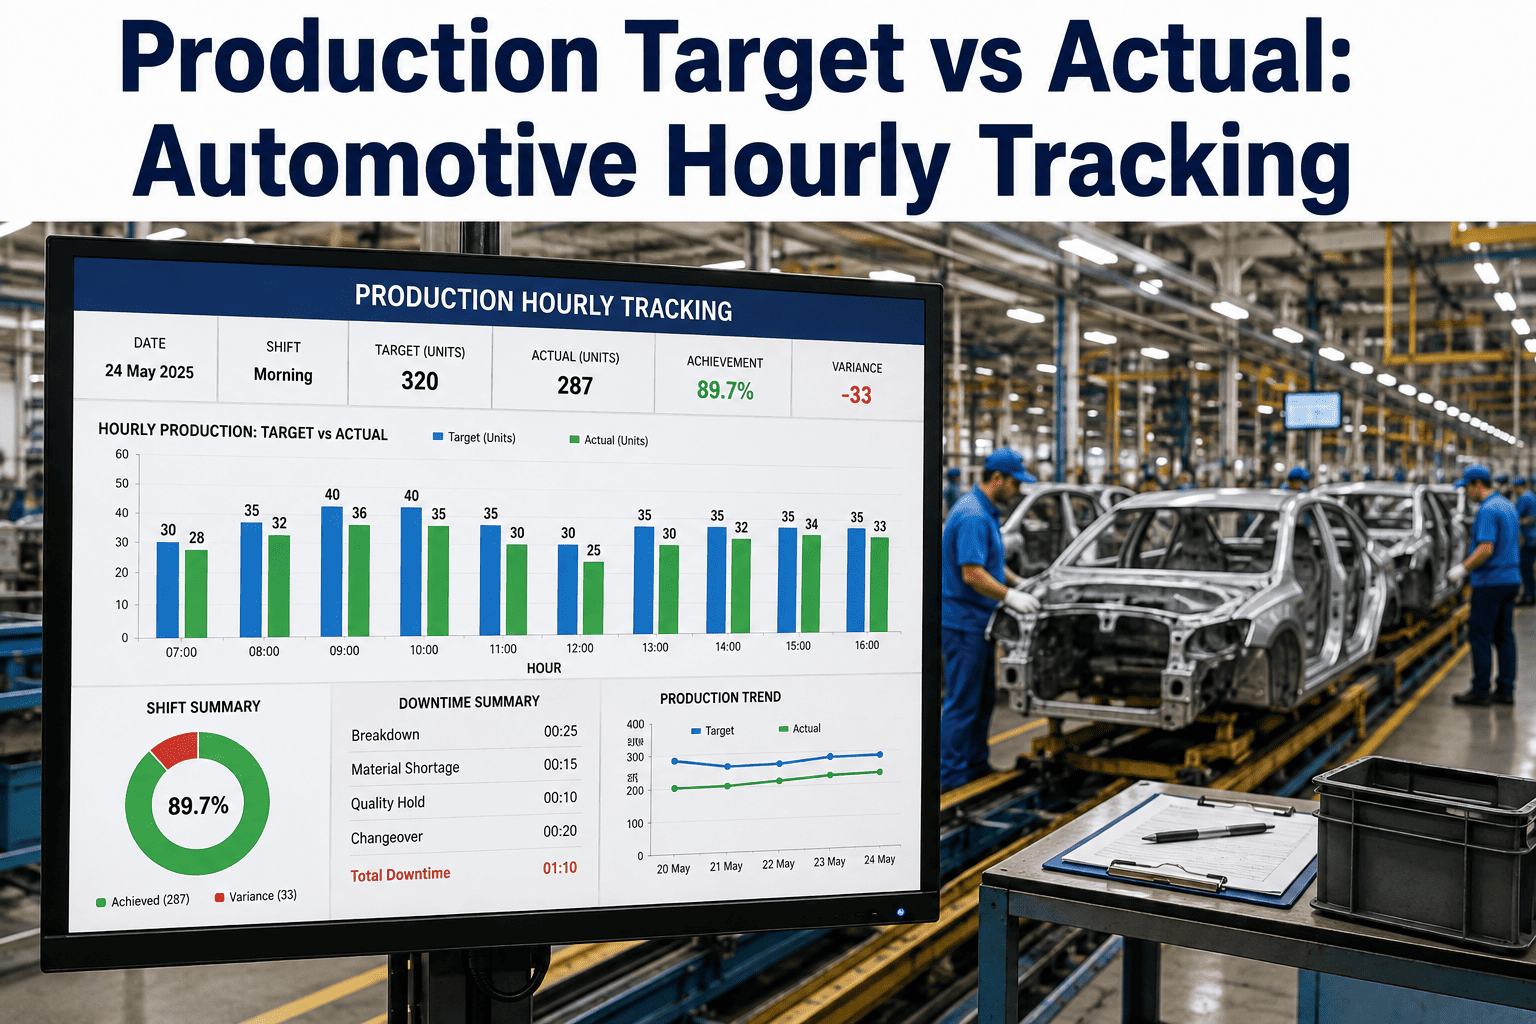
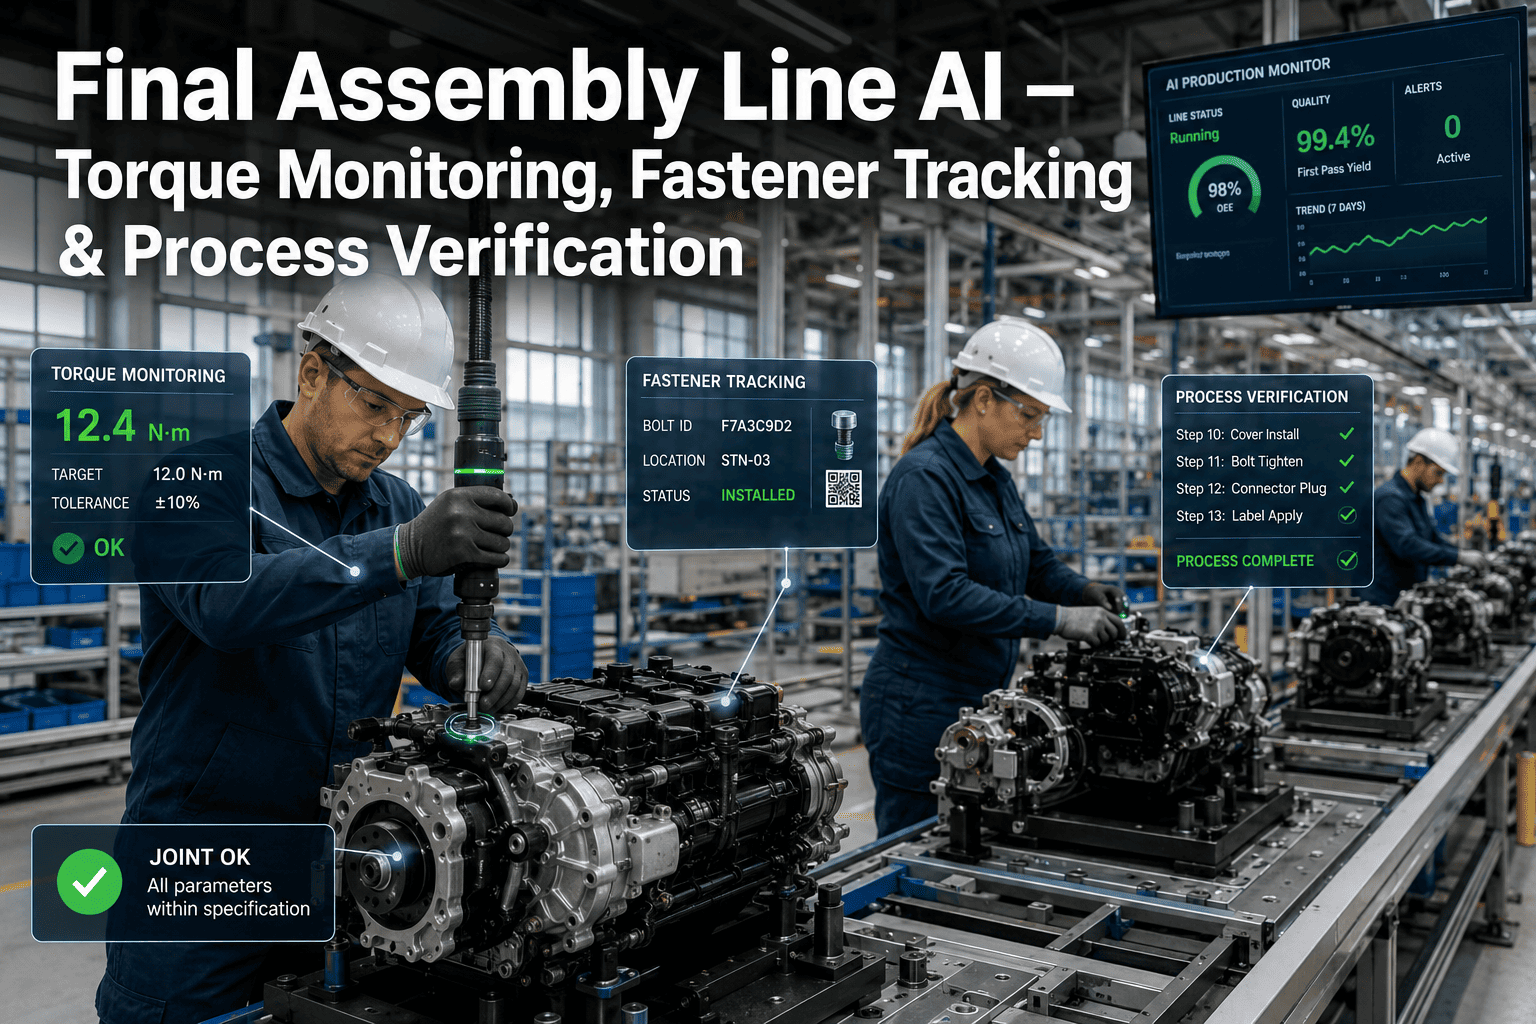
Availability tracks line stoppages from parts shortages or station issues, performance reflects how closely actual cycle time matches takt time, and quality captures fit, trim, and functional check pass rates at end of line.
Powertrain
Machining and Test Cell Precision
Availability is driven by tool changes and machine downtime, performance by actual versus rated cycle time on precision machining centers, and quality by dimensional tolerance pass rates and hot-test results on finished units.
Before and After Standardization
What Changes When Every Shop Reports the Same Way
| Question | Before Standardization | After Standardization |
|---|
| Compare shop performance | Requires manually normalizing different metrics | Direct comparison on the same dashboard |
| Identify the plant's biggest bottleneck | Guesswork based on anecdote and complaints | Ranked by actual OEE across all shops |
| Root-cause a low OEE shift | Manual investigation across separate systems | Availability, performance, quality broken out per shop |
| Report to leadership | Four separate reports with different formats | One consistent plant-wide view |
See Your Own Four Shops on One Dashboard
Most Plants Find Their Real Bottleneck Isn't Where They Expected
Bring your current shop-level reports and we'll show you what a standardized OEE view typically reveals once everything is measured the same way.
Getting There
How Plant-Wide OEE Standardization Typically Rolls Out
1
Audit how each shop currently defines and calculates OEE
2
Agree on a single, plant-wide formula and data sources
3
Connect each shop's equipment data into one pipeline
4
Validate the new numbers against what supervisors already know
5
Roll out the unified dashboard to shop and plant leadership
A Composite Scenario
A Plant Where Every Shop Claimed to Be Running Well
Before
Body shop reported OEE in the low 80s using its own formula, paint reported a similar number but excluded changeover time from availability, assembly tracked line efficiency rather than true OEE, and powertrain didn't calculate a combined figure at all, just separate uptime and scrap numbers. Leadership had no reliable way to know which shop was actually the plant's constraint.
After
Once all four shops calculated OEE the same way from the same underlying data, paint shop's true OEE came in noticeably lower than its self-reported number once changeover time was properly counted against availability, and it became the clear priority for a targeted changeover reduction project instead of assembly, which had been assumed to be the weak link.
Common Questions
Plant-Wide OEE Dashboards — FAQ
Why do shops end up calculating OEE differently in the first place?
Each shop typically develops its own tracking approach over years, shaped by whatever equipment, software, and reporting habits its supervisors inherited, and without a plant-wide initiative to standardize, small differences in what counts as downtime or what counts as a defect compound into numbers that aren't really comparable.
Our team can help audit how your shops currently differ before standardizing.
Will standardizing the formula make some shops' numbers look worse?
Often, yes, at least initially — a shop that excluded changeover time or planned stoppages from its own calculation will typically see its OEE number drop once a consistent, stricter standard is applied plant-wide. That's usually seen as a feature rather than a problem, since it reveals the real picture rather than a flattering one.
How long does a plant-wide standardization project usually take?
Most plants complete the audit and formula agreement phase within a few weeks, with the technical work of connecting each shop's equipment data into one pipeline taking longer depending on how modern or fragmented the existing systems are.
Book a demo to scope a realistic timeline for your specific shops.
Does this replace the shop-level detail supervisors already rely on?
No, the plant-wide dashboard sits alongside shop-level detail rather than replacing it — supervisors still get the granular breakdowns they need day to day, while leadership gains a comparable, standardized view across shops that wasn't previously possible from four separate reporting systems.
Can this help decide where to invest capital across the plant?
Yes, and it's one of the more valuable outcomes — a standardized OEE view shows which shop is genuinely the plant's constraint, so capital and improvement projects can be prioritized based on measured impact rather than whichever shop made the loudest case in a budget meeting.
Stop Comparing Four Different Definitions of "Running Well"
Get One Standardized OEE View Across Body, Paint, Assembly, and Powertrain
iFactory unifies OEE calculation across every shop in your plant, so leadership finally sees a true, comparable picture of where performance actually stands.