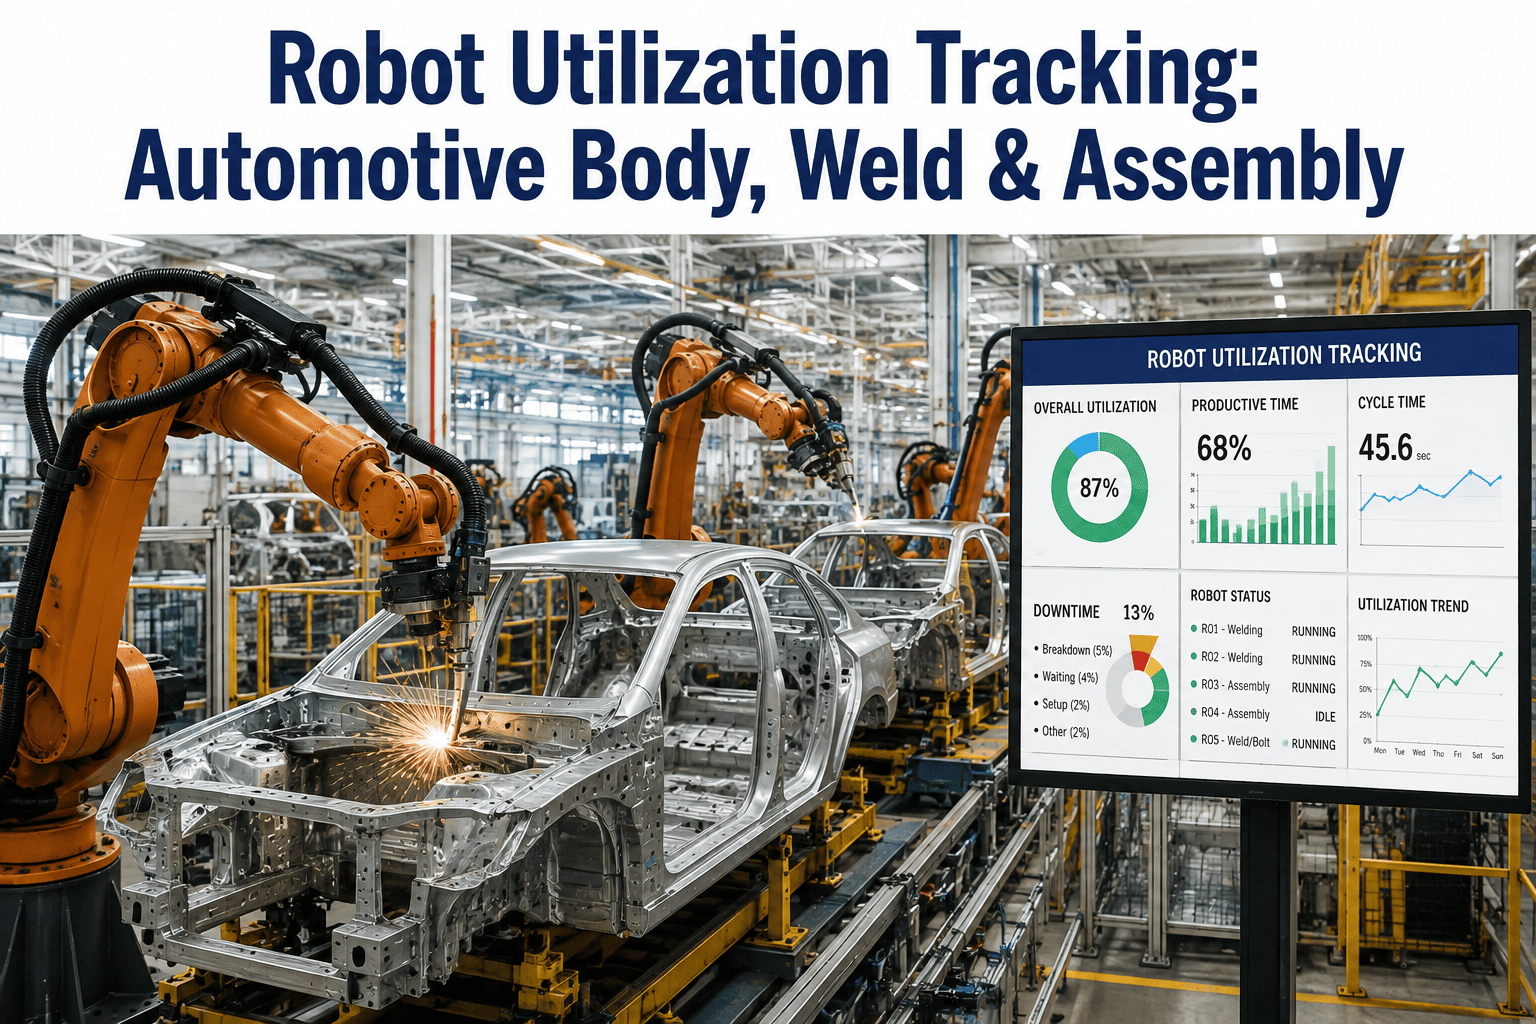
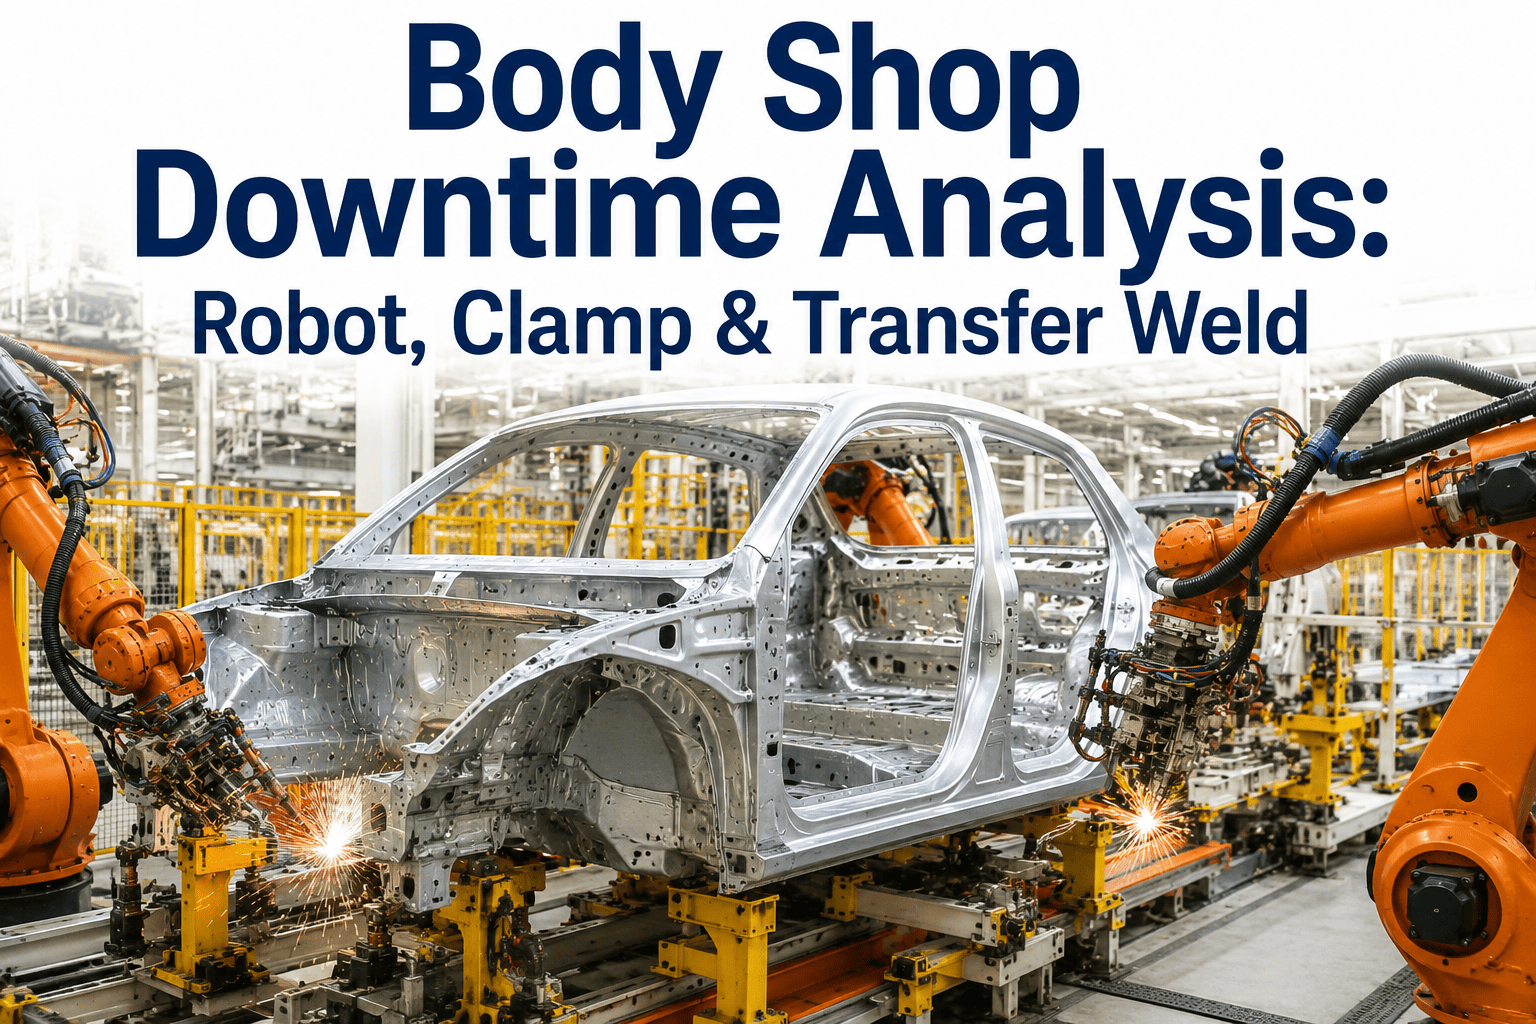
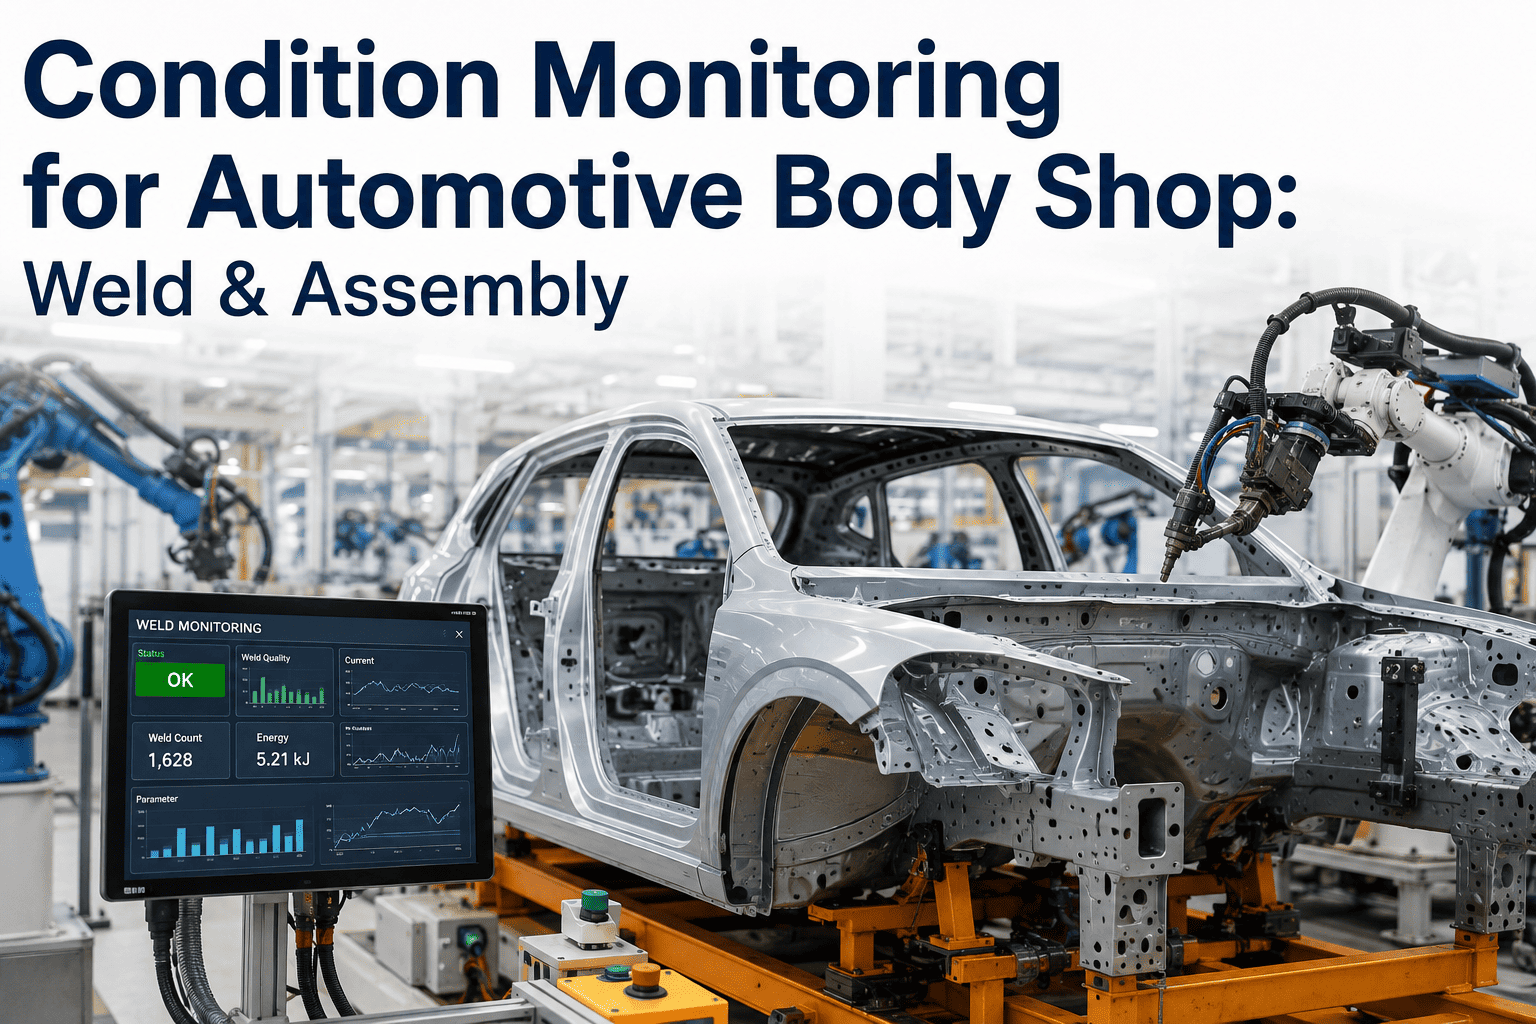
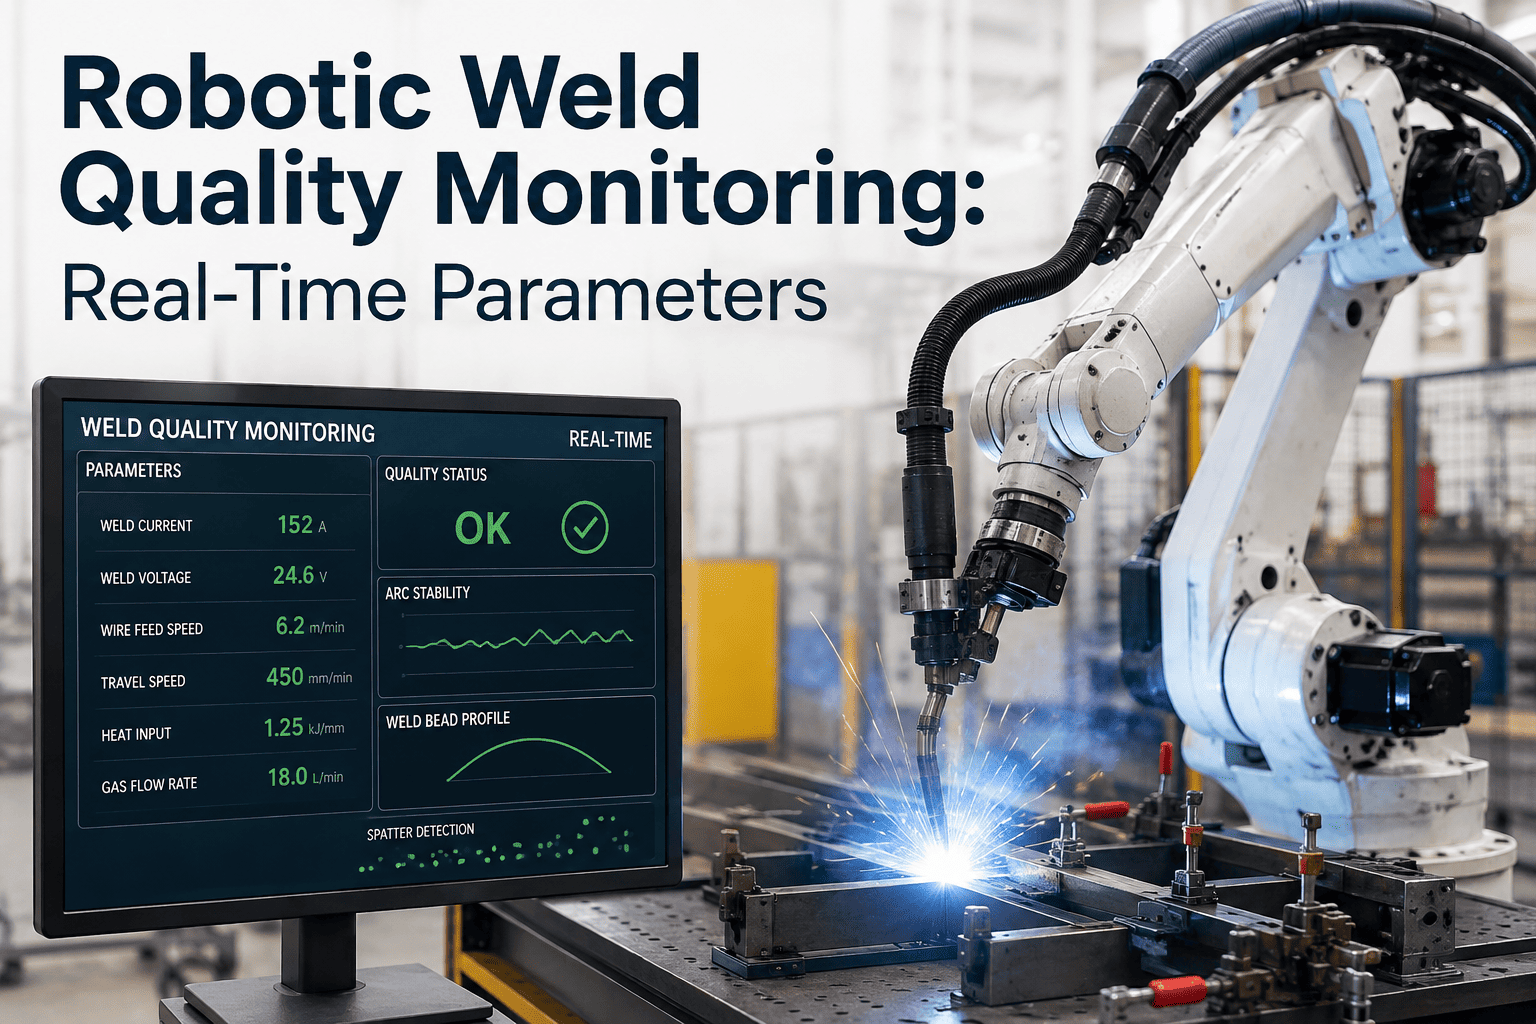
A welding robot sitting idle for twenty minutes between cycles looks identical on a shop floor walkthrough to one running at full pace, which is exactly why utilization on most automotive lines gets estimated from takt time assumptions rather than measured from what each robot is actually doing cycle by cycle. The gap between assumed and actual utilization is where most unplanned capacity loss hides, quietly, across body shop, weld, and final assembly cells that all look busy from the aisle. Our team can help you find that gap at ifactory support.
Robot Utilization for Automotive Lines
A Robot That Looks Busy and a Robot That Is Actually Producing Are Not the Same Thing
AI-based utilization tracking measures cycle time, idle time, and downtime for every welding, handling, and assembly robot on the line, turning a walkthrough impression into an actual, cell-by-cell utilization number.
3
Robot categories that need separate utilization baselines
Cycle-Level
The resolution utilization actually needs to be tracked at
Invisible
How idle time typically presents during a floor walkthrough
Why "The Line Looks Busy" Is Not a Utilization Metric
Most automotive production areas are visually loud, with motion, sparks, and motion-triggered lights giving every cell the appearance of constant activity. That visual impression is a poor substitute for actual utilization data, because a robot can complete its programmed motion path and then sit in a ready or waiting state for a meaningful portion of its cycle without that wait ever looking different from a walkthrough than active production. A weld robot waiting on an upstream part, a handling robot paused for a downstream buffer to clear, and a robot genuinely mid-cycle all look the same to a passing observer.
Utilization tracked at the cycle level solves this by separating a robot's time into distinct states, actively cycling, idle and waiting on a defined cause, and down for a fault, rather than treating "not obviously stopped" as equivalent to "producing." That distinction is what turns a vague sense that a line "seems slower than it should be" into a specific, actionable finding about which robot, which shift, and which root cause.
Three Robot Categories, Three Different Utilization Patterns
Welding Robots
Utilization is heavily influenced by weld cycle count, electrode maintenance stops, and upstream fixture load consistency, with idle time often concentrated around part changeovers.
Handling Robots
Utilization tracks closely with conveyor and buffer availability, since a handling robot is frequently waiting on either an upstream part or downstream clearance rather than its own cycle speed.
Assembly Robots
Utilization is most sensitive to fastener feed reliability and part presentation accuracy, where a minor upstream misalignment can cascade into repeated idle waits.
Utilization Metrics Compared Across Robot Types
How Utilization Actually Gets Measured
See Your Own Robot Fleet's Real Numbers
Find Out Which Robots Are Losing the Most Time to Idle Waits
Bring your current line layout and cycle data to the call. We will walk through how cycle-level utilization tracking would apply to your weld, handling, and assembly cells.
How Utilization Data Actually Turns Into a Fix
1
Log Every State Transition
Each robot's cycle, idle, and fault states are timestamped continuously, not sampled periodically.
2
Tag Idle Time by Cause
Waits are categorized as upstream starvation, downstream blockage, changeover, or unassigned, rather than lumped into one idle bucket.
3
Rank Robots by Recoverable Time
The robots with the largest addressable idle time, not just the lowest raw utilization number, are surfaced for attention first.
4
Target the Actual Cause
A fixture feed issue, a buffer sizing problem, or a maintenance need gets addressed directly instead of a generic speed-up attempt.
Common Causes of Low Robot Utilization
Upstream Starvation
A robot waits because the part it needs has not arrived yet, often tracing back to a slower or less reliable upstream station.
Downstream Blockage
A robot completes its cycle but cannot release the part because the next station or buffer is still occupied.
Changeover Delay
Time lost switching between part variants or programs, often longer in practice than the standard changeover time assumes.
Recurring Micro-Faults
Short, repeated fault stops that individually seem minor but accumulate into a significant share of lost cycle time.
Where Utilization Actually Sits Against a Realistic Benchmark
Welding Robots
Typical achievable utilization once changeover and electrode stops are optimized
Handling Robots
Heavily dependent on buffer sizing and upstream reliability
Assembly Robots
Achievable when fastener feed and part presentation issues are addressed
Curious where your own cells fall against these benchmarks? Talk to our team and we will walk through your actual data.
Four Mistakes That Keep Utilization Numbers Misleading
Measuring Utilization Only From Line Speed
Overall line rate hides which individual robot is actually the constraint versus which is simply pacing to it.
Lumping All Idle Time Into One Bucket
Without cause tagging, idle time cannot be traced back to a specific, fixable root cause.
Using a Single Fleet-Wide Utilization Target
Welding, handling, and assembly robots have structurally different achievable utilization ranges, and one target does not fit all three.
Ignoring Short Recurring Faults
Micro-stops that seem too small to matter individually often add up to more lost time than a single major failure.
Frequently Asked Questions
Why does a robot's utilization number often look better than the line's actual output?
A robot can be technically cycling correctly and still be constrained by upstream or downstream conditions that are not reflected in its own cycle time measurement, which means a robot-level utilization number can look reasonable while the overall line output tells a different story. Looking at idle time by cause, not just raw cycle completion, is what reconciles the two views.
Talk to our team about connecting robot-level and line-level data.
What counts as a fair utilization target for a welding robot versus a handling robot?
Welding robots typically have more predictable, self-contained cycles and can sustain higher utilization once changeover and electrode maintenance are optimized, while handling robots are more exposed to upstream and downstream variability outside their own control. Setting one blanket utilization target across both categories usually produces a misleading picture of which cells actually need attention.
How much utilization is typically lost to short, recurring faults that never trigger a full stoppage report?
These micro-faults are one of the most underreported sources of lost capacity precisely because each individual stop is too short to prompt a formal downtime log entry, yet the cumulative time across dozens of occurrences per shift can exceed the time lost to a single major breakdown. Continuous state logging, rather than manual downtime reporting, is what surfaces this pattern.
Book a scoping call to see this applied to your own robot fleet.
Can improving buffer sizing actually raise robot utilization without adding new equipment?
In many cases yes, since a robot waiting on downstream blockage or upstream starvation is often constrained by buffer capacity rather than its own cycle speed, and adjusting buffer sizing or sequencing can reduce that idle time without any capital investment in new robots or tooling. Identifying whether idle time is buffer-driven or genuinely cycle-limited is the first step before deciding on a fix.
Reach out to our team to review your buffer configuration against your idle time data.
Stop Estimating Utilization From a Walkthrough.
Get Cycle-Level Robot Utilization Across Your Automotive Line
Bring your current line layout and cycle time targets to the call. We will walk through how continuous state tracking would apply to your weld, handling, and assembly robots.