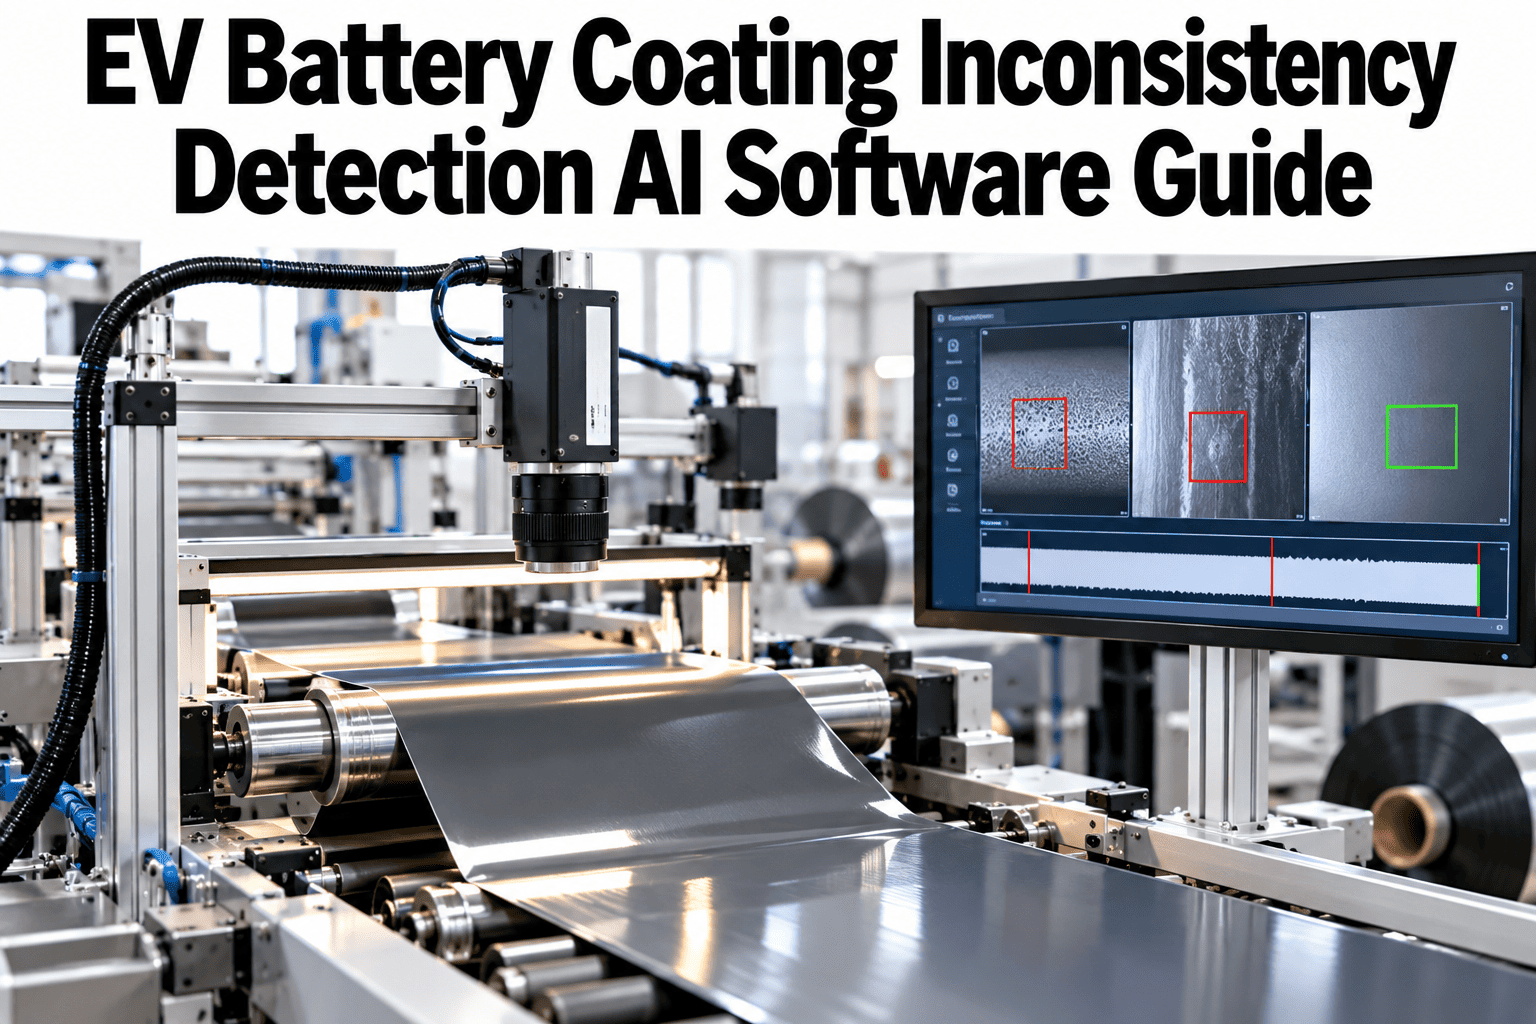
Electrode coating is where a gigafactory's quality problems either get caught early or get baked into millions of cells before anyone notices. A slot-die head running at speed lays active material onto foil in a layer measured in microns, and a shift in thickness, weight, or surface texture that looks trivial on paper can translate into capacity loss, lithium plating risk, or a safety event much later in the cell's life. Coating lines that want a clearer picture of where their thickness and weight variation actually comes from can walk through a coating uniformity review on real production data.
Catch Coating Drift Before It Becomes a Cell Defect
iFactory AI reads laser-thickness and coating-weight signals in real time, so streaks, edge build-up, and gradual drift get flagged on the line, not discovered in a failed cell.
Three Defects, One Coating Pass
Coating inconsistency rarely shows up as one clean failure mode. Three distinct problems share the same web and the same laser head, and each needs a different kind of attention.
Thickness variation
Gradual drift across the web or down its length, often from pump pressure or gap changes that creep slowly rather than jump.
Weight non-uniformity
Mass per area can vary even when thickness looks stable, usually tied to slurry density or solids content changes.
Streaking and defects
Visible lines, voids, or agglomerates from slurry contamination, die lip buildup, or bubble entrainment.
Cathode and anode coatings carry different risk profiles even though the inspection goal looks similar. Cathode slurries tend to be more sensitive to small viscosity swings because of their binder chemistry, while anode coatings are more prone to agglomerate-driven streaking from graphite particle clustering. A detection system tuned for one can miss the dominant failure mode of the other if it is not configured with that difference in mind.
Coating weight and thickness are related but not interchangeable measurements, and treating them as the same signal is a common early mistake. A roll can hold steady thickness while weight drifts because solids content in the slurry changed, which means a plant relying on thickness alone can ship a batch with the wrong active material loading despite every thickness reading looking normal.
These three failure modes rarely travel alone. A slurry that is trending toward higher viscosity often shows weight drift first, then thickness drift as the pump compensates, and only later a visible streak once the die lip starts to build up residue. Catching the first signal, rather than waiting for the visible one, is what separates an early correction from a scrapped roll.
Where Coating Variation Comes From
A composite root-cause breakdown across several coating lines, grouped by contributing factor. Bar length shows an illustrative share of flagged coating events traced to that cause.
Slurry behaviour accounts for the largest single share, which is why coating quality programs increasingly track mixing and holding tank conditions as closely as the coating head itself. A die gap adjustment can fix a symptom, but if the slurry keeps drifting, the correction has to be repeated every shift.
Mixing time, mixer blade speed, and the age of a slurry batch since it left the mixer all influence viscosity before the slurry ever reaches the coating head. Plants that log these parameters alongside coating readings can often trace a drift event back to a specific mixing batch rather than treating every coating anomaly as a coater-side problem to be solved at the die.
Seasonal and ambient conditions add a layer most coating programs underweight. Humidity and ambient temperature in the coating hall shift slurry behaviour and drying rates even when every machine setting stays the same, which is why a line that ran well in one season can start showing drift in another without any obvious process change.
Comparing Detection Approaches
Not every coating line starts from the same baseline. The right detection approach depends on what is already installed and what gap matters most.
| Approach | Coverage | Typical Limitation |
|---|---|---|
| Manual spot-check gauge | Single point, periodic | Misses streaks and edge effects between sample points |
| Fixed-point laser gauge | Continuous at one position | Blind to variation across the rest of the web width |
| Scanning or multi-point gauge | Continuous across full width | Higher cost, needs calibration discipline to stay accurate |
| Vision plus gauge fusion | Full width, thickness and surface | Requires data integration to turn readings into a single root-cause view |
The jump from a fixed-point gauge to full-width coverage is usually where plants see the biggest improvement in catch rate, because most coating problems are not centred on the web; they start at an edge or in a specific lane and spread from there.
Retrofitting existing lines with full-width coverage is often more practical than it first appears. Many coating lines already have gauge mounting rails and camera brackets installed from earlier equipment generations, which means the upgrade is frequently a matter of adding sensing hardware and tying its output into a shared analytics layer rather than rebuilding the coating station itself.
The choice between retrofitting an existing gauge array and fusing it with a separate vision system usually comes down to what the line is currently missing most. A line with good thickness coverage but no surface visibility benefits most from adding a camera layer, while a line with a vision system but only spot-check thickness gauging benefits most from scanning or multi-point gauge coverage.
See Your Own Coating Drift, Traced to Its Cause
Book a 30-minute session and iFactory AI will map thickness, weight, and defect trends against your slurry and line parameters.
Why Downstream Detection Is Too Late
Coating defects that survive inspection do not disappear. They move forward into calendering, slitting, and cell assembly, where the cost of catching them climbs at each step. Lines evaluating their own exposure can compare in-line and end-of-line detection economics for their own process.
The cost multiplier is not just about labour and material added at each step. A cell that fails formation testing because of a coating-related capacity shortfall also consumes formation cycle time, which is itself a constrained resource on most gigafactory floors. Scrapping a cell late does not just waste that cell; it displaces a good cell that could have used the same formation slot.
There is also a traceability cost that rarely makes it into a simple scrap calculation. When a defect is found at formation or in field returns, tracing it back to a coating roll, a slurry batch, and a time window can take days without roll-level data, and during that window every cell made from the same suspect batch is a question mark rather than a known-good or known-bad part.
A Composite Batch: Scrap Rate Before and After In-Line Detection
Twenty coating batches compared on defect escape rate before and after laser-thickness and vision-based streak detection were added inline. Each cell represents one batch, illustrative data.
The shift came almost entirely from catching drift earlier in its trajectory rather than waiting for it to cross a hard reject threshold. A thickness reading trending steadily for ten minutes is a very different signal than one that has already gone out of specification.
What In-Line Detection Actually Measures
Coating inspection is not one sensor. It is a combination of technologies, each covering a different failure mode across the full web width.
| Technology | What It Measures | Catches |
|---|---|---|
| Laser thickness gauge | Coating thickness across web width, continuously | Gradual drift, edge build-up, gap-related variation |
| Beta or X-ray gauge | Coating weight per unit area | Density and solids-content related variation |
| Line-scan camera | Surface texture and visible defects | Streaks, voids, agglomerates, foreign material |
| Infrared profiling | Drying oven temperature uniformity | Uneven drying that affects final thickness and adhesion |
| Tension and speed sensors | Web handling conditions | Mechanical sources of thickness variation unrelated to slurry |
Five Practices That Reduce Coating Variation
Most gains come from tightening a handful of upstream variables rather than chasing every reading at the coating head itself.
Slurry viscosity monitoring
Continuous viscosity tracking in the holding tank catches drift before it reaches the die.
Closed-loop gap control
Feeding thickness readings back into die gap adjustment keeps corrections continuous rather than manual and delayed.
Tension stabilisation
Consistent web tension removes a mechanical source of thickness variation that is easy to mistake for a slurry issue.
Oven zone balancing
Matching drying zone temperatures to actual coating weight prevents under or over-dried sections across the web.
Die lip cleaning schedule
A fixed cleaning interval tied to streak-detection trends, rather than a calendar guess, reduces buildup-driven defects.
None of these five practices work well in isolation. A plant that tightens viscosity control but leaves tension uncontrolled will still see thickness variation, just with a different signature. The value of combining them comes from removing one variable at a time from the list of possible causes, so that when a reading does drift, there are fewer places left to look.
Building a Case for In-Line Detection
Coating inspection upgrades compete for capital against many other gigafactory priorities, so the case usually needs to connect catch-rate improvement to a cost a plant already tracks.
Scrap and rework cost
Compare current electrode scrap cost against the lower rework cost of catching defects at the coater instead of downstream.
Formation capacity recovered
Fewer cells failing formation due to coating issues frees formation cycle time for good cells.
Field-quality risk reduction
Tighter coating control lowers the chance of a coating-related issue reaching a shipped pack, where the cost and reputational impact are highest.
Signals Worth Watching
A short list of readings tells a process engineer when coating quality is starting to drift, often well before a reject threshold is crossed.
Find Out Where Your Coating Line Loses Uniformity
A short session with iFactory AI on your own coating data shows exactly where thickness and weight drift begins.
Where iFactory AI Fits
iFactory AI joins laser-thickness, beta-gauge, and vision data from the coating line into one continuous picture, by roll, by batch, and by slurry lot.
Full-Web Drift Detection
Thickness and weight profiles are tracked across the full web width, not just at a sampled point.
Early-Trend Alerts
Gradual drift is flagged before it crosses a hard reject threshold, giving operators time to correct.
Slurry Lot Traceability
Coating events are linked back to the slurry lot and mixing parameters that produced them.
Roll-Level Quality Record
Every roll carries a quality record that follows it into slitting, winding, and cell assembly.
Getting Teams Aligned Around a Shared View
Coating quality decisions usually touch process engineering, quality, and production teams at once, and each tends to look at a different slice of the same data.
Process engineers care most about the trend leading up to an event, because that is where a correctable cause usually sits. Quality teams care most about which rolls and batches are affected, because that drives disposition and traceability. Production leads care most about whether a line needs to slow down or stop, because that drives schedule. A shared, roll-level data view lets all three answer their own question from the same source instead of reconciling three separate reports after the fact.
This shared view also changes how corrective actions get closed out. Instead of a general note that "coating was adjusted," a roll-level record shows the specific reading that triggered the adjustment, the parameter that was changed, and the readings that followed, which makes it possible to confirm a fix actually worked rather than assuming it did because the next few rolls looked fine.
Frequently Asked Questions
Can in-line detection replace end-of-line sampling entirely?
Most plants keep a reduced sampling program even after in-line detection goes live, since periodic physical measurement remains useful for calibration and for defect types that are hard to see optically. The in-line system mainly shifts the role of sampling from primary detection to verification, letting lab technicians focus their time on the batches and readings the in-line system actually flags as unusual. Support can outline a typical sampling plan alongside in-line coverage.
How fast does a thickness alert reach the operator?
Alerting speed depends on gauge sampling rate and line speed, but most in-line thickness systems flag a sustained trend within seconds to a few minutes of it starting, well before a roll reaches its end. The goal is to give enough lead time for a gap or viscosity correction before product moves out of specification.
Does this integrate with our existing MES and batch records?
Yes. Coating events, roll identifiers, and slurry lot numbers are matched against existing MES and batch management records so quality data stays traceable end to end. A short walkthrough can show how this maps to your current MES and batch tracking setup.
What data do we need to get started?
Thickness and weight gauge feeds, line-scan camera output where available, and slurry batch records form the core. Tension, speed, and oven zone data add depth but are not required to start. Most gigafactory lines already generate this data in some form; the first weeks of a rollout focus on matching it cleanly by roll identifier and timestamp so coating events line up with the right batch.
Can this detect contamination as well as thickness drift?
Vision-based streak and defect detection can flag visible contamination and agglomerates on the coated surface, though dedicated particle and cleanroom monitoring is a separate layer for contamination that originates upstream of the coater. Ask support how coating and contamination detection work together on a combined line.
Keep Coating Drift Out of Your Finished Cells
iFactory AI turns thickness, weight, and surface data into early warnings that keep electrode quality consistent roll after roll. Book a walkthrough on your own coating line.