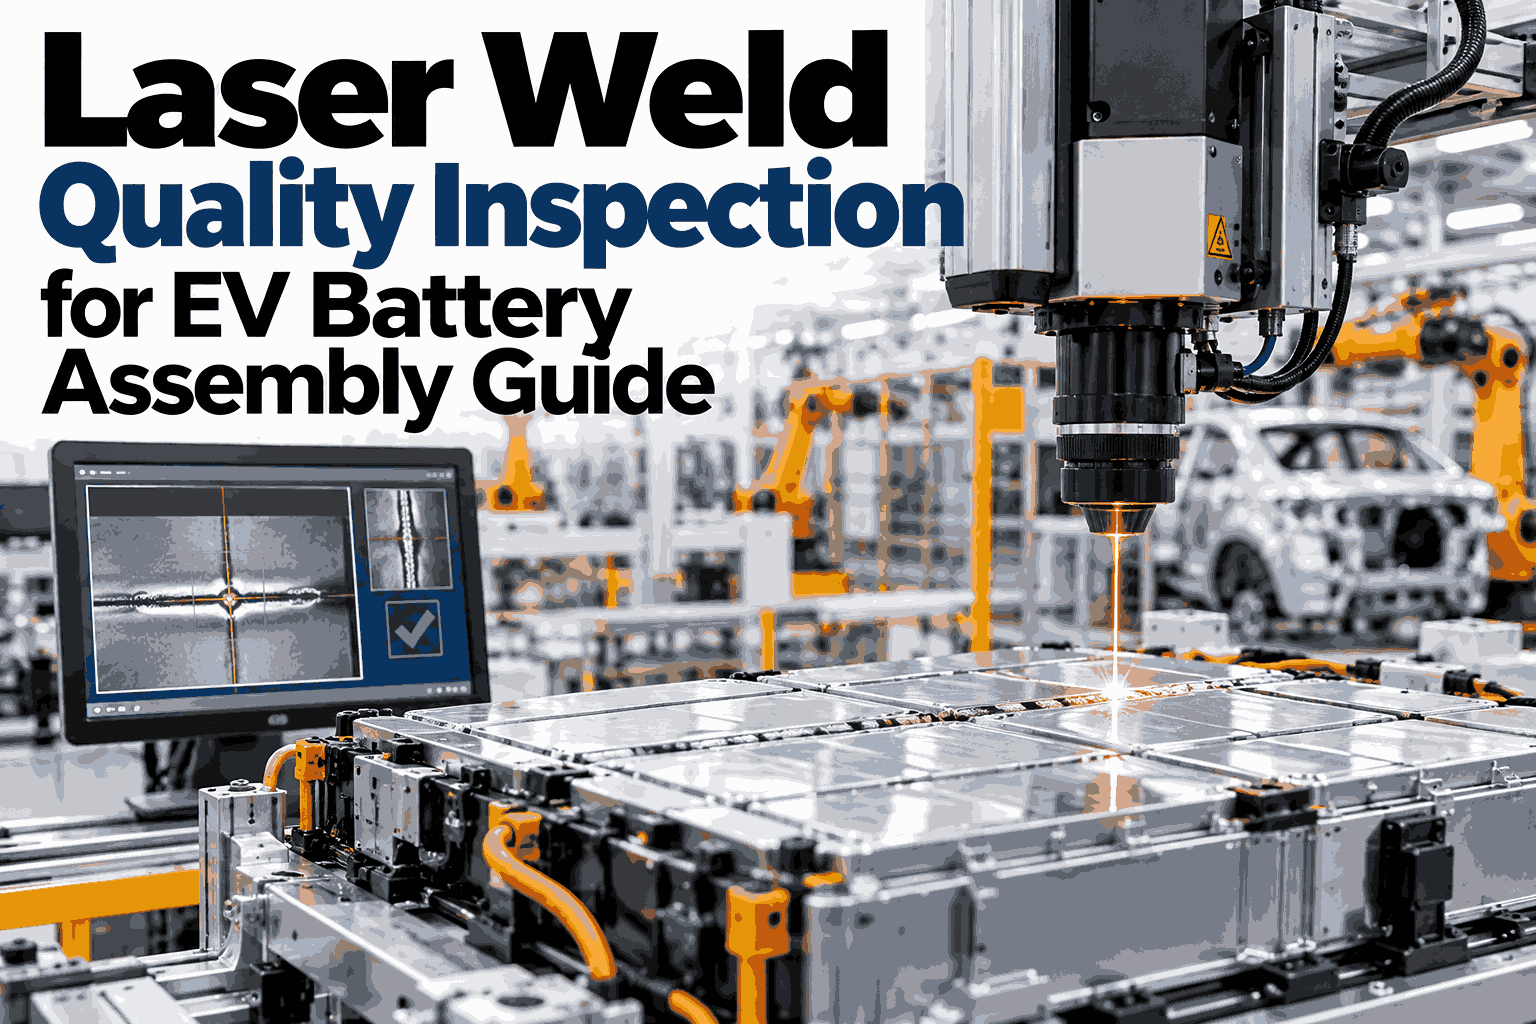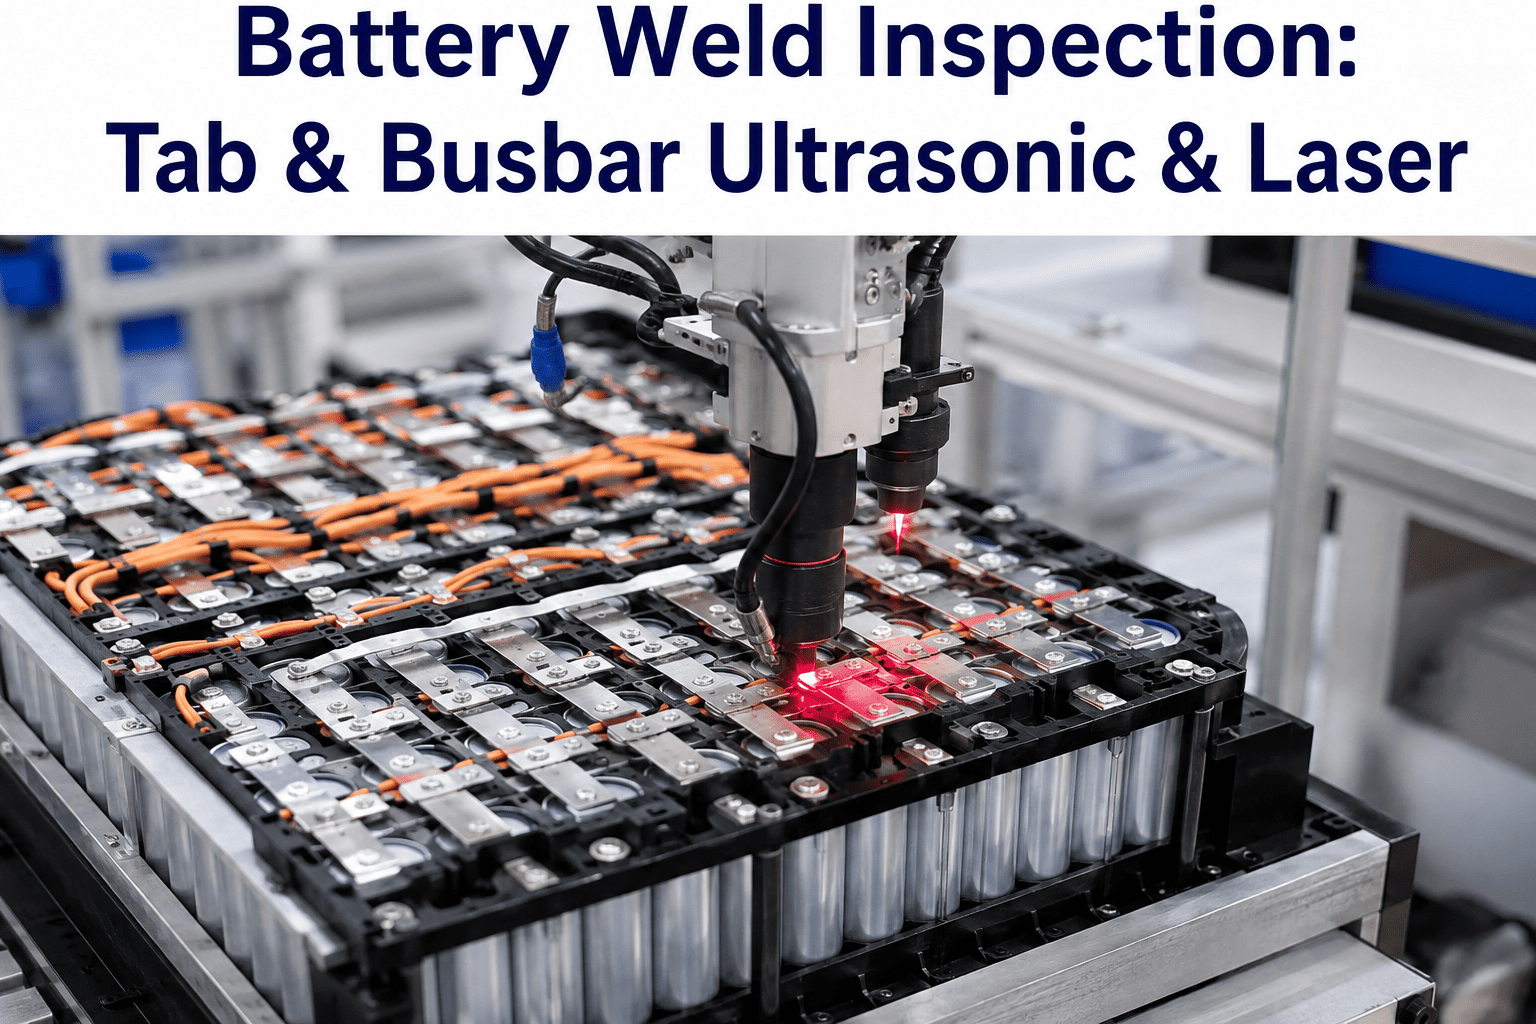
A battery pack can contain thousands of welds, and every one of them carries current and heat for the life of the vehicle. A weak tab weld raises resistance, a burn-through can damage a cell and a busbar weld with poor fusion can fail long after the car has left the factory. Destructive pull tests sample only a tiny share of joints, and electrical end-of-line checks find a bad weld only after the pack is built. Vision AI changes the timing by classifying each weld as it is made, so defects are caught while the part can still be fixed. Pack assembly teams that want to see this on their own weld data can watch weld classification run on real seam images in a short session.
Classify Every Weld the Moment It Is Made
iFactory AI reads weld pool signals and seam images across tab and busbar welds, flagging weak or damaged joints before the pack moves on.
What a Good Joint Looks Like in Cross-Section
A tab weld joins layers of different thickness and material. The weld must fuse through the tab into the terminal without breaching it. The sketches show the three outcomes inspection has to tell apart.
Defects Worth Detecting
Different defects come from different causes, and the cause decides the fix. The table lists the common ones.
| Defect | What It Looks Like | Usual Cause | Risk |
|---|---|---|---|
| Porosity | Voids in or on the weld | Contamination, shielding or material issues | Weaker joint, higher resistance |
| Spatter | Droplets around the weld | Unstable melt pool, dirty optics | Particles near cells and busbars |
| Lack of fusion | Seam that has not joined | Low power, gap or misalignment | Loose joint, heating in use |
| Burn-through | Hole through the stack | Excess energy, thin material | Damaged terminal or cell |
| Misaligned seam | Weld off the intended line | Fixture or tab position error | Reduced joint area |
| Cracks | Fine lines in the weld | Rapid cooling, material mix | Failure under vibration |
See Weld Defects Classified on Your Own Seams
Book a 30-minute session and iFactory AI will classify tab and busbar welds from your own images and process signals.
Three Places to Look, Each With a Blind Spot
No single check sees everything. The strongest setups combine all three and let AI correlate them.
Melt Pool Signals
Coaxial imaging and photodiodes read pool shape and plasma light. Sees instability early, but cannot see the final bead.
Seam Vision and 3D Height
Images and height maps check width, position and surface defects. Cannot see inside the joint.
Electrical Resistance
Measures the joint's real electrical quality. Catches problems late, after the pack is built.
Catching Drift Before the Limit
A weld process rarely fails suddenly. The distribution of a measure such as seam width creeps toward a limit. The columns show an illustrative distribution with specification limits, and you can see drift flagged before a limit is crossed in a live session.
Pass, Review or Fail
A weld decision has three outcomes, not two. A review lane keeps the line moving without letting doubtful welds through.
Traceability Down to the Weld
Each result should be tied to a cell, a module and a pack serial, so an issue found later can be traced back. The map shows an illustrative module with one flagged for review and one failed.
A Composite Scenario: Spatter Rising Before Anyone Saw It
A welding station showed more spatter each hour. The columns show illustrative spatter counts per hundred welds, with a maintenance action on the eighth interval.
Where iFactory AI Fits
Sensors, vision systems and test stands each hold part of the picture. iFactory AI brings them together for every weld.
Weld Classification
Pool signals and seam images are classified as pass, review or fail.
Drift Alerts
Trends in width, position and spatter are flagged before limits are crossed.
Resistance Correlation
In-process signals are linked to end-of-line resistance results to tune the models.
Serial-Level Traceability
Every weld result is stored against cell, module and pack serial numbers.
Frequently Asked Questions
Does AI replace destructive pull testing?
Not entirely. Destructive tests remain the reference for joint strength, and they are used to validate and calibrate the AI models. What changes is coverage. Instead of testing a small sample, every weld is classified in line. iFactory AI's team can help design a validation plan that links in-line results to your pull and resistance tests.
Which sensors do we need?
It depends on the weld process and what the line already has. Many laser stations already carry coaxial sensors or cameras, and post-weld vision is common. The first step is to see what signals exist and how well they separate good welds from bad ones. Extra sensors are added only where a clear detection gap shows up in the data.
How do we avoid rejecting good welds?
By using a review lane and by tuning thresholds against real outcomes. A borderline weld goes to a second check instead of straight to scrap, and the result feeds back into the model. False rejects are tracked as closely as escapes. See how review decisions are fed back in a short walkthrough on your own weld data.
Can the models handle new cell formats or materials?
Yes, with retraining. A new format, a new tab material or a new laser recipe changes the signals, so the classifier needs examples from the new process. Starting with a small validated set and expanding as production ramps is usual. Keeping a labelled library of past welds shortens each new launch, since earlier knowledge can be reused as a starting point.
How does weld data connect to the rest of pack quality?
Results are stored by serial number, so they can be compared with cell data, module tests and end-of-line results. That makes it possible to spot patterns, such as a cell lot that welds poorly. Ask support how weld data joins your traceability system and what fields are stored.
Make Every Pack Weld a Recorded, Classified Decision
iFactory AI classifies tab and busbar welds in line and ties each result to a serial number. Book a walkthrough to see it on your own weld data.