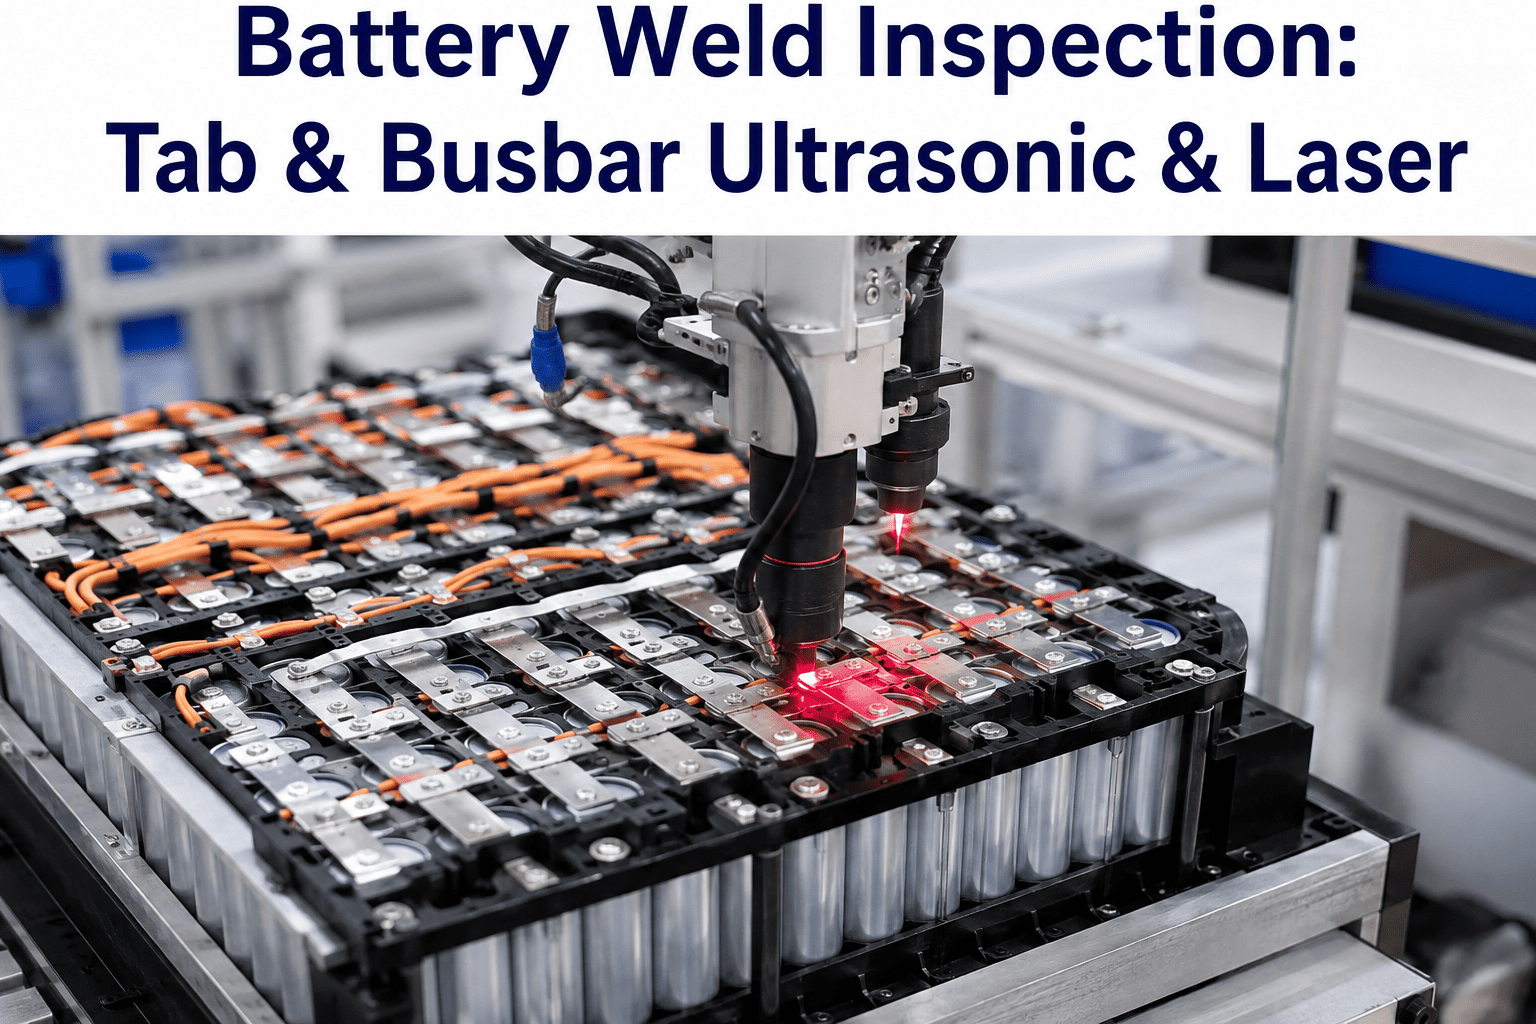
Inside an EV battery pack, a laser weld lasts only a few milliseconds, yet the joint it creates must carry current and survive vibration, heat and thermal cycling for the life of the vehicle. A seam that looks clean can still hide a pore, a thin fusion zone or a slow drift that only shows up months later as resistance or a field failure. Quality teams are therefore moving inspection into the weld itself, reading the light, plasma and pool shape as the metal melts. To test that idea against your own busbar and cell-tab joints, line up a working session on your live weld footage with iFactory.
P1 · AUTOMOTIVE WELD QUALITY PREDICTION AND INSPECTION
Laser Weld Quality Inspection for EV Battery Assembly Guide
Read every pack weld as it forms, using high-speed imaging, plasma monitoring and pool geometry analytics, then decide pass, rework or quarantine before the module moves on.
Camera
Plasma
Pool Shape
Weld Score
A WELD IN MILLISECONDS
The Four Moments That Decide Whether a Joint Is Good
Every laser weld passes through the same short sequence, and each moment fails in its own way, which is why one snapshot is never enough.
Ignition
The beam meets the surface. Reflective copper and aluminum can absorb energy unevenly, causing weak starts.
Keyhole Opens
Vapor pressure carves a channel. An unstable keyhole is the main source of spatter and porosity.
Steady Travel
The beam moves along the seam. Gaps, contamination and focus drift show up as width and depth changes.
Closure
The pool freezes. Rapid cooling can trap gas or leave craters and cracks at the end of the seam.
CAUSE TO CONSEQUENCE
How a Small Process Change Becomes a Pack Problem
Root Cause
Weld Symptom
Signal Clue
Pack Risk
Dirty or oily tab surface
Porosity in the seam
Plasma intensity spikes
Higher joint resistance
Gap between busbar and tab
Underfill or lack of fusion
Narrow, short melt pool
Weak mechanical bond
Focus position drift
Width variation along seam
Pool width trending away
Uneven current path
Excess energy on thin foil
Burn-through
Sudden plasma surge, bright pool
Cell damage or leak path
Trace your weld problems back to the process
iFactory can map the causes above onto your own weld footage, showing which signals would have warned you first.
SIGNATURE READING
What Healthy and Unstable Plasma Signals Look Like
Plasma emission is a pulse of light that follows the keyhole, so its shape over time reveals stability without touching the part.
Stable Weld
Narrow, even variation across the seam.
Unstable Keyhole
Wide swings often point to spatter and porosity.
Bars are illustrative and not measured production data.
POOL GEOMETRY ANALYTICS
Tolerance Bands That Turn Pool Shape Into a Verdict
Camera frames are converted into pool length and width, then compared with the band your engineers approve for that joint.
Pool width
Too narrow
Approved band
Too wide
Pool length
Too short
Approved band
Too long
Seam offset
Left drift
Centered
Right drift
SCORE TO ACTION
Turning a Weld Score Into a Clear Disposition
| Score Band | Meaning | Line Action | Record Kept |
|---|
| High confidence | Signals match known good welds | Pass to next station | Score and signal archive |
| Watch | Drift detected, joint still within band | Alert process engineer | Trend flag on station |
| Suspect | One or more signals outside band | Route to targeted inspection | Defect class and images |
| Reject | Clear defect signature present | Quarantine or rework | Disposition and approver |
OEM EVIDENCE PACK
Six Records to Have Ready for PPAP and Customer Audits
A
Process Window
Approved laser power, speed and focus ranges per joint.
B
Model Validation
Detection results against cross-section and pull-test data.
C
Weld-Level Trace
Pack serial, module, station and weld position linked.
D
Signal Archive
Stored camera and plasma data for each joint.
E
Disposition Log
Every pass, rework and quarantine with timestamps.
F
Change Control
Records of parameter and model updates over time.
ROLLOUT PLAN
How a Battery Line Goes Live With iFactory
Weeks 1-2
Connect and Baseline
Link laser controllers and monitoring heads
Import past weld data and test results
Confirm data quality per station
Weeks 3-6
Train and Calibrate
Train models per joint and material
Set tolerance bands with your engineers
Run in shadow mode beside current checks
Weeks 7-10
Go Live and Tune
Turn on alerts and dispositions
Train operators and quality staff
Review drift and false alarms weekly
FREQUENTLY ASKED QUESTIONS
Answers Battery Quality Teams Look For
Does inline monitoring slow the welding cycle?
Signals are read while the weld forms, so no separate inspection station or extra handling is needed. Processing time depends on sensor rate and compute placement, which is planned at integration.
Request a cycle-time check against your takt to confirm.
Can it work with monitoring already in our laser heads?
How are false alarms kept under control?
Shadow mode runs the model beside your existing checks so thresholds are tuned on real results before alerts go live. Weekly reviews then refine the bands as conditions change.
Ask how a shadow-mode trial would be scoped for your line.
Does it support different cell formats and chemistries?
Each format, tab material and joint design is modeled separately because reflectivity and thickness change the signals. New formats are added through fresh calibration data rather than a rebuild.
Talk to our technical team about your cell mix to plan coverage.
What records will an OEM auditor see?
Each weld carries its score, defect class, disposition and linked serial, with signal data stored for review. Model versions and parameter changes are logged under change control.
See a sample audit trail for a battery module during a session.
EVERY JOINT READ, EVERY DECISION LOGGED
Keep EV Pack Weld Quality Above Spec, Weld After Weld
Give your battery line an in-process view of weld health that supports operators today and OEM audits tomorrow.