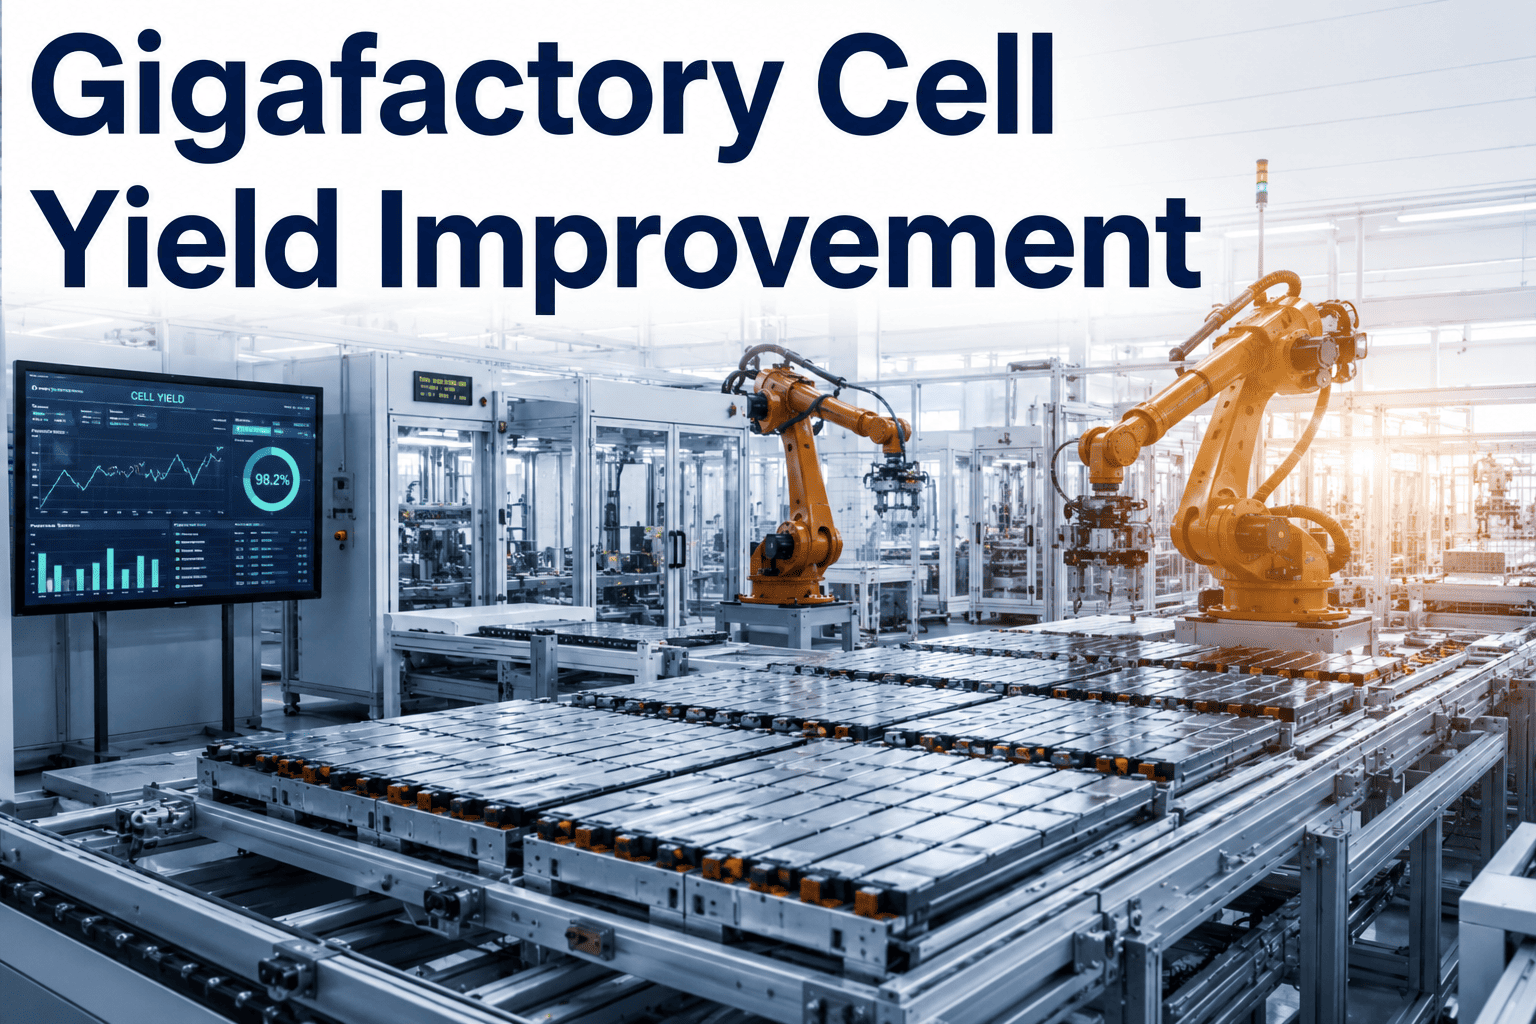
New gigafactories routinely open with scrap rates between 15 and 30 percent, and it is not unusual for that number to still sit near 10 percent five years into operation. Every single point of scrap on a large-scale cell line translates into real daily cost, which means a plant stuck at 70 percent yield when it needs 90 percent to break even is not facing a quality problem so much as a survival problem. The frustrating part is that the root causes are rarely mysterious — they are buried in coating thickness drift, electrode alignment, and formation data that never gets connected across the process chain. Closing that gap faster is the difference between a ramp that protects investor confidence and one that erodes it. Manufacturing teams working with iFactory's yield analytics platform are shortening that ramp by linking process data that used to live in separate systems.
70–80%
Yield needed to move a pilot line into production viability
90%+
Yield most gigafactories need to reach breakeven economics
9x
Roughly how much more expensive a line at 10% yield runs versus one at 90%
The Yield Funnel: Where Cells Actually Get Lost
Cell yield is not lost at one station — it leaks out gradually across the entire process chain, from electrode coating through calendering, stacking or winding, and finally formation and aging. Most plants can tell you their final yield number, but far fewer can tell you which stage is actually driving the loss, which is exactly the visibility gap that keeps ramp timelines stretching longer than planned.
Coating & Calendering100%
Stacking / Winding~88%
Cell Assembly & Fill~80%
Formation & Aging~72%
Illustrative yield attrition pattern across a typical early-ramp cell line. The largest single drop is often invisible until formation data is linked back to upstream coating parameters.
Gigafactory Yield Acceleration
Turn Formation Data Into an Early Warning for Coating Drift
Most yield loss traces back to variation that started stations earlier. See how connected process data shortens the path from pilot to break-even yield.
Why Ramp-Up Yield Loss Is So Expensive
A reject rate that looks manageable on a spreadsheet becomes brutal once it is priced against a 40 gigawatt-hour facility running around the clock. Every percentage point of scrap carries a daily cost, and because scrap tends to cluster around specific process drift events rather than spreading evenly, a single unresolved root cause can be responsible for a disproportionate share of the loss.
Siloed Process Data
Coating, calendering, and formation systems each hold their own data with no shared view linking a defect back to its origin.
Delayed Defect Detection
Formation testing happens days after coating, so by the time a defect surfaces, dozens of batches have already run the same way.
Manual Root-Cause Analysis
Engineers manually cross-reference spreadsheets across stations, a process that can take weeks per investigation.
New Line, New Variation
Every new line or shift introduces its own drift pattern, so lessons from one line rarely transfer automatically to the next.
Linking the Process Chain: Coating to Formation
The single highest-leverage move in yield improvement is connecting formation test results — where defects finally become visible — back to the upstream process parameters that were running at the time each cell was made. That link is what turns a formation failure from a mystery into a traceable, correctable process event.
1
Capture
Coating thickness, calendering pressure, and electrode alignment data logged continuously per cell
2
Correlate
Formation and aging results matched back to the exact process conditions each cell experienced upstream
3
Flag
AI identifies the process signature most correlated with scrap before it repeats across additional batches
4
Correct
Engineers get a ranked list of likely root causes instead of starting root-cause analysis from a blank page
Want to see how this correlation model would run against your own coating and formation data? Talk to our team before your next ramp milestone.
Typical Yield Benchmarks Across the Ramp
| Production Stage | Typical Yield Range | Primary Loss Drivers |
|---|
| R&D / coin cell | ~50% | Manual builds, expected variation |
| Pilot line | 70–80% | Process parameter tuning, equipment settling |
| Early gigafactory ramp | 60–85% | Coating drift, alignment, formation fallout |
| Mature gigafactory line | 90%+ | Residual, well-characterized variation |
What Faster Root-Cause Resolution Looks Like in Practice
Plants that connect their process chain data typically see the biggest change not in any single yield number, but in how quickly an engineering team can move from "yield dropped" to "here is why and here is the fix." That speed is what actually shortens a ramp timeline, because each resolved root cause compounds across every batch produced afterward.
Faster
Root-cause identification versus manual cross-referencing
Earlier
Detection of coating drift before formation fallout compounds
Shorter
Time from pilot yield to break-even gigafactory yield
Common Pitfalls That Stall a Yield Improvement Program
01
Optimizing One Station at a Time
Fixing coating in isolation without checking downstream formation impact can shift the problem instead of solving it.
02
Treating Scrap as a Fixed Cost
Budgeting for a flat scrap rate instead of actively driving it down slows the entire ramp economics.
03
No Cross-Line Learning
Each new line rediscovering the same drift patterns wastes months that connected data could have avoided.
04
Underinvesting in Formation Data
Formation is where defects surface, yet it is often the least instrumented and most siloed stage in the chain.
Frequently Asked Questions
How quickly can a new gigafactory line expect to reach 90% yield?
It varies significantly by chemistry and process type, with dry electrode lines often taking longer to reach high yield than mature wet coating processes, but the common thread across fast ramps is early visibility into which stage is actually driving loss. Plants that wait for scrap trends to become obvious in monthly reports consistently ramp slower than those tracking correlation in near real time.
Our team can help benchmark against your specific line type.
Is yield loss usually concentrated in one process step?
Often yes, though which step varies by facility and chemistry — coating thickness variation and electrode alignment are common early-ramp culprits, while formation-stage fallout tends to reveal problems that started upstream days earlier. The value of connected process data is precisely in identifying which step matters most for your line, rather than assuming it matches another facility's experience.
Does improving yield require new production equipment?
Not typically in the early stages. Most yield improvement in a ramp comes from better use of the data equipment already generates — connecting it across stations and surfacing correlations that engineers cannot practically find by hand. Equipment changes tend to become relevant later, once the data has narrowed down exactly which parameter needs tighter control.
How is scrap cost typically calculated for a business case?
The clearest method ties each percentage point of scrap to the facility's daily production value at full capacity, since that framing is what makes the cost of delay concrete for both engineering and finance stakeholders. From there, a ramp timeline shortened by even a few weeks translates directly into avoided scrap cost across the remaining ramp period.
What's the right way to start a yield improvement initiative?
Start by mapping which systems currently hold coating, calendering, stacking, and formation data, and whether any of them are already linked by cell or batch ID — that inventory reveals how much of the correlation work can begin immediately versus what needs new instrumentation.
Book a demo to see how that mapping process typically runs.
Every Week of Slow Ramp Has a Real Dollar Cost.
Connect Your Process Chain and Find the Real Yield Bottleneck
Bring your current yield curve and process data map. We'll show where the correlation gaps are and what a connected view could reveal about your fastest path to break-even yield.






.png)