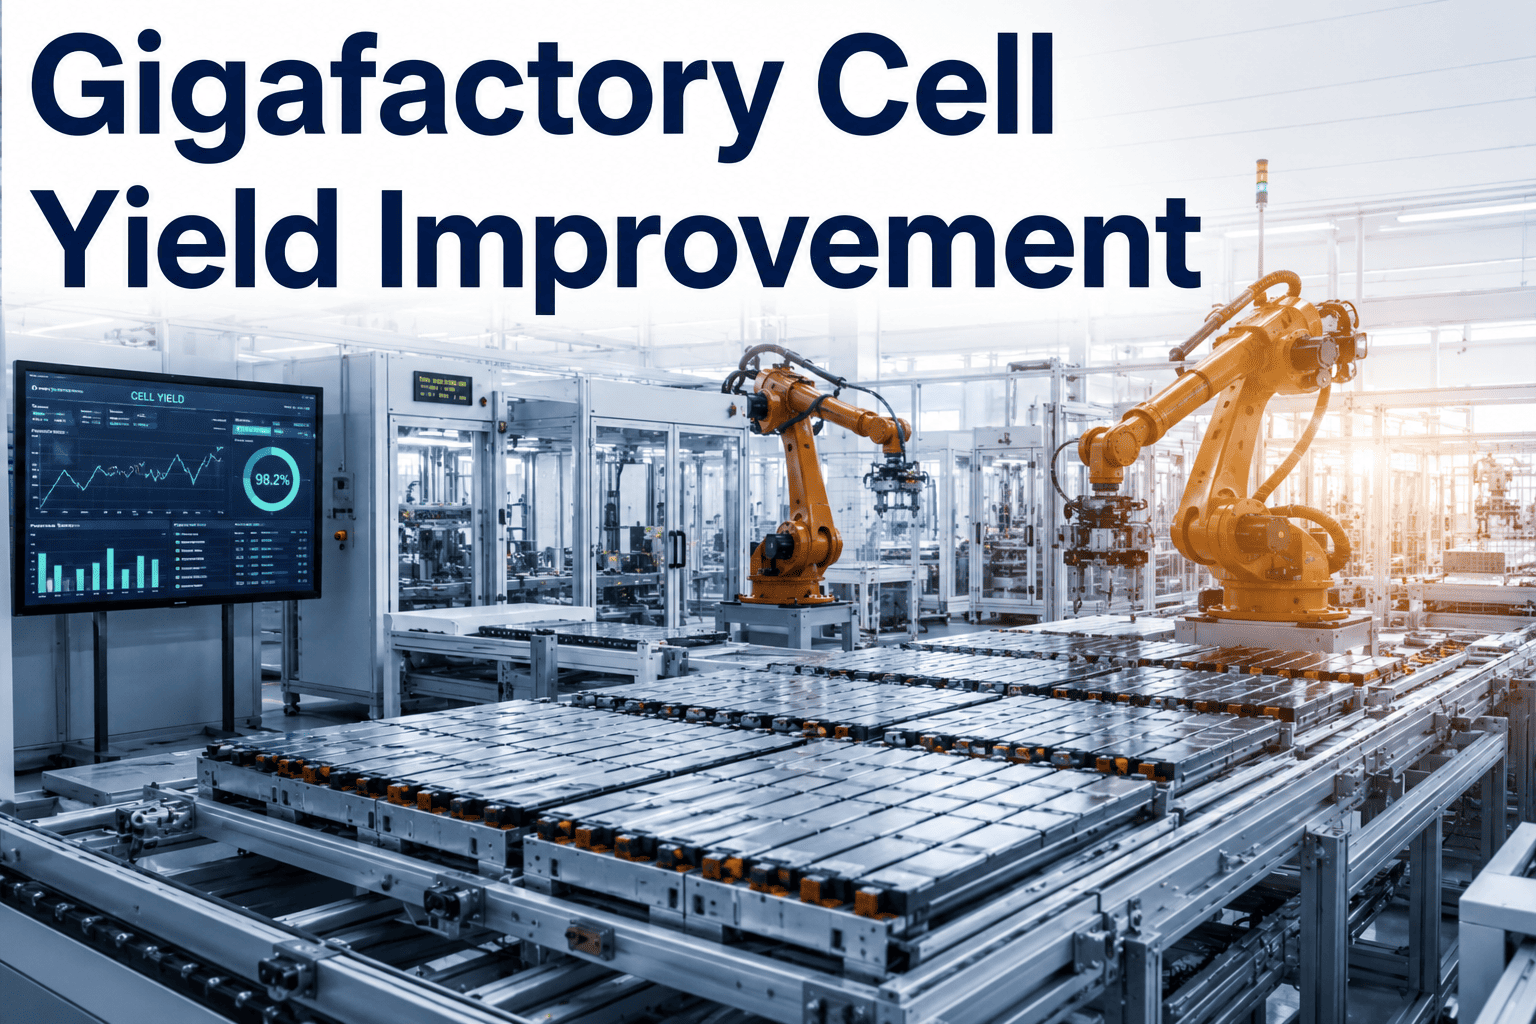
Start of production is supposed to be the finish line for a gigafactory build, but industry data consistently shows it's actually where the hardest phase begins. Scrap rates of fifteen to thirty percent are common in the first years of battery cell production, and even five years in, reject rates often still sit around ten percent, with every single percentage point translating into real daily cost once a line is running at scale. The gap between naming a capacity target on an investor slide and actually hitting it on the floor is where most gigafactory timelines quietly slip. iFactory's gigafactory ramp platform was built to compress that gap using live yield and equipment data instead of a static ramp plan built months before the first cell rolled off the line.
Turn your ramp curve from a guess into a plan
iFactory models capacity, equipment readiness, and yield trajectory together, giving operations leadership a live view of what it will actually take to reach full production, and where the plan needs to change now.
Every gigafactory follows the same shape, only the slope changes
Plot yield against time from start of production and nearly every gigafactory in the world traces a version of the same curve: a rough start, a long climb through instability, and an eventual approach to design capacity that usually takes far longer than the original plan assumed. What separates the factories that reach full production on schedule from the ones that slip two or three years isn't luck, it's how fast they can see which specific process step is holding the curve back and fix it before it compounds.
Month 1–3
Month 4–9
Month 10–15
Month 16–18+
Six recurring causes behind every slipped timeline
Process and product uncertainty
Cell chemistry, format, or design changes late in the build introduce process variables the original line design never accounted for.
Skilled workforce shortage
Battery manufacturing experience remains scarce industry-wide, and new hires need real production cycles to build the judgment automated systems can't fully replace.
Equipment commissioning delays
Coating, calendaring, and formation equipment often arrives later or less ready than the master schedule assumed, cascading into every downstream step.
Fragmented yield data
Without a unified view across electrode, cell assembly, and formation stages, root-causing a scrap spike can take weeks instead of days.
Supplier integration gaps
Incoming material variability from new suppliers introduces defects that don't surface until formation, far downstream of where they originated.
Reactive, not predictive, planning
Ramp plans built once at project kickoff rarely get revised fast enough to reflect what the floor is actually showing week to week.
Capital intensity has made ramp speed a survival metric
A one percentage point improvement in yield at a gigafactory running near full capacity is worth tens of millions of dollars annually, and a thirty percent scrap rate at full capacity can mean roughly a million dollars a day in wasted material and energy. With EV demand signals shifting and financing conditions tighter than they were a few years ago, the factories that can demonstrate a credible, fast path from SOP to full utilization are the ones best positioned to secure the next round of capital or the next offtake agreement. A ramp plan that slips quietly for eighteen months without anyone catching the specific bottleneck early is no longer a survivable pattern for most projects.
The workforce dimension compounds this further. There simply isn't a deep bench of engineers with years of gigafactory ramp experience to hire from, which means every plant is largely training its own team in real time. A system that surfaces which process step is actually limiting yield, rather than requiring a veteran engineer's intuition to spot it, shortens the learning curve for a newer team dramatically.
From electrode line to formation, one connected yield model
Unify process data
Electrode coating, calendaring, cell assembly, and formation data are connected into one model instead of separate station-level systems.
Trace scrap to root cause
Defects found downstream at formation are traced back through the process to the upstream step and parameter that most likely caused them.
Model the ramp forward
Current trend data projects a realistic timeline to target yield and capacity, updated continuously rather than fixed at project kickoff.
Prioritize the next fix
Engineers get a ranked list of which process change would move the yield curve most, instead of chasing every anomaly equally.
Most ramp plans are built once and rarely revisited. Book a demo and we'll show what a live ramp model looks like against your own SOP data.
What gigafactories recover during ramp
What a pilot looks like
Works alongside your MES
Connects to existing manufacturing execution and equipment data rather than replacing your current systems.
Covers the full cell production chain
From electrode coating through formation and end-of-line testing in one connected model.
Eight to twelve week pilot
Includes historical yield data calibration and a documented ramp acceleration report.
On-premise, no cloud dependency
Runs on an NVIDIA appliance inside your plant network, keeping production yield data on site.
Line-by-line rollout
Start with your highest-priority cell format or line and expand coverage as the model proves out.
24x7 managed service
iFactory's team monitors ramp trends so your process engineers can focus on fixes, not dashboards.
Why ramp acceleration is worth prioritizing before SOP
The best time to deploy a ramp acceleration model is before start of production, since establishing the data connections and baseline expectations early means the model is already learning from day one instead of being retrofitted onto a factory already deep into ramp chaos. Plants that wait until yield problems become visible to leadership often lose months of ramp time that a connected model could have shortened from the very first cell produced.
That said, a gigafactory already mid-ramp benefits just as much, sometimes more, because there's already a rich dataset of scrap and yield history to calibrate against immediately. Many operations teams use a successful ramp pilot on one line as the proof point for extending the same connected yield model across every additional line the site brings online.
Gigafactory ramp AI, explained plainly
See what's actually holding your ramp curve back
iFactory connects your process data into one live yield model so engineers fix the bottleneck that matters most. Book a demo and see it against your own SOP data.