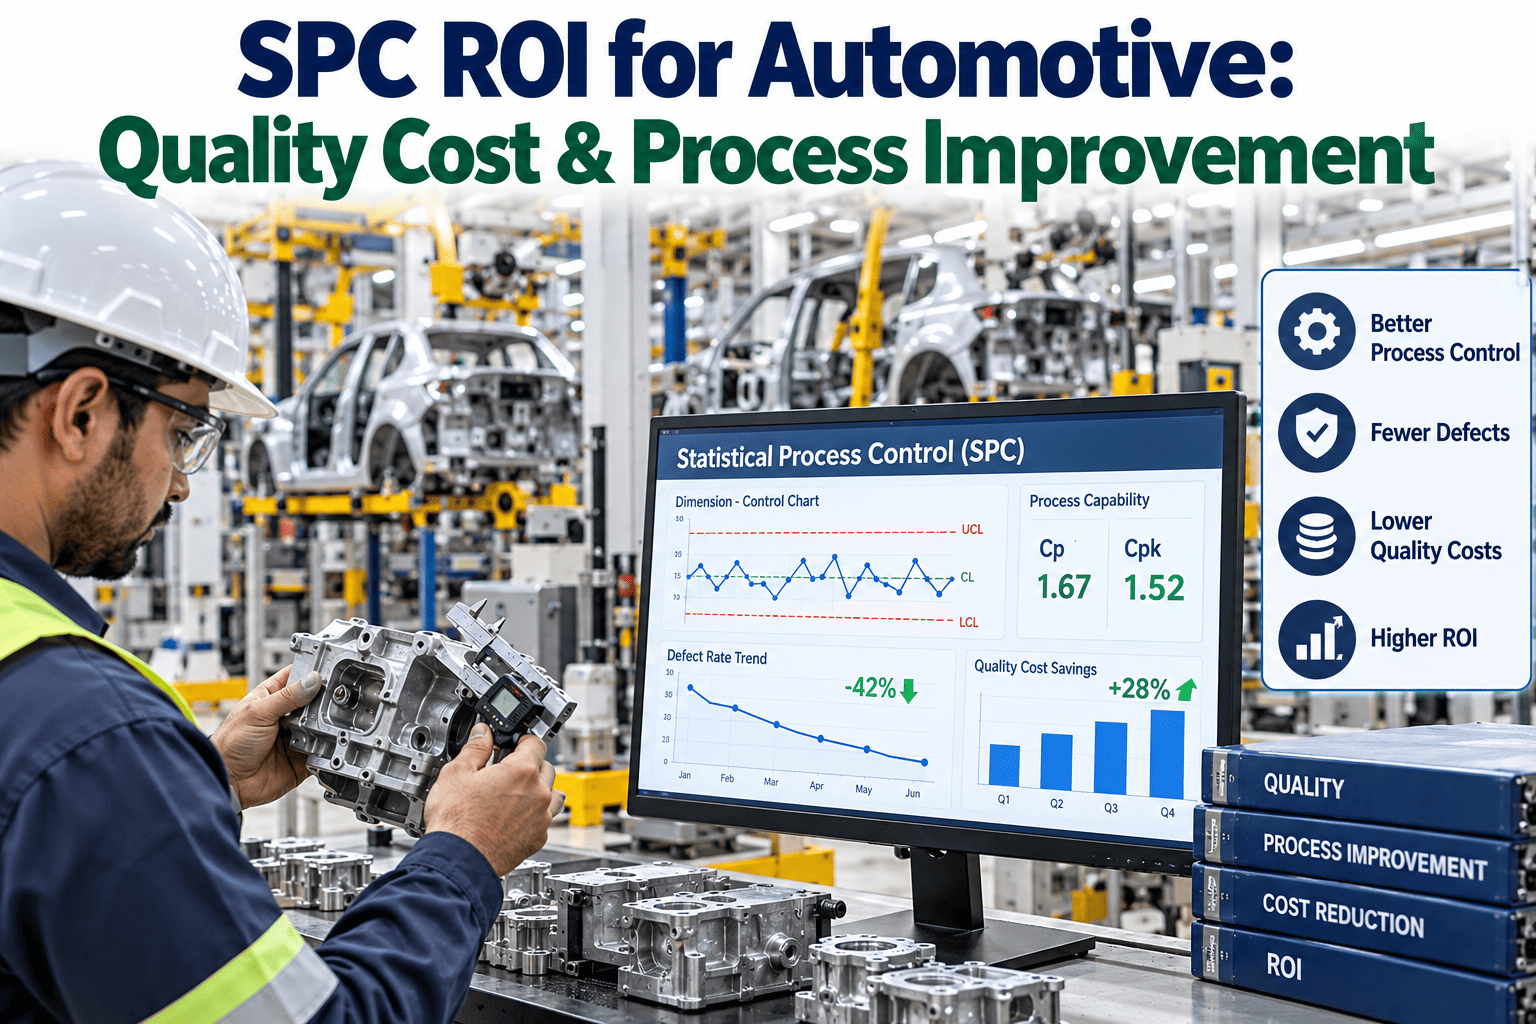
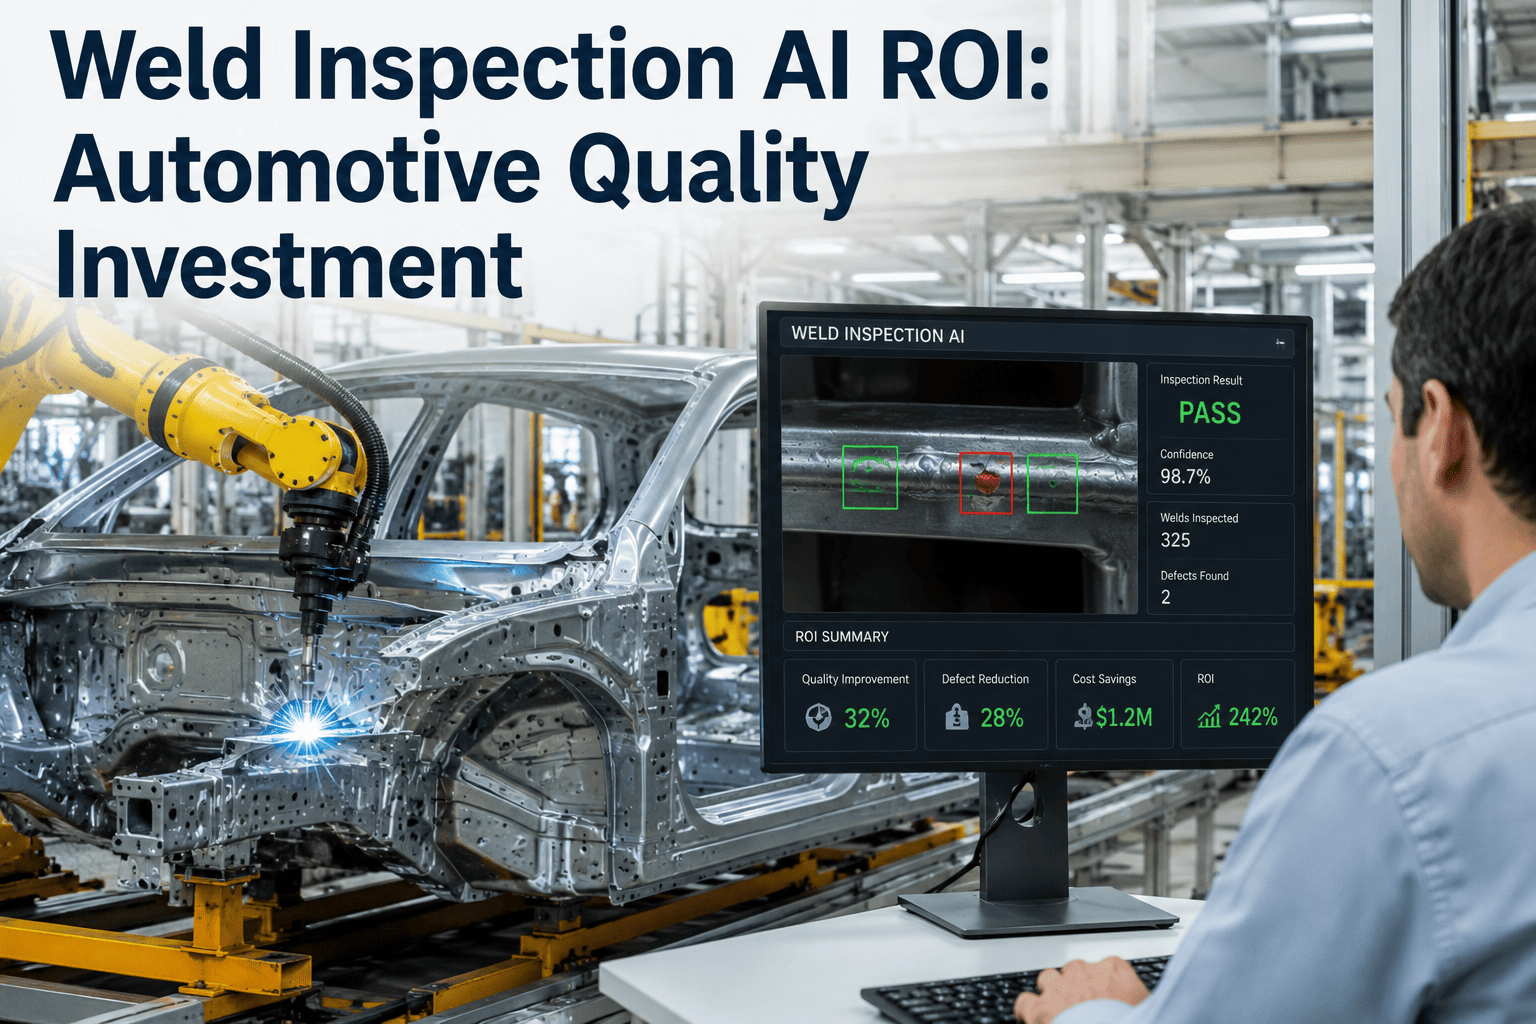
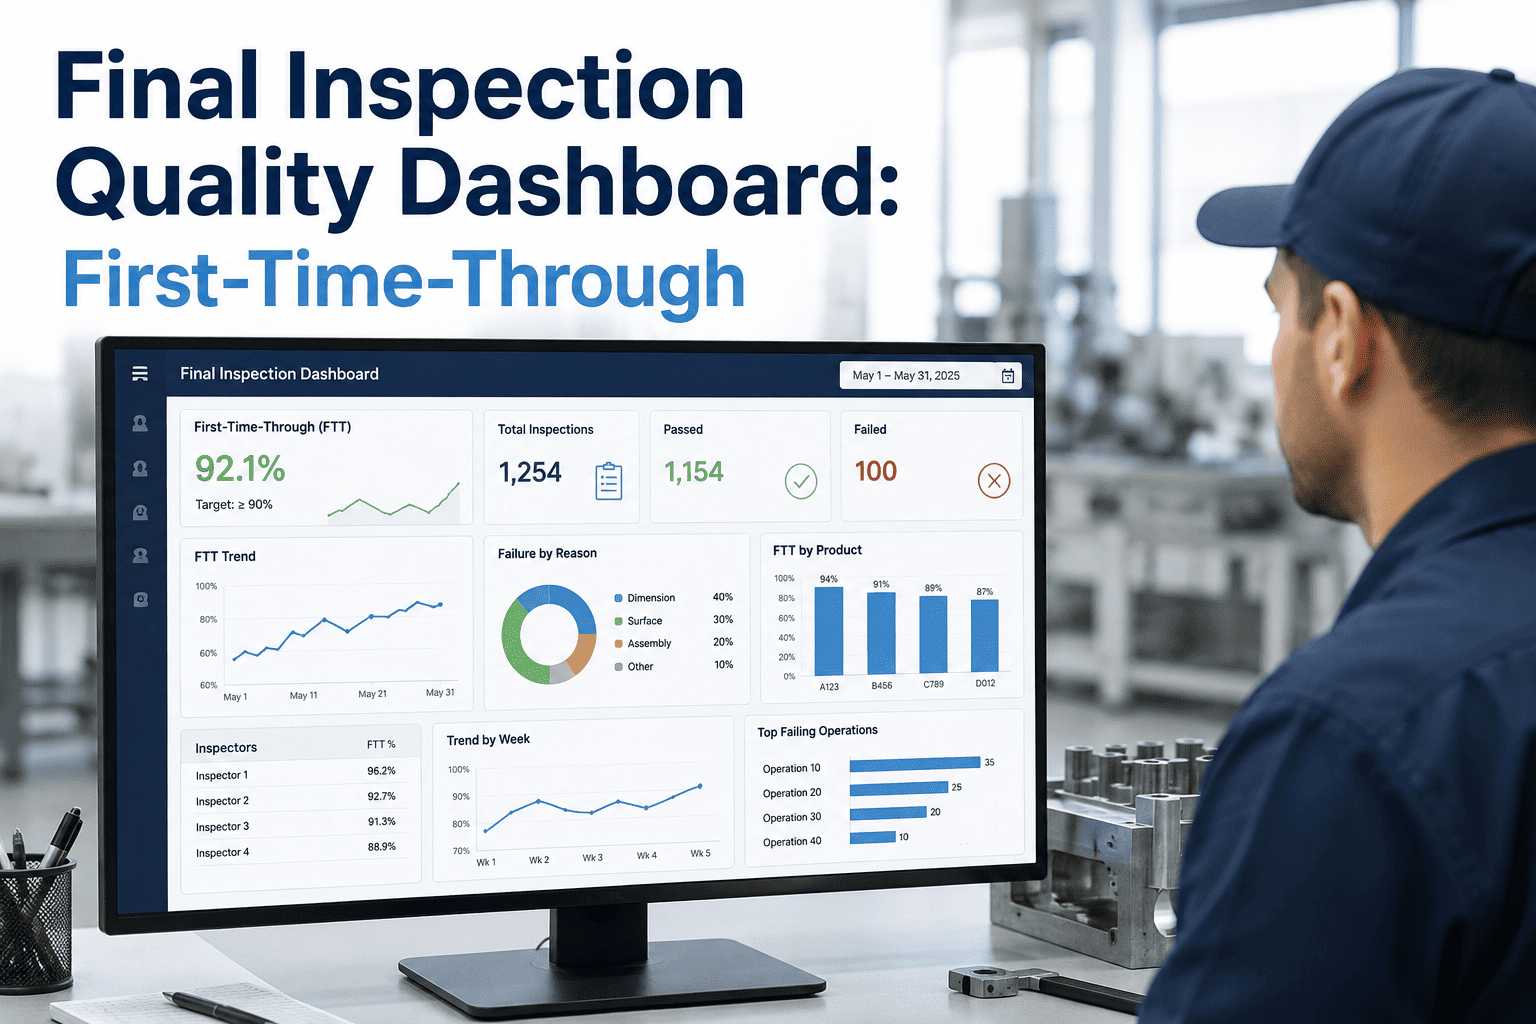
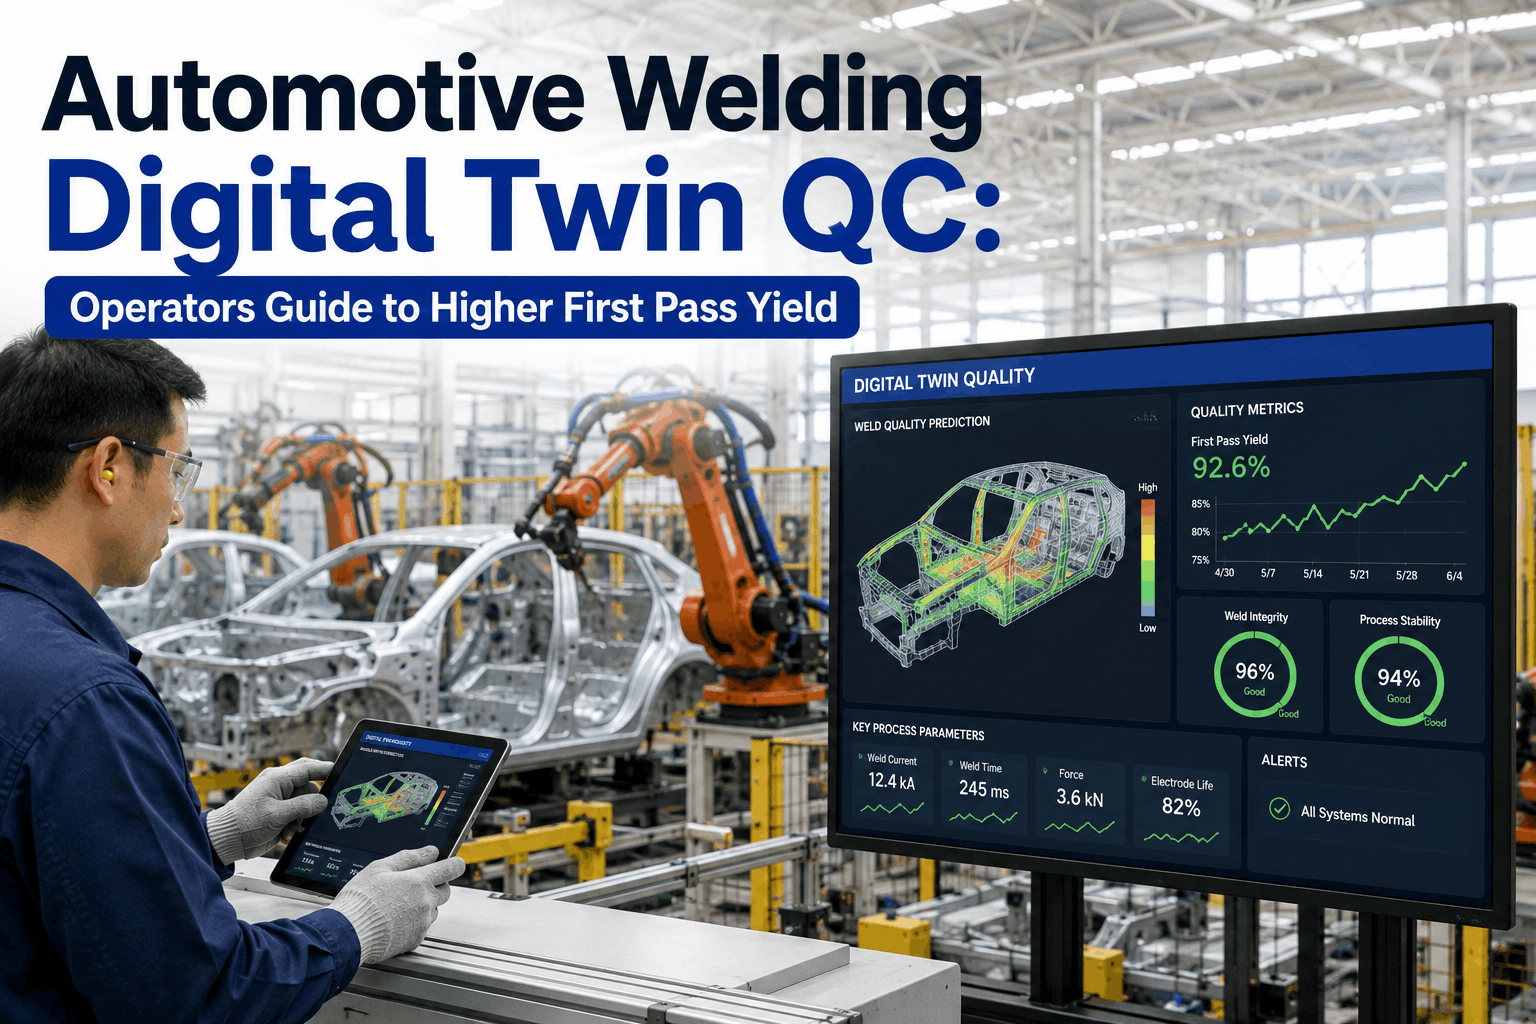
A one-point increase in first pass yield sounds small on a slide, but on an automotive line running 800 units a day it can mean dozens of parts that no longer need rework, dozens of hours that go back into production instead of correction, and a scrap bill that shrinks every single month it holds. Most plants can describe this relationship in general terms. Far fewer can put a defensible number on it when a plant manager asks what an AI inspection investment will actually return, which is exactly the calculation iFactory's quality economics team helps automotive manufacturers build before they sign anything.
Every Percentage Point of First Pass Yield Has a Dollar Value. Most Plants Have Never Calculated It.
First pass yield, scrap rate, and rework hours are usually tracked as separate metrics on separate reports. Quality improvement ROI exists at the intersection of all three — and until they're combined into one number, an inspection upgrade is a cost, not an investment.
Why First Pass Yield Is the Root Metric, Not a Vanity Number
First pass yield measures the percentage of units that complete a process correctly the first time, with no rework, no repair loop, and no scrap. Every unit that fails to hit that bar generates a second round of labor, a second round of material risk, and a delay that ripples into downstream stations. FPY is the root metric because scrap cost, rework labor, warranty exposure, and even on-time delivery performance all trace back to the same underlying number — a plant that improves FPY by two points is simultaneously reducing scrap spend, freeing labor capacity, and lowering the volume of defects that could reach a customer.
Scrap Cost
Material, labor, and energy already invested in a unit that gets discarded entirely — the most visible and most frequently under-tracked cost bucket in a quality program.
Rework Labor
Hours spent correcting a defect that inspection caught, plus the capacity those hours could have produced instead — rework is a hidden labor tax that rarely appears on a scrap report.
Warranty Exposure
The cost of defects that escape inspection entirely and surface after the vehicle ships — typically five to ten times more expensive to resolve than catching the same defect on the line.
Capacity Recovery
Throughput freed up when units stop looping back through rework stations — capacity that can absorb volume growth without adding a shift or a station.
What Moves When AI Inspection Replaces Manual Sampling
Manual visual inspection typically samples a fraction of units, catches defects inconsistently across shifts and inspectors, and reacts to problems after a batch has already accumulated. AI inspection systems check every unit at line speed with a consistent standard, which changes the shape of the FPY curve rather than just nudging it upward. The comparison below reflects the pattern most automotive lines see in the first two quarters after deployment.
| Cost Driver | Manual Sampling Baseline | AI Inspection After Deployment |
|---|---|---|
| Inspection Coverage | 10-30% of units sampled | 100% of units checked |
| Defect Detection Consistency | Varies by inspector and shift | Fixed standard, every unit, every shift |
| Scrap Rate | Baseline, often underestimated | Typically reduced 20-40% |
| Rework Hours per Shift | Reactive, batch-driven spikes | Smoothed, caught at point of occurrence |
| Escaped Defects to Warranty | Higher, detected post-shipment | Reduced by catching defects pre-shipment |
The single biggest driver of ROI is usually not the scrap line item itself, but the compounding effect of catching defects at the exact station where they occur rather than several stations downstream, where the same defect has already consumed additional labor, material, and cycle time before anyone notices it.
Turn Your Own FPY Data Into a Defensible Investment Case
iFactory pulls scrap, rework, and warranty data directly from your existing systems to model exactly what an FPY improvement is worth on your line, before you commit budget.
A Worked Example: Body Shop Line Running 750 Units a Day
Consider a body shop line producing 750 units per day, with a baseline first pass yield of 91%, an average scrap cost of $340 per unit, and average rework cost of $85 per reworked unit. At baseline, roughly 68 units per day fail first pass — some scrapped outright, most routed through rework. A two-point FPY improvement, which automotive plants commonly see within the first two quarters of deploying full-coverage AI inspection, recovers 15 units per day from that failure pool.
Annualized across roughly 250 production days, that two-point FPY gain is worth just over $573,000 in recovered scrap and rework cost alone, before factoring in the warranty exposure avoided by catching defects that would otherwise have escaped to the customer. This is the number that changes an inspection upgrade from a line-item request into a capital project with a calculable payback period.
Building the ROI Case: The Calculation Sequence
Establish the true baseline FPY
Pull actual defect and rework data from the last two to three quarters, not an estimated or reported figure — many plants discover their assumed FPY is optimistic once rework loops are counted properly.
Cost each failure category separately
Scrap, rework labor, and warranty exposure behave differently and need separate per-unit cost figures rather than a single blended average.
Model the expected FPY shift
Use detection coverage and consistency improvements from comparable deployments to project a realistic FPY gain rather than an optimistic best case.
Multiply the gain across daily volume
Even a one or two point FPY shift compounds meaningfully once it's applied across a full day, week, and year of production volume.
Compare against total investment cost
Divide total investment by annualized savings to produce a payback period plant leadership can evaluate against other capital requests.
Where Plants Undercount Their Own Savings
The most common mistake in a quality improvement business case is stopping at the scrap line and ignoring the rest of the cost stack. A defect caught at final inspection instead of at the station where it occurred has already consumed labor, energy, and cycle time at every station in between — costs that don't show up on a scrap report but are just as real. Warranty exposure is undercounted even more often, because the cost of an escaped defect doesn't land on the plant's books at all; it surfaces months later as a claim, disconnected from the production data that could have explained it.
Upstream Cost Accumulation
A defect that survives three stations before detection carries the labor and material cost of all three, not just the station where it was finally caught — full-coverage inspection catches it at the source instead.
Capacity Value
Every hour not spent on rework is an hour of available capacity — on a line running near its takt limit, that capacity has real value even without adding a shift.
Warranty Reduction
Because warranty claims cost several times more than an in-line catch, even a modest reduction in escaped defects can outweigh the scrap and rework savings combined.
A Composite Scenario: The Business Case That Almost Got Rejected
A Tier 1 automotive supplier building interior trim components proposed an AI inspection upgrade for its injection molding finishing line, built around a projected scrap reduction of 18%. Plant finance rejected the first version of the business case because it relied on an industry-average scrap improvement figure rather than the plant's own data, and because it excluded rework labor entirely, counting only material cost. The revised case pulled twelve months of actual defect logs, separated scrap from rework from a smaller but real category of warranty returns traced back to cosmetic surface defects, and reran the model against the plant's own historical FPY trend rather than an external benchmark.
The revised numbers were less dramatic than the original pitch, but they were defensible — a projected 14% scrap reduction, a 22% cut in rework hours, and a modest but real reduction in warranty-linked returns. Finance approved the investment on the second submission, specifically because the case was built from the plant's own operating data instead of a generic industry figure, and because it separated the three cost categories instead of blending them into a single optimistic number.
Stop Estimating Your Quality ROI. Calculate It.
iFactory connects to your existing scrap, rework, and warranty data to build a quality improvement business case grounded in your own plant's numbers, not an industry average.
Frequently Asked Questions
What FPY improvement is realistic from AI inspection alone?
Most automotive lines moving from partial manual sampling to full-coverage AI inspection see FPY improvements in the one to three point range within the first two quarters, though the exact figure depends heavily on how much of the baseline defect rate was going undetected under manual sampling. Visit support to model a realistic range against your own baseline data.
How do I separate scrap savings from rework savings in the business case?
Cost each category using its own per-unit figure rather than a blended average — scrap should reflect full material and labor invested up to the point of discard, while rework should reflect labor hours and any added material, since the two behave very differently as detection coverage improves.
Should warranty cost be included in a first pass yield ROI case?
Yes, wherever the data allows it — escaped defects that surface as warranty claims typically cost several times more to resolve than the same defect caught in-line, and excluding this category understates the true return of full-coverage inspection. Book a demo to see how warranty-linked defect data can be connected back to production records.
How long does it typically take to see FPY movement after deployment?
Most plants see measurable FPY movement within the first four to eight weeks of full-coverage deployment, as consistent detection replaces variable manual sampling — though the largest gains often come from process changes made in response to defect patterns the new inspection data reveals, which take a bit longer to show up in the numbers.
What's the biggest reason a quality ROI business case gets rejected?
Relying on industry-average improvement figures instead of the plant's own historical data is the most common reason finance teams push back — a case built from twelve months of actual scrap, rework, and warranty history is far more defensible than one built on a generic benchmark. Contact support for help pulling and structuring that data before you present.