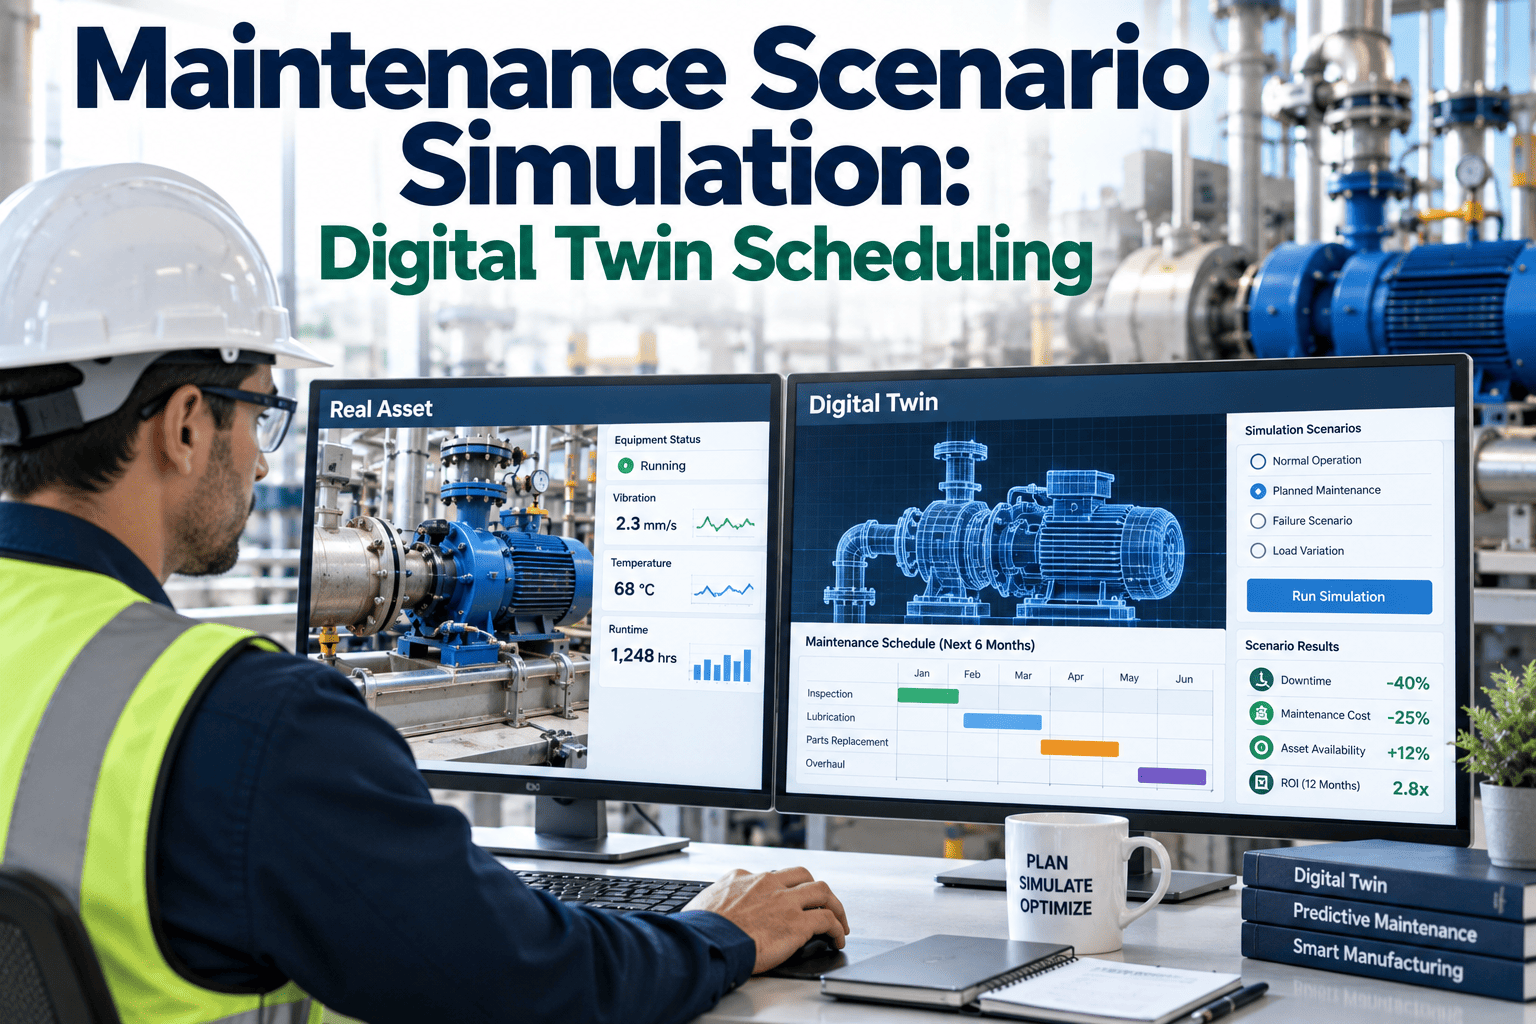
Scheduling a major PM window on a stamping line always comes down to a guess dressed up as a plan: block out six hours, hope the bearing replacement doesn't run long, and hope the adjacent line doesn't need the shared crane at the same time. When the estimate is wrong, either the line sits idle longer than necessary or the maintenance crew rushes a job that should have had more time, and both outcomes cost real money. This is a genuinely hard scheduling problem because it requires reconciling three separate sources of uncertainty at once — how long the actual work will take, what the true production cost of the window is, and whether every resource the job needs will actually be free — and most plants solve it with a single planner's judgment rather than a model that can actually test multiple options against each other. A digital twin removes the guesswork by letting the maintenance team simulate the actual scenario before committing a single hour of downtime: model the specific PM tasks, the resource conflicts with other scheduled work, and the production impact of different shutdown windows, then pick the plan the simulation shows will actually work. If you are still scheduling major maintenance windows by gut feel, you can book a demo to see how iFactory's digital twin models the scenario first.
Model the PM Window Before You Commit the Downtime
iFactory's digital twin simulates maintenance scenarios against your actual production schedule and resource constraints, so the plan you commit to is the one the data says will actually work.
Three Variables a Maintenance Scenario Simulation Weighs Together
A useful maintenance simulation is not just a task duration estimate. It models how the maintenance plan interacts with production and shared resources at the same time, since a plan that looks fine in isolation often breaks down once it collides with a resource another line needs at the same hour. Treating these three variables independently, which is effectively what happens when a planner checks the production calendar and the maintenance calendar separately without cross-referencing them, is exactly how a technically well-planned job ends up delayed by a crane that was quietly double-booked.
PM Window Impact
How long the specific task sequence realistically takes based on historical completion times for similar work, not the optimistic estimate on the work order.
Shutdown and Production Plan
What the line and any dependent downstream stations lose in output during the window, and whether that loss can be absorbed or needs to be made up.
Resource Availability
Whether the specific technicians, tooling, and shared equipment like cranes or lifts are actually free during the proposed window, not just assumed available.
Running Multiple Scenarios Before Picking a Window
The real value of simulation shows up when comparing several candidate windows side by side rather than committing to the first one that looks open on the calendar. The comparison below illustrates how three candidate windows for the same PM task can produce meaningfully different outcomes.
| Scenario | Production Loss | Resource Conflict Risk | Simulated Completion |
|---|---|---|---|
| Saturday Day Shift | Low, weekend line already down | Low, crew fully available | On time, 94% confidence |
| Weeknight Third Shift | Moderate, reduced overnight output lost | Medium, shared crane booked by Line 3 | Delayed 2 hours, 71% confidence |
| Mid-Week Day Shift | High, full production shift lost | Low, crew and tooling available | On time, 91% confidence |
What Data Feeds an Accurate Maintenance Scenario Model
A simulation is only as good as the data behind it. The inputs below are what typically separate a simulation that produces a genuinely reliable schedule from one that just repeats the same optimistic guesswork in digital form.
Historical Task Duration Data
Actual completion times from past similar maintenance jobs, not the standard time listed in the work instruction, form the basis for a realistic duration estimate.
Production Schedule Integration
Live visibility into what each line is producing and its current order backlog determines the true cost of taking that line down at a given hour.
Shared Resource Calendar
Cranes, specialized tooling, and technician availability across the whole plant, not just the requesting department's own schedule.
Failure and Delay Probability
Historical rate of jobs running long or encountering complications, weighted into a confidence interval rather than a single point estimate.
Results From Plants Simulating Maintenance Scenarios Before Scheduling
The figures below reflect aggregated outcomes from automotive plants that adopted scenario simulation before committing to major maintenance windows, compared against their prior scheduling approach.