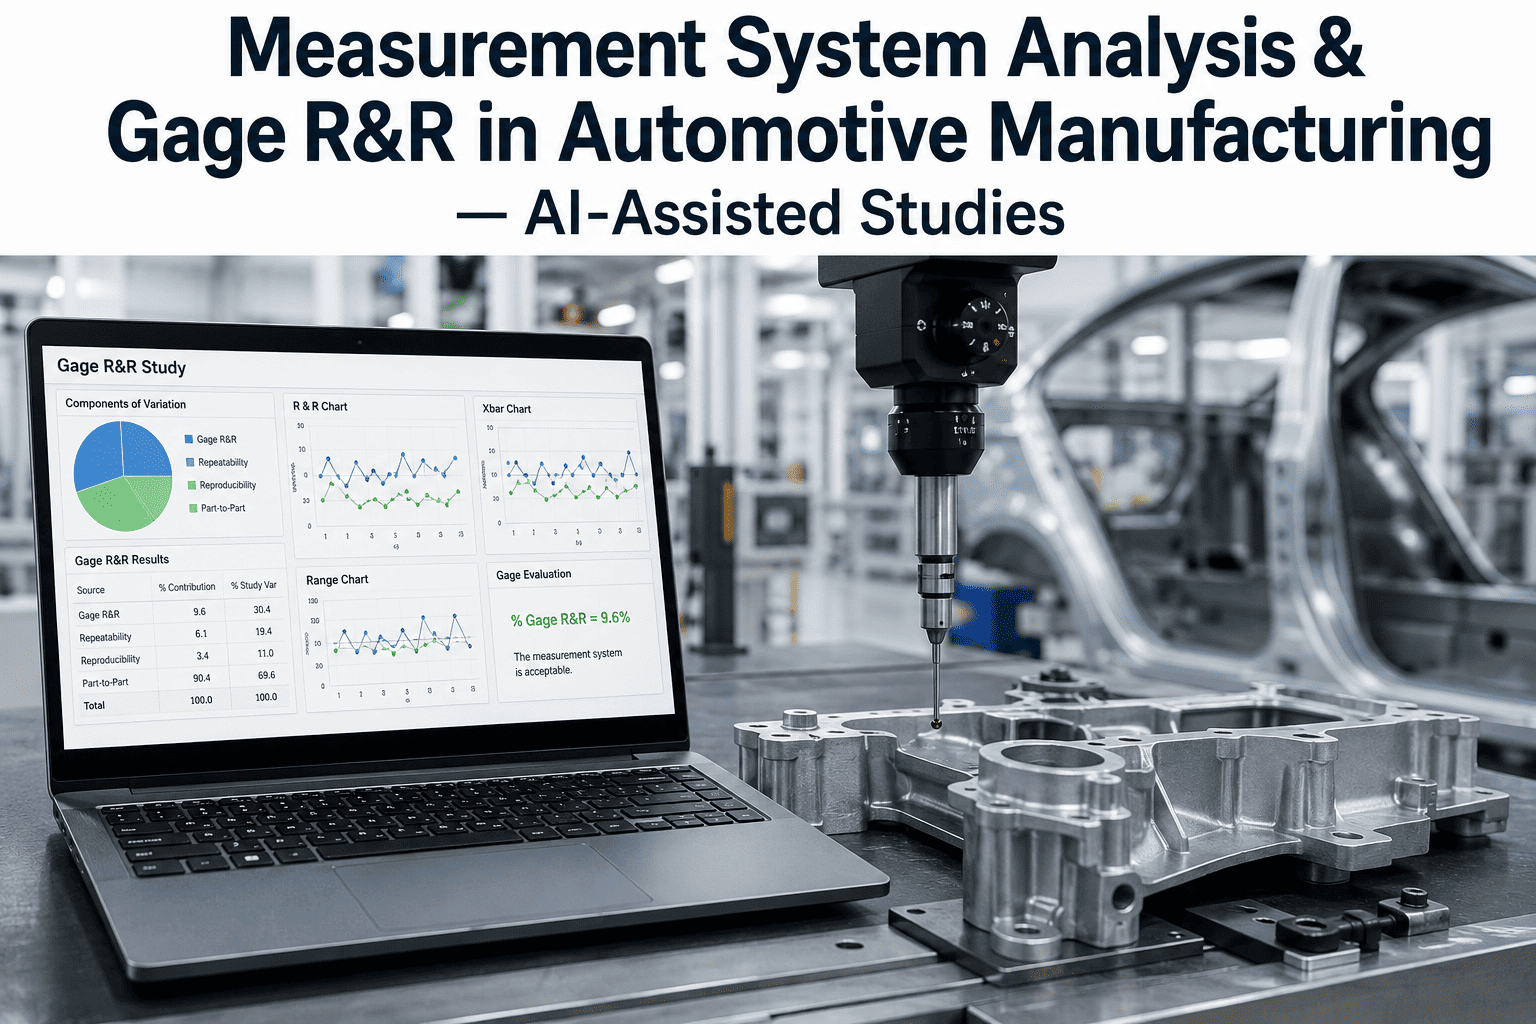
An SPC chart is only as trustworthy as the gauge that fed it data, and this is the part of automotive quality programs that gets skipped more often than any other single requirement in IATF 16949. A control chart showing a stable, capable process built on a measurement system with 35% gauge variation is not evidence of good quality — it is evidence of a good story told with bad numbers. Measurement System Analysis exists to answer one uncomfortable question before any SPC data gets trusted: how much of what we are seeing is the part, and how much is the gauge, the operator, or random noise. If your SPC dashboard has never had its underlying gauges through a documented Gage R&R study, book a demo to see how iFactory automates the study end to end.
Your SPC Chart Is Only as Good as the Gauge Behind It
Measurement System Analysis — Gage R&R, linearity, bias, and stability studies — is the prerequisite most automotive SPC programs skip, and the single most common finding in supplier quality audits.
Why MSA Comes Before SPC, Not After
Total observed variation in any measurement is a combination of actual part-to-part variation and measurement system variation — repeatability from the gauge and reproducibility from the operator. If measurement variation is large relative to part variation, an SPC chart cannot distinguish a genuine process shift from a gauge reading a part differently on the second try. This is precisely why IATF 16949 requires documented MSA on any characteristic before it is used for process control or capability reporting to a customer.
A control chart built on an unvalidated gauge can show false out-of-control signals purely from measurement noise, triggering unnecessary process adjustments that add variation rather than remove it.
Capability indices such as Cpk are calculated directly from observed variation — if 30% of that variation is measurement error, the reported Cpk understates true process capability and misrepresents supplier performance to the OEM.
A gauge that passes calibration can still fail Gage R&R — calibration confirms accuracy against a standard, while Gage R&R confirms the gauge produces consistent readings across operators and repeated trials on the same part.
The Four Studies That Make Up a Complete MSA
Automotive customers, IATF 16949 auditors, and internal quality engineers generally expect four distinct studies, each answering a different question about the measurement system's behavior.
Gage R&R Study
Two or three operators each measure the same set of parts multiple times in random order, isolating repeatability (equipment variation) from reproducibility (operator-to-operator variation) as a percentage of total tolerance or total variation.
Linearity Study
Confirms the gauge reads accurately across its full operating range, not just at one reference point, by measuring reference parts spanning the low, mid, and high end of the specification range.
Bias Study
Compares the average of repeated gauge measurements on a single reference part against its accepted true value, quantifying any systematic offset the gauge consistently applies.
Stability Study
Tracks a gauge's readings on a fixed reference standard over an extended period to confirm measurement behavior does not drift with wear, temperature, or time between calibrations.
Run Your Next Gage R&R Study Without the Spreadsheet
iFactory automates data collection, ANOVA calculation, and AIAG-format reporting for Gage R&R, linearity, bias, and stability studies — see it configured against one of your own gauges on a live call.
Running a Gage R&R Study Step by Step
The AIAG-standard crossed Gage R&R method follows a fixed sequence. Deviating from this sequence — letting operators see each other's readings, or measuring parts in a predictable order — is the most common reason a study produces misleading results.
Select 10 parts spanning the full range of expected process variation, and 2 or 3 operators who normally perform this measurement on the production floor.
Each operator measures each part 2 or 3 times, in a randomized order that prevents the operator from recognizing which part they measured last or predicting the expected value.
Operators measure independently, without visibility into each other's readings, and without knowledge of which part number corresponds to which trial.
Calculate repeatability (equipment variation), reproducibility (operator variation), and their combined percentage against total tolerance using ANOVA or the AIAG average and range method.
Document the result against the acceptance criteria, and if the gauge falls in the conditional or unacceptable range, initiate a corrective action before the characteristic is used for SPC or capability reporting.
AIAG Gage R&R Acceptance Criteria
These thresholds, published in the AIAG MSA reference manual, are the benchmark most automotive customer-specific requirements point back to when specifying acceptable measurement system performance.
| Percent Gage R&R (of Tolerance) | Classification | Typical Action Required |
|---|---|---|
| Under 10% | Acceptable | Gauge approved for SPC and capability use |
| 10% to 30% | Conditionally Acceptable | May be acceptable based on application, cost, and criticality — requires documented justification |
| Over 30% | Unacceptable | Gauge, fixture, or measurement method must be improved before use |
| Number of Distinct Categories | 5 or more required | Confirms the gauge can distinguish meaningfully different part values |
Five Mistakes That Invalidate an MSA Study
A Gage R&R study run incorrectly produces a number that looks precise and is quietly meaningless. These are the errors quality engineers encounter most often during audit review.
Measuring parts in numerical order lets operators anticipate readings, artificially inflating apparent repeatability.
Selecting 10 nearly identical parts instead of parts spanning the full process range produces an artificially high percent Gage R&R relative to tolerance.
Operators seeing each other's measurements collapses reproducibility variation, hiding a real operator-to-operator disagreement.
Using quality engineers instead of the production operators who normally take the measurement misrepresents real-world reproducibility.
Running MSA once at PPAP and never repeating it after gauge repair, fixture wear, or a new operator population goes undocumented.
How OEM Customer-Specific Requirements Change the MSA Baseline
The AIAG MSA reference manual sets the industry baseline, but most automotive OEMs layer their own customer-specific requirements on top of it, and suppliers are contractually obligated to meet whichever standard is more stringent. A gauge that clears the generic AIAG threshold can still fail a specific OEM's PPAP submission if that customer requires tighter acceptance bands, additional distinct categories, or a different statistical method for calculating percent Gage R&R. Quality engineers managing multi-OEM supply chains often need to run the same physical gauge study once, then evaluate it against several different acceptance frameworks depending on which customer's part it is qualifying.
Typically expects Gage R&R reporting using the ANOVA method rather than the average and range method, with specific attention to interaction effects between operator and part that the simpler method can miss entirely.
Often requires MSA studies to be resubmitted at defined PPAP milestones and after any tooling or fixture change, tracked explicitly within the supplier's control plan rather than as a standalone one-time record.
Frequently applies additional scrutiny to attribute agreement analysis for visual and go/no-go characteristics, given the higher subjectivity risk in binary pass/fail measurement decisions.
Because these requirements shift over time and vary by customer, quality teams should always confirm the current customer-specific requirement document rather than relying on a prior program's acceptance criteria. iFactory maintains a configurable library of OEM-specific MSA acceptance rules that can be applied automatically when a study is submitted against a given customer's part number — contact support to review your specific OEM mix.
Tying MSA Results Into the Broader Quality System
A Gage R&R study that lives in an isolated spreadsheet, disconnected from the control plan, the SPC dashboard, and the PPAP submission package, creates exactly the kind of audit gap that IATF 16949 assessors are trained to find. A well-run measurement systems program treats MSA as one connected input into a larger quality record, not a standalone compliance exercise completed once and filed away.
Every characteristic on the control plan should reference the specific gauge and its current MSA status, so a reviewer can trace from process control directly back to measurement system validation.
Characteristics without a passing MSA study on file should be visibly flagged on the SPC dashboard rather than silently charted alongside fully validated characteristics.
Linearity, bias, stability, and Gage R&R results should be retrievable as a complete package at PPAP submission time, without a scramble to reconstruct historical studies from disconnected files.
Studies due for renewal should generate an automatic task rather than depending on a quality engineer remembering an annual date on a personal calendar.
Typical Gage R&R Performance by Measurement Type
Not every measurement technology starts from the same baseline. Quality engineers scoping a new gauge purchase or planning a study often want a realistic expectation of achievable performance before committing budget, and the ranges below reflect commonly observed outcomes across automotive supplier gauges before and after fixture or technique improvements.
| Measurement Type | Typical Gage R&R Before Improvement | Typical Gage R&R After Fixture Optimization |
|---|---|---|
| Manual caliper or micrometer, tight tolerance | 20% to 40% | 10% to 18% |
| Fixed-gauge dial indicator with locating fixture | 8% to 18% | 4% to 9% |
| Coordinate measuring machine, manual fixturing | 15% to 25% | 6% to 12% |
| Automated vision or laser measurement system | 5% to 12% | 2% to 6% |
| Torque wrench or torque transducer | 10% to 20% | 5% to 10% |
The pattern across almost every measurement technology is the same — fixturing and locating consistency drives a larger share of measurement variation than the raw precision of the gauge itself. A quality engineer chasing a failed Gage R&R study should generally investigate part location and clamping method before assuming the gauge itself needs replacement.
Pre-PPAP MSA Readiness Checklist
Before submitting a PPAP package that includes MSA results, a quick internal review against these points catches the gaps that most commonly trigger a customer rejection or a request for additional data.
Gage R&R study uses the specific operators who perform the measurement in production, not quality engineering staff standing in for them.
Ten parts spanning the full expected process range were used, not a narrow cluster of nearly identical samples.
Measurement order was randomized and operators were blinded to prior readings and part identity throughout the study.
Linearity and bias studies exist for the same gauge and are dated within the customer's required validity window.
Acceptance criteria applied match the specific OEM customer-specific requirement, not just the generic AIAG default.
The control plan explicitly references this gauge and its current MSA status for the characteristic being submitted.
A Common Scenario: When a Passing SPC Chart Hides a Failing Gauge
A Tier 1 supplier producing a machined transmission housing ran a stable-looking control chart on bore diameter for six months, with every point comfortably within control limits and a reported Cpk above the customer's 1.67 requirement. During a routine internal audit ahead of a customer surveillance visit, the quality manager discovered the last documented Gage R&R study on that specific bore gauge was more than three years old, predating a fixture rebuild that had taken place after a tooling crash.
A fresh Gage R&R study, run properly with randomized order and blinded operators, returned a percent Gage R&R of 34% against tolerance — squarely in unacceptable territory. The rebuilt fixture was locating parts inconsistently between operators, and the "stable" control chart had actually been tracking measurement noise layered on top of real part variation, masking a process that was closer to marginal than the chart suggested. The team corrected the fixture locating pins, reran the study to confirm a result under 9%, and only then resumed trusting the SPC data for that characteristic.
The lesson generalizes well beyond this one part number: a control chart cannot self-diagnose a measurement problem, because it has no way to distinguish part variation from gauge variation on its own. The only way to know which one you are looking at is to run the study, on a schedule, before a customer surveillance visit finds the gap first.
Frequently Asked Questions
How often does a Gage R&R study need to be repeated?
Most automotive customer-specific requirements call for MSA to be repeated on an annual basis at minimum, and immediately after any event that could change measurement system behavior — a gauge repair, a fixture rebuild, a significant change in operator population, or introduction of a new part number to an existing gauge. Some OEM-specific requirements set shorter intervals for critical characteristics tied to safety or regulatory dimensions. Treating MSA as a one-time PPAP requirement rather than a living study is one of the most common findings in second and third-party audits. To see how iFactory schedules and tracks MSA renewal automatically against your control plan, book a demo with our team.
What is the difference between Gage R&R and gauge calibration?
Calibration confirms a gauge reads accurately against a certified reference standard at a single point in time, addressing systematic bias against a known true value. Gage R&R addresses a completely different question — whether the gauge produces consistent results when different operators measure the same part repeatedly, capturing random variation from equipment repeatability and operator reproducibility that calibration does not test for. A freshly calibrated gauge can still fail Gage R&R if the fixture is unstable, the operator technique varies significantly, or the gauge resolution is too coarse for the tolerance being measured. Both studies are required, and neither substitutes for the other. For a technical walkthrough of how to build both into your control plan, reach out to support.
Can a Gage R&R study fail even when the gauge is expensive and precise?
Yes, and this happens more often than quality teams expect. A high-precision coordinate measuring machine can still fail Gage R&R if the fixturing does not consistently locate the part the same way each time, if program datums are inconsistently selected between operators, or if the tolerance being measured is so tight that even sub-micron equipment variation consumes a large share of it. Percent Gage R&R is calculated relative to tolerance width, so a tight tolerance on an otherwise excellent gauge can still produce an unacceptable result. Our engineering team can review your specific gauge and tolerance combination — schedule a session to walk through it.
Do attribute characteristics like go/no-go gauges need a different type of MSA?
Yes. Attribute measurement systems — go/no-go gauges, visual pass/fail inspection, or any binary accept/reject decision — require an attribute agreement analysis rather than a variable Gage R&R, since there is no continuous numerical output to run ANOVA against. This typically involves multiple operators evaluating the same set of known-good and known-bad parts multiple times, with results scored against both operator self-agreement and agreement against the known reference standard. Effectiveness, miss rate, and false alarm rate are the key output metrics rather than percent Gage R&R. For guidance on setting this up for your specific attribute gauges, contact our support team.
How does iFactory reduce the manual effort involved in running MSA studies?
iFactory automates the data collection sequence for crossed Gage R&R studies, randomizing measurement order, blinding operators to prior readings, and calculating repeatability, reproducibility, percent Gage R&R, and number of distinct categories automatically using the ANOVA method rather than manual spreadsheet formulas. Linearity, bias, and stability studies are tracked against a renewal calendar tied to your control plan, so a due study surfaces automatically instead of relying on a quality engineer's memory. Completed studies generate AIAG-format reports ready for PPAP submission or customer audit review. See the full workflow on a live demo — book a walkthrough here.
Trust Your SPC Data Before You Trust Your Process
Every control chart, every Cpk report, and every PPAP submission depends on a measurement system that has actually been validated. See how iFactory brings MSA into the same platform as your SPC dashboard.