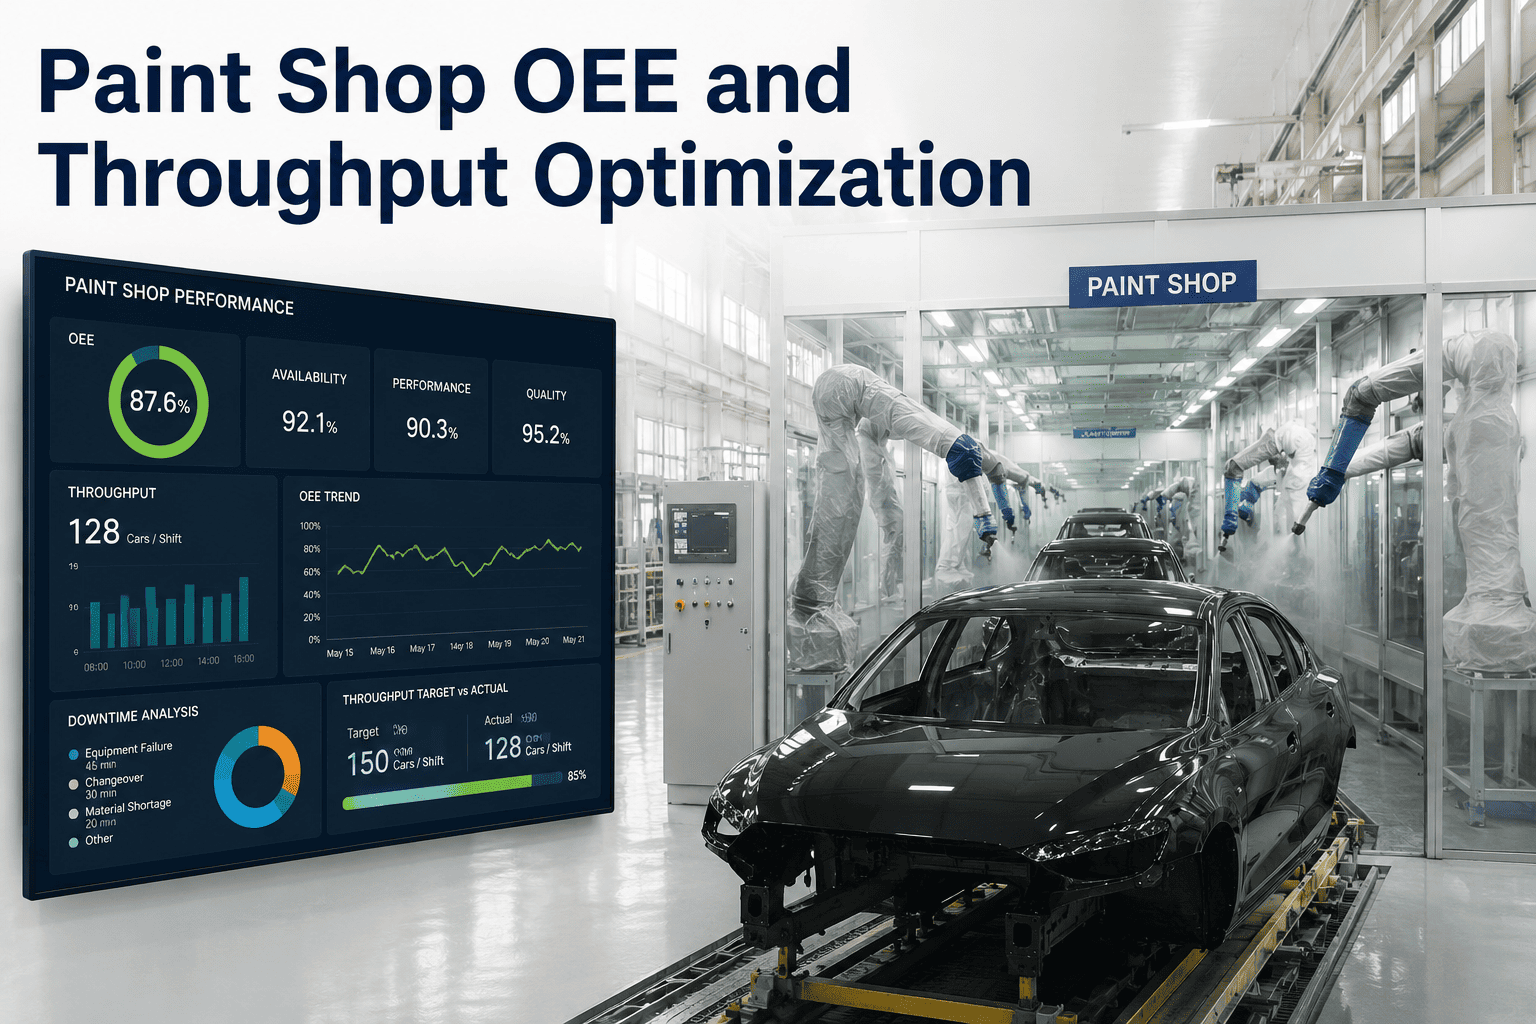
Paint shop OEE reports almost always show a number in the 60 to 75 percent range, and almost every plant manager asks the same question when they see it: where exactly are we losing the other 25 to 40 percent? The honest answer is that it is rarely one big loss. It is dozens of micro-stops under two minutes each that never generate a downtime code, color changes that run longer than the standard cycle time, and rate losses where the line runs slower than its rated speed without anyone flagging it as an event. Traditional OEE tracking captures the scheduled downtime and the obvious rejects, but the small, distributed losses that make up most of the gap stay invisible in a shift report. iFactory's AI platform attributes every loss category automatically across the paint shop, and you can book a demo to see exactly where your line's hidden losses are coming from.
Find the 30% of Capacity Hiding in Micro-Stops and Rate Loss
iFactory's AI platform automatically attributes every paint shop loss, from color change overruns to sub-two-minute micro-stops, giving plant leadership a real breakdown of where OEE is actually being lost instead of a single aggregate number.
Why Shift Reports Never Show Where the Real Losses Are
Standard OEE tracking depends on operators logging downtime events manually, which naturally biases the data toward the losses that are big enough and long enough to notice and record. The categories below are exactly the losses that traditional tracking systematically undercounts.
Seeing Exactly Where the Gap Between Nameplate and Actual Output Goes
Instead of a single OEE percentage, iFactory's platform breaks the gap between theoretical maximum output and actual bodies produced into specific, attributed categories, so engineering effort goes toward the loss that is actually costing the most capacity.
Stop Chasing the One Big Loss When the Gap Is Really a Hundred Small Ones
iFactory's AI platform attributes every category of paint shop loss automatically, from micro-stops to color change overruns, so your team can prioritize the fix that actually recovers the most capacity. Book a demo to see the full loss breakdown on your own line.
Cutting the Most Repeated Loss Event on Any Paint Line
Color changes happen dozens of times per shift on a mixed-model paint line, which makes even a small overrun per change add up to a significant capacity loss across a week. iFactory's platform tracks every color change cycle time individually against its standard, flagging patterns that point to a specific root cause.
Manual OEE Reporting vs AI Loss Attribution
The comparison below covers the dimensions that determine whether your team can actually act on OEE data or just report a number every week.
| Reporting Dimension | Manual Shift Report OEE | iFactory AI Loss Attribution |
|---|---|---|
| Micro-Stop Visibility | Rarely logged if under a few minutes | Every stop captured and categorized automatically |
| Rate Loss Detection | Invisible unless the line fully stops | Continuously measured against rated speed |
| Reason Code Consistency | Varies by operator and shift | Standardized attribution applied uniformly |
| Time to Identify Top Loss Driver | Days to weeks through manual review | Real time, updated continuously through the shift |
Results From AI OEE Analytics Deployments
These figures reflect paint shops where iFactory's platform was deployed for automated loss attribution and tracked over a minimum six-month production period.
Questions From Paint Shop Directors About OEE Analytics
Your OEE Report Has a Number — Now Get the Reasons Behind It
iFactory's AI platform turns a single paint shop OEE percentage into a fully attributed breakdown of every loss category, so your team knows exactly where to focus to recover real throughput. Book a demo to see it running on your line.