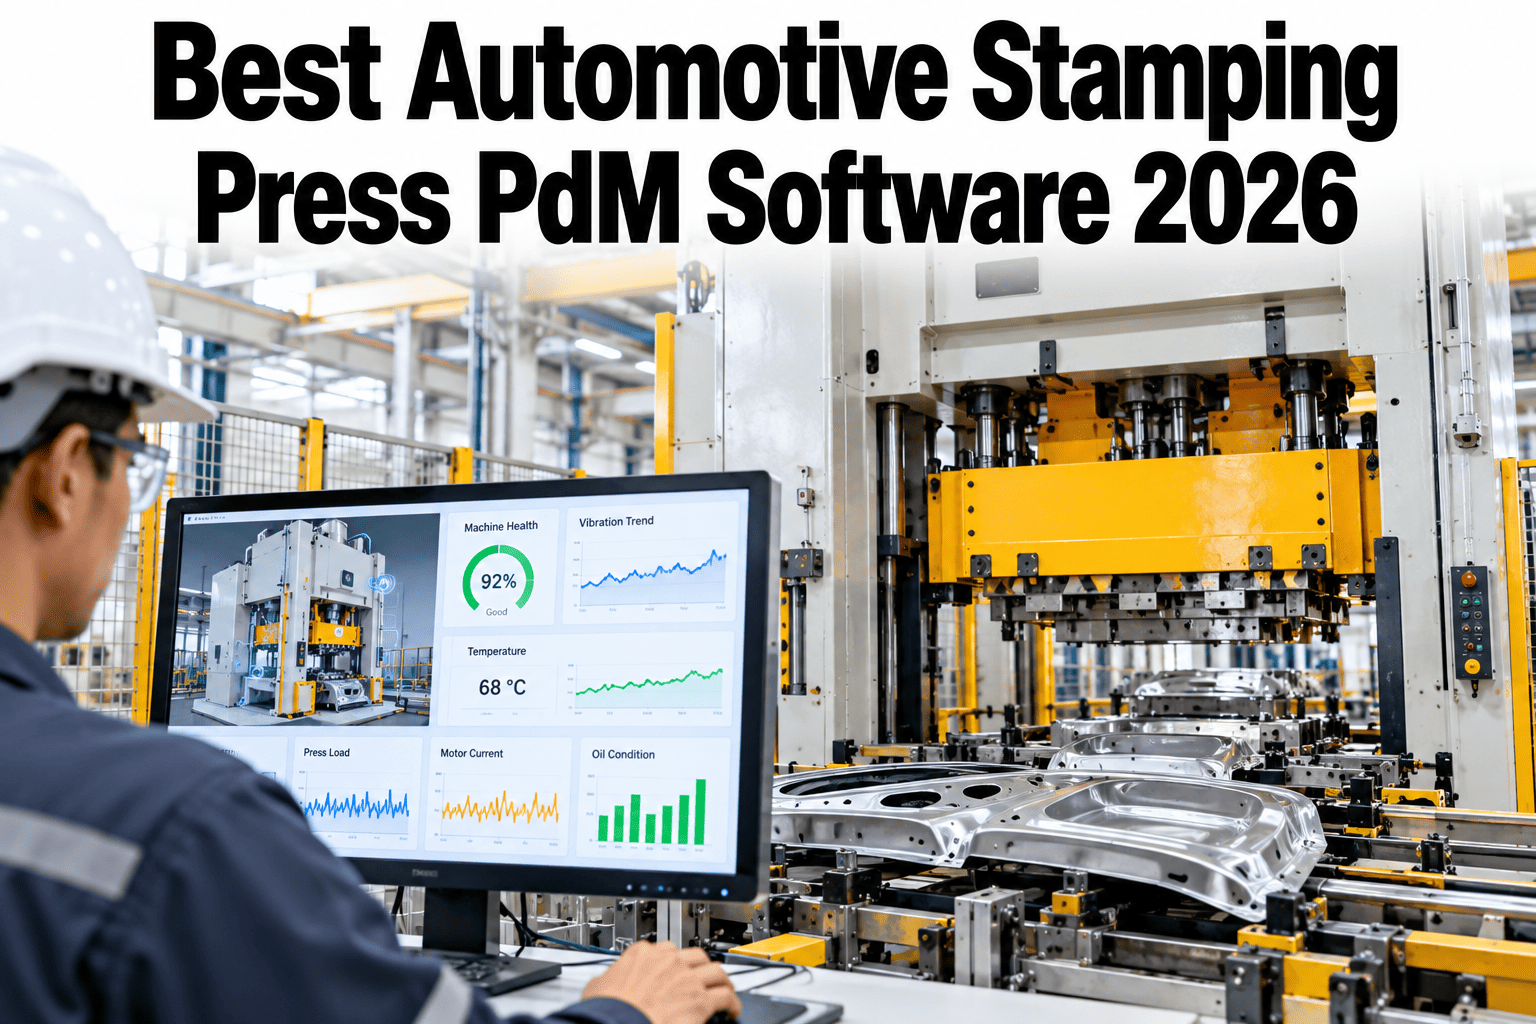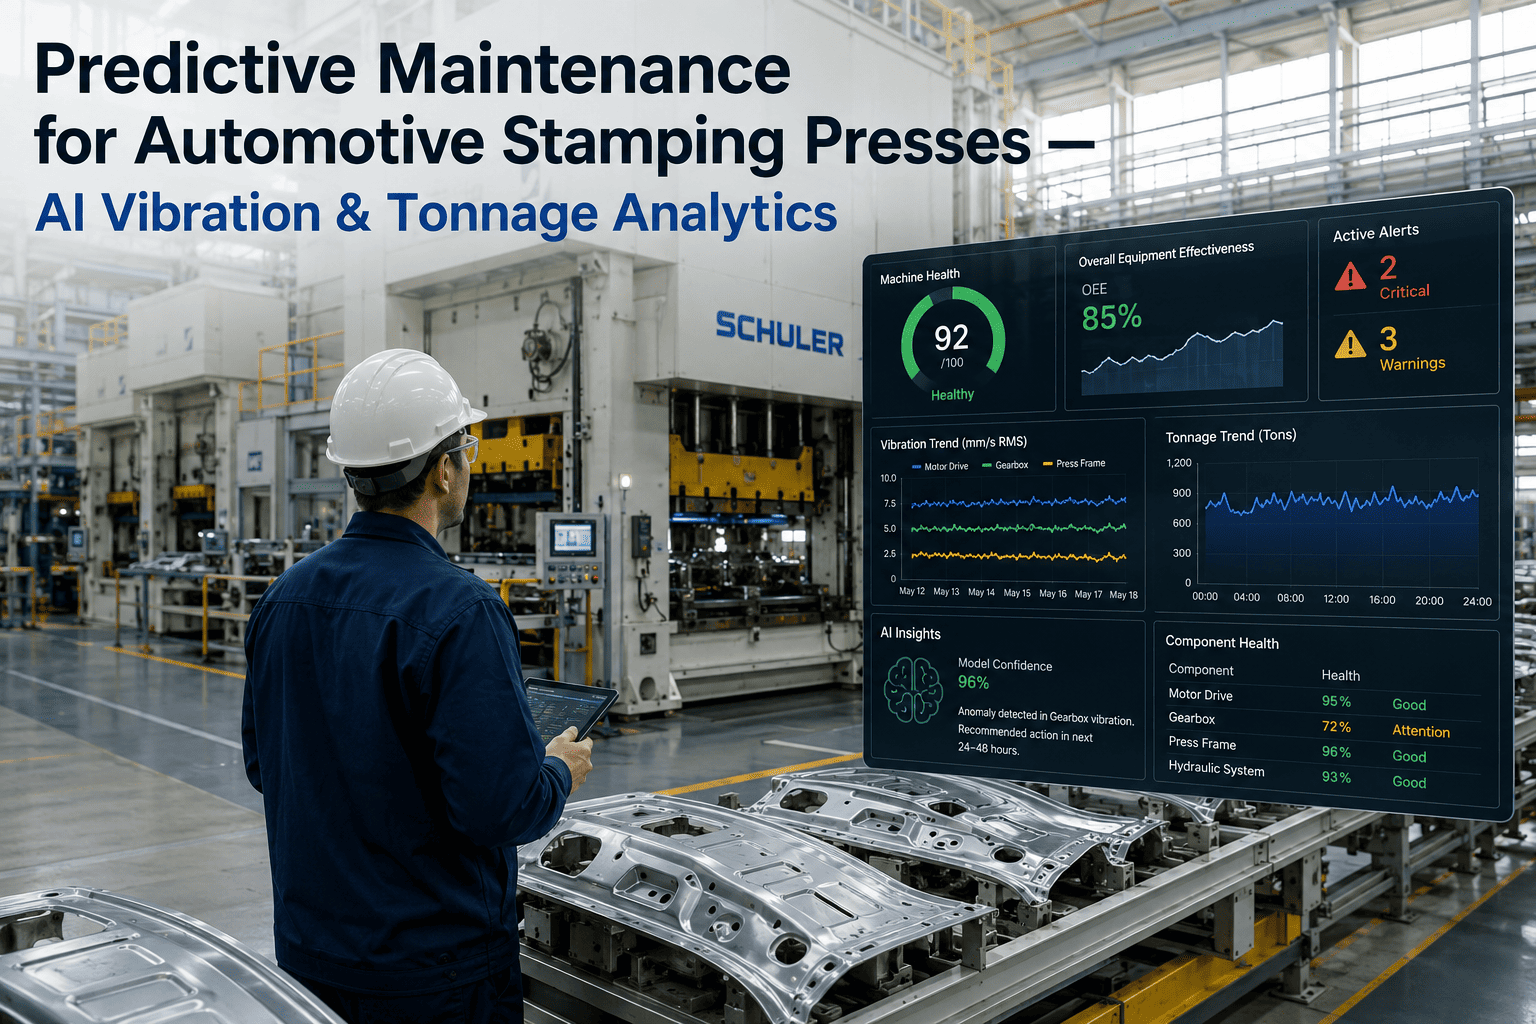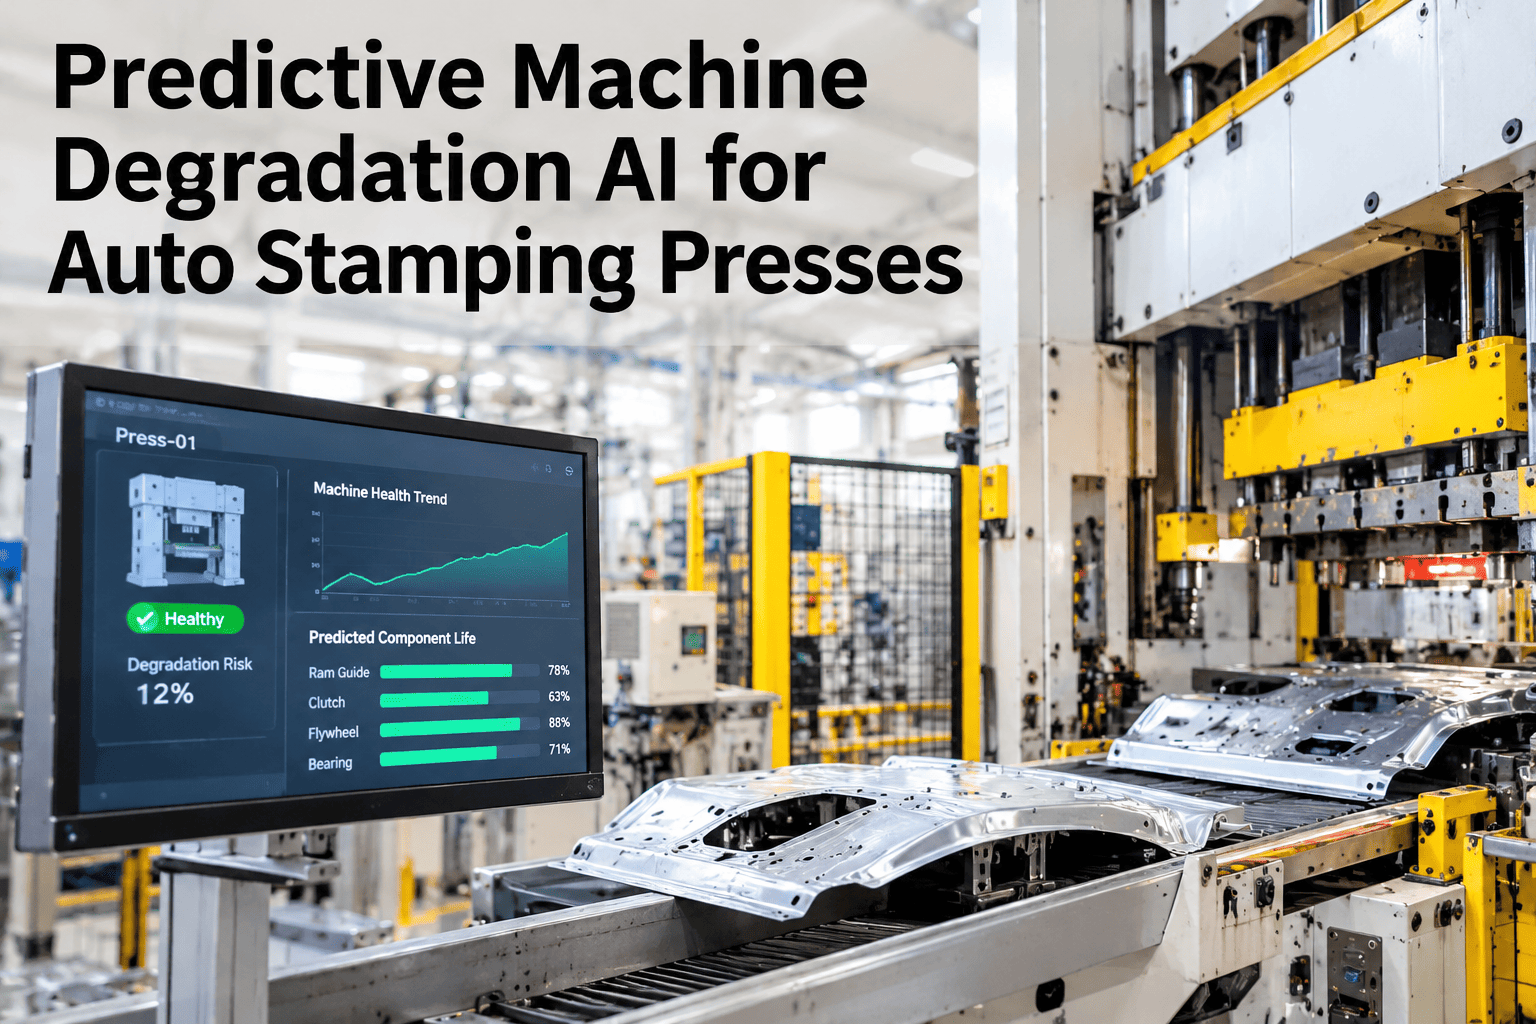
A 1,200-ton transfer press does not fail without warning — it degrades. The warnings are in the vibration signature of the main drive bearings, in the hydraulic ram velocity that shortens progressively over hundreds of cycles, in the guide clearance that widens from 0.08 mm to 0.14 mm over six months of production, and in the tonnage signature that shifts as the die wears and the press frame responds. None of these signals trips an alarm in a legacy press controller. They are visible only when someone is looking at long-horizon condition trends, and in most automotive press shops no one is — until the press trips at peak rate on a Monday morning and the OEM schedule is in jeopardy. Predictive machine degradation AI for stamping presses builds that long-horizon view, models health-index decay across all press subsystems, and produces remaining-useful-life (RUL) forecasts that make asset planning conversations specific rather than approximate. Teams that want to see this modelled on their own press fleet can book a session with iFactory AI.
See Press Degradation 14–60 Days Before It Becomes a Failure
iFactory AI builds a multi-subsystem health index for every press, models decay trajectories from live sensor data, and produces remaining-useful-life forecasts that turn asset planning from guesswork into a scheduled decision.
What Is Predictive Machine Degradation AI for Stamping Presses?
Predictive machine degradation AI is the application of multi-sensor condition monitoring, time-series anomaly detection, and remaining-useful-life modelling to stamping press subsystems — building a continuously updated health index for each subsystem and forecasting the time horizon before that subsystem requires maintenance intervention.
This is distinct from standard predictive maintenance alert systems that fire when a single sensor crosses a threshold. Degradation AI operates on the trajectory of the condition signal over time — detecting a bearing that is declining at 2% per week rather than one that has crossed a static alarm limit, and projecting when it will reach a failure threshold at the current decay rate. The advance warning window is the defining value: iFactory AI's degradation models for automotive stamping presses produce failure predictions 14–60 days before the event (iFactory Press Line Analytics, 2026), giving maintenance planners a scheduled intervention window rather than an emergency response.
The Five Press Subsystems and Their Degradation Signatures
Each press subsystem degrades through a different mechanism and produces a different signature in sensor data. The degradation AI model is trained separately for each subsystem because the failure physics, the relevant sensor signals, and the decay timeline are fundamentally different.
Know Which Press Needs Attention in Week 3 — Not After It Fails in Week 2
iFactory AI builds a health index for every press subsystem, models the decay trajectory, and gives your maintenance team a 14–60 day advance window to plan the intervention — not manage the emergency.
From Health Index to Asset Planning Decision
The health index and RUL forecast are not maintenance alerts — they are asset planning inputs. The distinction matters because the action triggered by a 3-week RUL is different from the action triggered by a 3-day alarm, and the people who need to act are also different.
| RUL Window | Health Index Range | Planning Action | Who Acts |
|---|---|---|---|
| 8–12 weeks | 75–90% | Flag in quarterly maintenance plan; order long-lead parts if required; include in next scheduled press overhaul window | Maintenance planner |
| 4–8 weeks | 55–75% | Schedule intervention in next available planned downtime window; pre-stage parts; brief technician team | Maintenance supervisor |
| 2–4 weeks | 35–55% | Confirm intervention date; check OEM schedule for best window; notify production planning of planned downtime impact | Maintenance supervisor + production manager |
| Under 2 weeks | Below 35% | Urgent scheduled intervention — elevate to plant director; assess run-to-failure risk vs planned downtime cost | Plant director + maintenance manager |
Frequently Asked Questions
How does the health index handle presses with very different ages and maintenance histories?
Each press gets its own baseline established from the first 4–6 weeks of monitored data — regardless of age. A 1990s press and a 2018 press each have their baseline set from their own sensor signals at a known-good condition point. Degradation is measured as deviation from that press's own baseline, not from a fleet average. See how per-press baselining is configured in a walkthrough.
What happens to the RUL forecast after a maintenance intervention?
After a confirmed maintenance event — a bearing replacement, hydraulic seal service, or guide re-shimming — the health index is reset to the post-intervention condition and a new decay trajectory begins from that point. The maintenance event is logged against the press record, so the system tracks how different interventions affect the subsequent decay rate for that subsystem. Ask our team how intervention events are logged and how they update the RUL model.
Does the degradation AI work on older presses without modern sensor arrays?
Yes. iFactory AI connects to older presses using a combination of existing signals (tonnage monitor, temperature, PLC fault log) and a small number of added sensors where critical signals are missing — typically a vibration sensor on the main bearing and a hydraulic particle counter. The full sensor array is not required to start; the model works with available signals and indicates where adding a sensor would materially improve RUL accuracy. Book a session to assess your current sensor coverage for each press.
Can the system produce a fleet-level health summary for a plant director?
Yes. The plant director view shows all presses ranked by current overall health index, with the subsystem driving the lowest score highlighted and the intervention timeline for each. The view can be filtered by press, production line, or risk threshold, and is accessible on mobile for walking-the-floor review. Ask our team how the fleet summary dashboard is configured for your press shop layout.
How accurate are the RUL estimates, and how should maintenance teams use them?
RUL estimates are probability ranges, not exact dates — expressed as a most-likely window (e.g. 3–5 weeks) with a confidence percentage. They should be used as planning inputs, not maintenance triggers: the trigger is the threshold crossing on the health index; the RUL gives the planning horizon. Accuracy improves over time as the model accumulates failure and intervention history for each press. See how confidence ranges are communicated to maintenance teams in a live walkthrough.
Turn Press Degradation Into a Scheduled Decision, Not a Reactive Event
iFactory AI builds a health index for every press subsystem, models decay trajectories from live sensor data, and delivers 14–60 day advance warning — so maintenance teams plan the intervention instead of managing the failure. Book a session built around your press fleet.