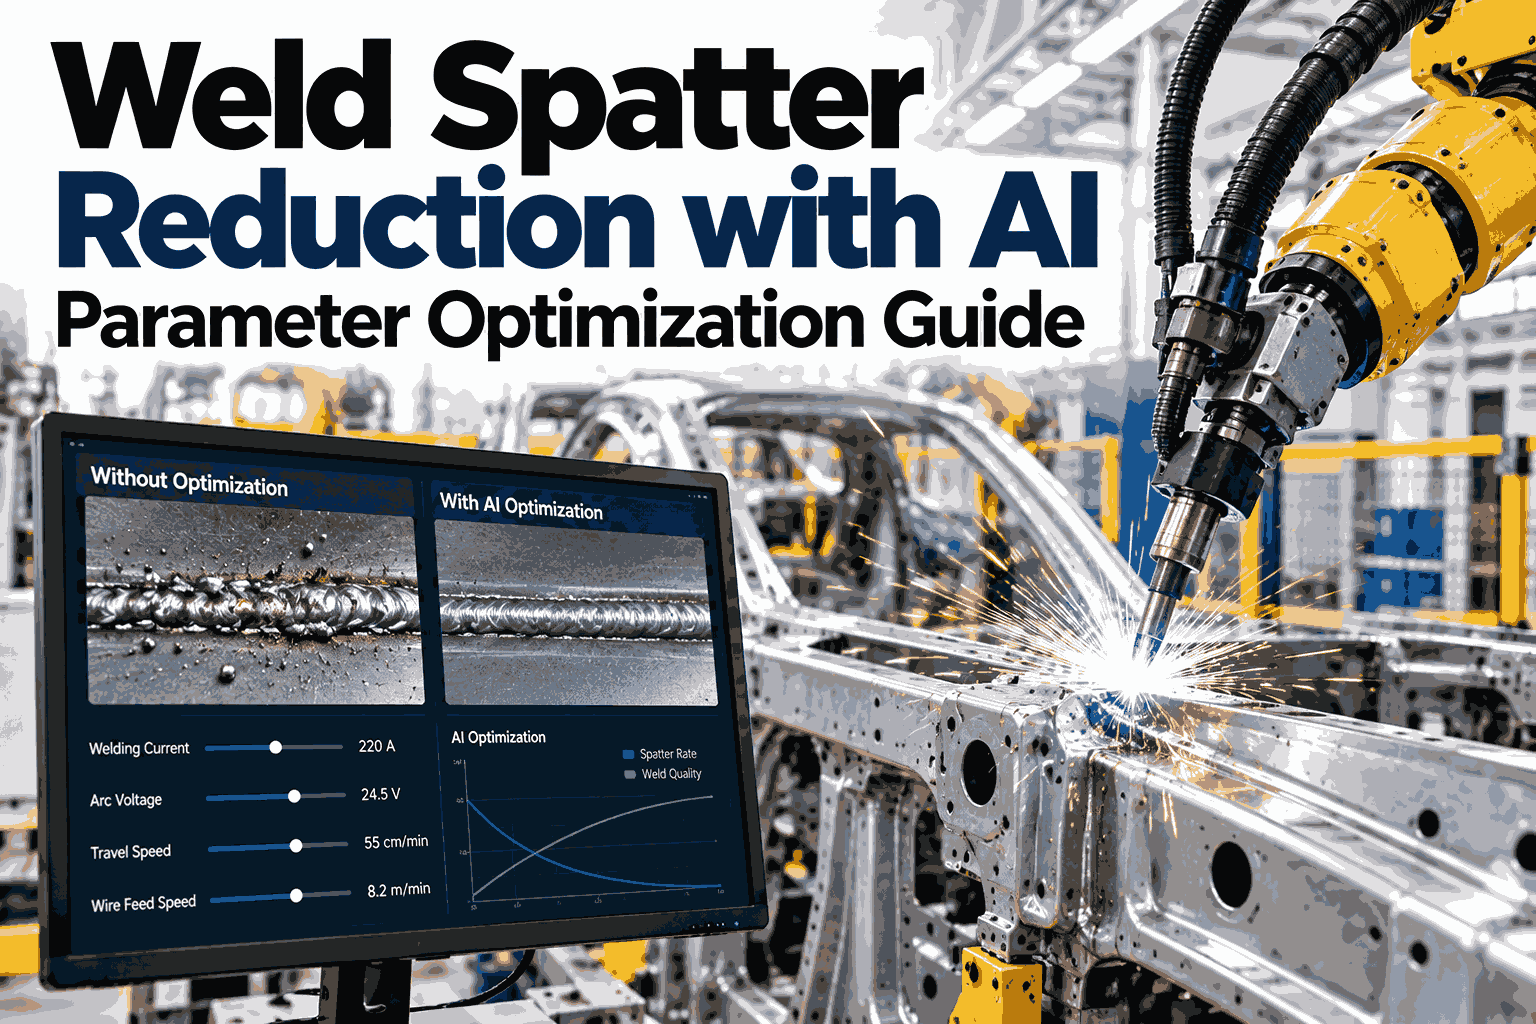
Weld spatter looks like a housekeeping problem until you count what it costs. Every bead of metal thrown from a joint has to be ground, brushed or scraped off, and on visible or sealed surfaces it can force a repair. It also wears tips and nozzles faster and hides real defects behind cosmetic ones. The cause is rarely one setting, but the interaction of current, force and joint condition. Automotive teams tuning welding cells can watch parameter optimization run on their own weld data and see where spatter starts.
Stop Cleaning Up Spatter. Stop Creating It.
iFactory Automotive Weld AI tunes current waveform, force profile and pre-heat against real-time quality prediction, so less metal leaves the joint and less labor follows it.
The Hidden Bill Behind Every Bead of Spatter
Cleanup labor is only the visible part. Follow one spatter event down the chain and the cost stacks up in places most reports never connect.
Spatter is also a symptom. A cell that sprays metal is usually telling you the joint is running outside its stable window.
Where Spatter Actually Comes From
Most spatter traces back to one of four conditions. Each leaves a different signature, which is why a single global setting rarely fixes it.
Current rises too fast
Heat concentrates at the interface before the joint has settled, and molten metal is pushed out.
Force too low or late
Weak contact lets the joint overheat locally and eject material at the edge.
Dirty or coated surfaces
Oil, scale and coatings vaporize under heat and throw metal with them.
Poor fit-up
Gaps force the electrode to close the joint mid-weld, creating an unstable start.
Anatomy of a Weld Schedule
A weld schedule is a shape drawn over time. Current and force each have a profile, and small changes to that shape decide whether the joint stays calm.
Three Levers AI Tunes Together
Engineers can tune these one at a time. The difficulty is that each lever changes how the others behave, and manual trial-and-error rarely explores the combinations.
Slope, pulse shape and peak level control how quickly heat builds at the interface.
Timing and level of electrode force keep contact tight through the hottest moment.
A short lead-in pulse softens surfaces and settles contact before the main current arrives.
See Which Lever Is Costing You Most
Bring one high-spatter station to a 30-minute session and we will show how AI parameter tuning approaches it.
The Closed Optimization Loop
AI tuning is not a one-time fix. It runs as a loop, learning from every weld and adjusting within limits your engineers set.
The engineer stays in charge. AI proposes, and the weld schedule changes only after a person signs off.
What Changes on the Floor
Reducing spatter at the source shifts labor away from cleanup and toward work that adds value. The bars below show the direction, not a promised figure.
Matching the Fix to the Symptom
Use this table as a starting point when a station begins throwing metal. AI narrows it down using the actual weld signals.
| What You See | Likely Driver | First Lever to Try |
|---|---|---|
| Spatter at weld start | Current ramps too quickly | Soften the current slope |
| Spatter at the edge late in weld | Force drops or arrives late | Adjust force timing and level |
| Bursts on coated stacks | Coating vaporizing under heat | Add or lengthen pre-heat |
| Random, station-specific | Tip wear or fit-up variation | Trend the station, then service |
A Quick Station Checklist
Before changing any parameter, confirm the basics. AI performs best when the mechanical foundation is sound.
Frequently Asked Questions
Will reducing spatter weaken the weld?
It should not. Optimization is checked against nugget and strength limits before any change is approved. The aim is a calmer weld that still meets specification. See how strength limits are enforced during tuning in a live session.
Does AI change our weld parameters automatically?
Not without approval. The system proposes adjustments and shows the predicted effect on spatter and quality. Your engineers review and release changes, so accountability stays with your team and your standards.
Which materials benefit most?
Coated and mixed-thickness stacks tend to show the biggest gains because they are the most sensitive to heat and contact. Every stack still needs its own reference. Talk through your material mix with our engineers on a short call.
What data is needed to get started?
Weld current, voltage, force and timing per spot, plus a record of rework or cleanup events. Most controllers already log the signals. The cleanup data is what connects spatter to real labor cost.
How long before we see results on a pilot cell?
That depends on weld volume and how much history exists. High-volume cells generate enough data quickly, while low-volume ones take longer. Map out a realistic pilot timeline with us before you commit.
Cut Spatter at the Source, Not at the Grinder
Bring one station with heavy cleanup and your controller data. We will show how AI parameter optimization finds a calmer weld schedule.