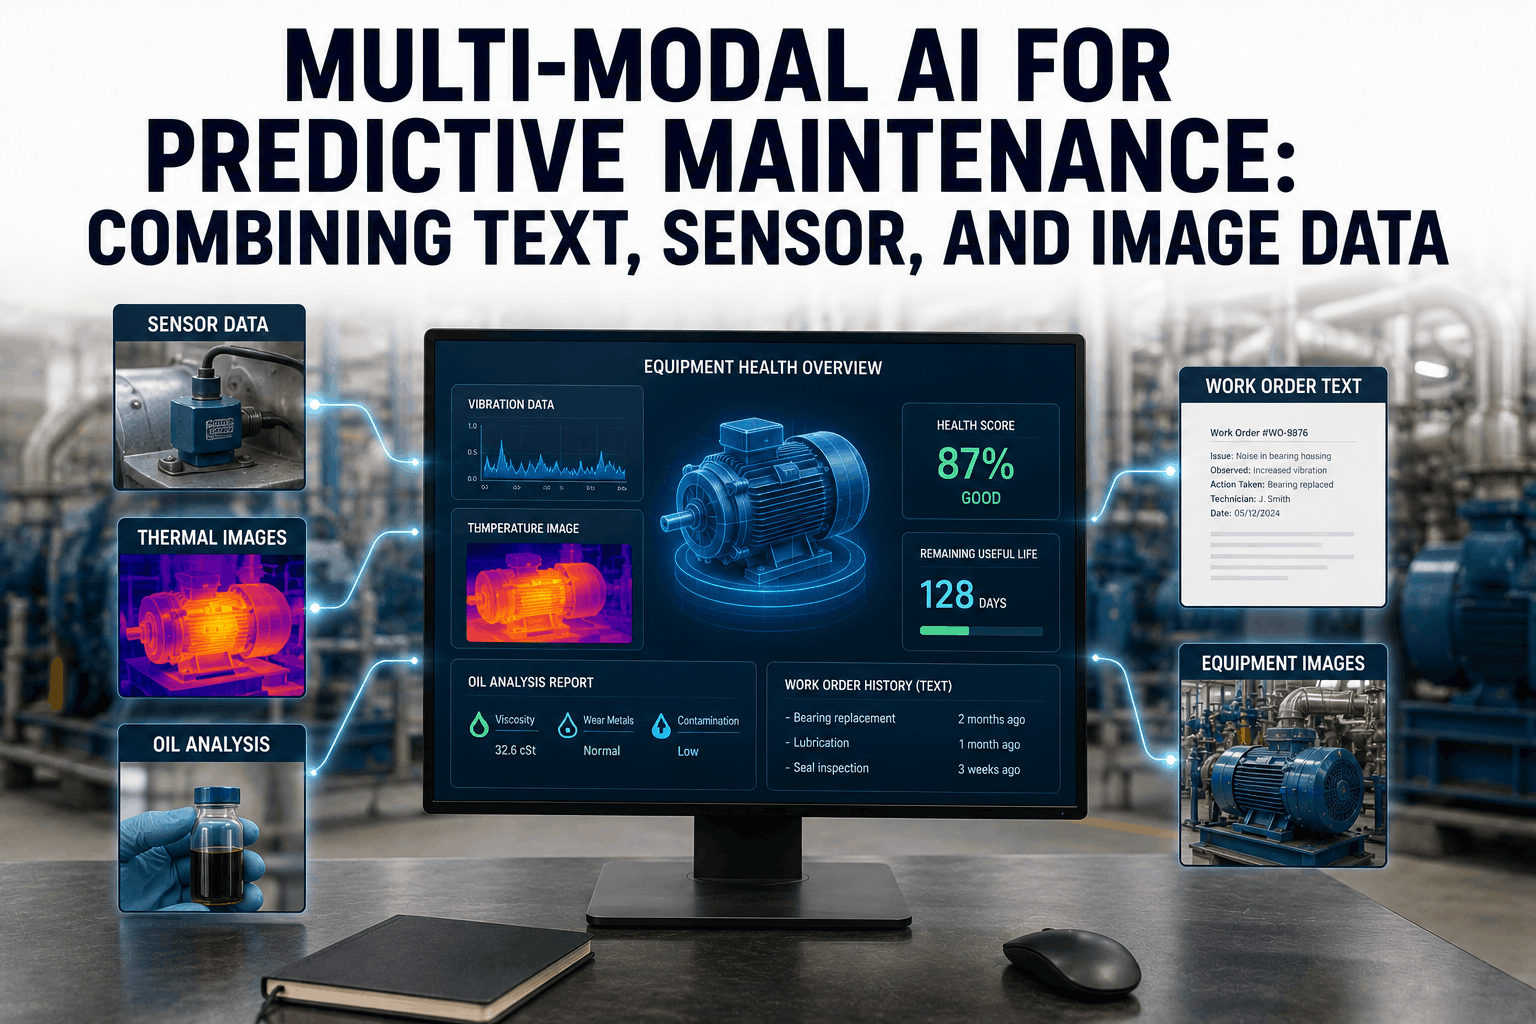
Multi-modal AI fuses vibration data, thermal images, oil analysis reports, and work order text to build complete equipment health profiles that single-sensor monitoring systems cannot produce. Start Trial Free to see how iFactory integrates sensor streams, imagery, and maintenance records into unified asset health intelligence for industrial predictive maintenance programs.
Unify Sensor Data, Thermal Images, and Maintenance Text into One Health Profile
iFactory's multi-modal AI combines every data type your equipment produces — vibration signals, thermograms, oil lab reports, and work order narratives — into a single, continuously updated equipment health profile.
Why Single-Sensor Monitoring Misses Equipment Failures Multi-Modal AI Detects
A vibration sensor that shows normal readings while a thermal camera reveals a developing hot spot represents a failure that single-channel monitoring will not detect until the thermal anomaly progresses to mechanical vibration — potentially weeks later. Multi-modal AI eliminates this blind spot by correlating signals across modalities: the vibration baseline, the thermal trend, the lubricant particle count, and the technician observation from the last inspection all contribute to a health assessment that is more specific and earlier than any single channel can produce. Maintenance teams that Book a Demo with iFactory see how data fusion across modalities changes the detection lead time on equipment failures that previously appeared without warning.
-
Vibration Signal Processing
iFactory processes raw vibration time-series from accelerometers and proximity probes — extracting frequency domain features and comparing them against baseline signatures for each specific asset unit.
-
Thermal Image Analysis
iFactory applies computer vision to thermographic images — identifying anomalous heat patterns, comparing against historical thermal baselines, and correlating temperature deviations with concurrent sensor and text data.
-
Oil Analysis Report Parsing
iFactory reads laboratory oil analysis reports as structured text — extracting particle counts, viscosity measurements, and elemental wear data and integrating them with real-time sensor readings in the health profile.
-
Work Order Text Extraction
iFactory processes maintenance record narratives from closed work orders — identifying symptom descriptions, technician observations, and anomaly notes that correlate with sensor data patterns before failure.
-
Cross-Modal Correlation Engine
iFactory's fusion model identifies relationships between signals across modalities — weighting data sources based on historical predictive value for each equipment class and failure mode combination.
-
Continuous Health Score Update
iFactory updates each asset's health score as new data arrives from any modality — reflecting the most current multi-source view rather than polling each data type on separate schedules.
Multi-Modal Data Sources in Industrial Predictive Maintenance
-
Vibration and Acoustic Sensor Data Fusion
Primary ModalityVibration and acoustic emission data from rotating equipment contains frequency domain information that correlates with specific mechanical failure modes — bearing defect frequencies, gear mesh harmonics, imbalance signatures, and looseness patterns. Multi-modal AI processes raw waveform data, extracts frequency domain features through FFT analysis, and compares derived features against equipment-specific failure mode signatures rather than generic threshold alarms. Combined with acoustic data from nearby emission sensors, the model can distinguish between sources in multi-component assemblies that a single accelerometer cannot localize. Teams that Start Trial can begin connecting vibration data streams from existing accelerometer installations to iFactory's fusion engine.
Data Input
Raw time-series from accelerometers and acoustic emission sensors
Feature Extraction
FFT frequency domain analysis, RMS, kurtosis, crest factor
iFactory Record
Waveform history linked per asset with failure event annotation
-
Thermal Imaging and Infrared Data Processing
Visual ModalityThermal images capture surface temperature distributions across equipment components — revealing insulation breakdown, electrical connection degradation, bearing thermal signatures, and process heat transfer anomalies that vibration sensors and process instruments do not detect. iFactory's computer vision layer processes thermographic images through anomaly detection models trained on equipment-type-specific thermal baselines — identifying developing hot spots before they cross threshold temperatures that trigger process alarms. Temporal comparison of thermal images taken during regular inspection routes adds a trend dimension to point-in-time thermal readings, improving differentiation between environmental thermal variation and structural equipment anomalies. Teams that Book a Demo can see how iFactory integrates thermal inspection workflows with sensor data streams.
Data Input
Thermographic images from IR cameras during inspection routes
CV Processing
Anomaly detection against equipment-specific thermal baselines
iFactory Record
Thermal image archive with trend comparison per asset
-
Oil and Fluid Analysis Report Integration
Chemical ModalityLaboratory oil analysis reports contain particle count, elemental wear, viscosity, water contamination, and additive depletion data that reflects internal mechanical wear rates and lubricant condition before external symptoms appear. iFactory parses oil analysis laboratory reports as structured text — extracting numerical values, trend indicators, and severity classifications from report formats across major laboratory providers without requiring laboratory API integration. Cross-referenced against vibration and thermal data from the same period, oil analysis findings help differentiate between mechanical wear progression and lubrication system issues — leading to more targeted maintenance interventions than either data type produces independently.
Data Input
Laboratory report PDFs or exports from oil analysis providers
Extraction Output
Particle counts, elemental wear data, viscosity, contamination
iFactory Record
Oil analysis results linked to concurrent sensor data timeline
-
Maintenance Text and Work Order Narrative Processing
Textual ModalityTechnician observations recorded in work order narratives contain early failure indicators that precede detectable sensor changes — descriptions of unusual sounds, intermittent behavior, increased effort to operate manual components, or visual anomalies noted during rounds. Natural language processing applied to work order text extracts these unstructured signals and correlates them temporally with sensor data from the same equipment — building a pre-failure narrative record that improves the training accuracy of the multi-modal failure prediction model. Over time, the correlation between specific text patterns and subsequent failure events provides the model with leading indicators derived from human observation that instruments cannot capture.
Data Input
Closed work order narratives and inspection finding text
NLP Output
Extracted symptom signals correlated to sensor data timeline
iFactory Record
Text signal history linked to failure event outcomes
-
Process and Environmental Context Integration
Operational ModalityEquipment operates under varying load, speed, temperature, and process conditions that affect how sensor signals should be interpreted — a bearing vibration signature that indicates a defect at rated speed may be normal at reduced load. iFactory integrates process historian data — production rate, throughput load, inlet conditions, and ambient environment readings — into the multi-modal health model as contextual normalization inputs. Health assessments produced with operating context normalization reduce false positives from condition changes unrelated to equipment degradation, improving the signal-to-noise ratio of the predictive maintenance output. Teams that Start Trial can configure process context integration for each monitored asset class.
Data Input
Process historian exports, DCS data, load and speed signals
Context Output
Normalized health scores adjusted for operating conditions
iFactory Record
Operating context recorded per health assessment data point
-
Inspection Image and Visual Record Processing
Field Visual ModalityField inspection photographs taken during PM rounds or condition monitoring routes contain visual information about surface condition, corrosion progression, leakage, and component wear that structured inspection forms cannot fully capture. iFactory's computer vision processing applies to field inspection images — identifying surface anomaly patterns, comparing against baseline reference images, and flagging deviations for corrective work order generation. Integrated with sensor data trends, visual anomaly detection adds a spatial dimension to the health profile that accelerates deficiency identification in equipment not fully covered by installed sensor networks. Teams that Book a Demo can review field image integration workflows in the iFactory mobile interface.
Data Input
Inspection photographs from PM rounds and condition monitoring routes
CV Processing
Surface anomaly detection with baseline image comparison
iFactory Record
Visual finding linked to corrective work order generation
Multi-Modal Predictive Maintenance Performance Indicators
Detection Lead Time by Modality
Multi-modal fusion extends average failure detection lead time to 42 days versus 26 days for vibration-only monitoring across rotating equipment benchmarks.
False Positive Rate Reduction
False positive alert rate declines as the multi-modal model adapts to operating context — reaching below 10% by month 12 across industrial data fusion benchmarks.
Health Score Confidence by Data Sources
Health assessment confidence increases with each additional data modality integrated — reaching 96% confidence with four active source types per asset.
Failure Mode Coverage Expansion
Multi-modal AI covers 91% of equipment failure modes versus 40% for single-sensor systems — including failure modes that produce no vibration signature until late-stage progression.
Multi-Modal AI Data Fusion: Reference Specifications
Scroll for more
| Data Modality | Input Format | Processing Method | iFactory Integration | Update Frequency |
|---|---|---|---|---|
| Vibration and Acoustic | Raw time-series waveform | FFT, frequency feature extraction | Sensor API or historian export | Continuous or hourly |
| Thermal Imaging | Thermographic image files | CV anomaly detection, baseline comparison | Mobile inspection upload | Per inspection route |
| Oil Analysis Reports | Laboratory PDF reports | Structured text extraction, NLP parsing | Document upload pipeline | Per sample submission |
| Work Order Text | Closed work order narratives | NLP symptom extraction, temporal correlation | Work order database link | Per WO closure |
| Process Context Data | Historian export, DCS feeds | Context normalization for health scores | Historian API integration | Real-time or per shift |
How iFactory Implements Multi-Modal AI for Predictive Maintenance
Complete equipment health intelligence requires more than threshold monitoring on individual sensor channels — it requires a model that understands how different signals relate to each other and to the failure modes specific to each equipment class. iFactory builds this understanding by fusing structured sensor data, computer vision outputs from thermal and inspection images, natural language signals from work order text, and process context data into a continuously updated health profile for each asset. When iFactory's multi-modal model identifies a bearing that shows increasing vibration RMS, a subtle thermal asymmetry from the previous inspection round, and elevated iron particle count from the last oil analysis, it produces a converged health assessment with quantified confidence that no single data stream can generate. Facilities can Start Trial and begin building multi-modal health profiles from their existing data sources within the first deployment session.
Sensor Data Fusion Engine
iFactory processes vibration, temperature, pressure, and flow sensor streams together — correlating signals from multiple measurement points to produce equipment health assessments that individual channel thresholds cannot generate.
Computer Vision Processing Layer
iFactory applies anomaly detection to thermal and inspection images — comparing against asset-specific visual baselines and correlating image findings with concurrent sensor data for converged health scoring.
Natural Language Signal Extraction
iFactory processes work order narratives and inspection text through NLP models — extracting symptom signals that precede detectable sensor changes and integrating them into the pre-failure pattern library.
Unified Health Score Dashboard
iFactory aggregates all modality inputs into a single, continuously updated health score per asset — ranking equipment by degradation rate and confidence level to prioritize maintenance intervention across the full portfolio.
Deploying Multi-Modal AI Predictive Maintenance: Implementation Steps
01
Inventory Available Data Sources by Asset
Map which data modalities are currently available for each equipment class — installed sensors, inspection image workflows, oil analysis schedules, and work order history — to identify the multi-modal baseline for each priority asset.
02
Connect Active Sensor Streams to iFactory
Configure sensor API connections or historian exports to feed vibration, temperature, and process data into iFactory's fusion engine — establishing the real-time data foundation for health score generation.
03
Establish Visual Inspection Integration
Deploy iFactory's mobile inspection interface to field technicians for thermal and visual image capture during PM rounds — linking inspection images to asset records and enabling computer vision processing against established baselines.
04
Upload Historical Data for Model Training
Load historical work order records, past oil analysis reports, and sensor historian archives into iFactory — providing the pre-failure pattern data that trains the multi-modal correlation model for each equipment class.
05
Configure Health Score Thresholds and Alerts
Define health score degradation thresholds and alert routing in iFactory for each equipment class — setting the intervention triggers that activate maintenance work orders when multi-modal confidence reaches the action threshold.
06
Validate and Expand Based on Outcomes
Review iFactory's predictive alert accuracy against maintenance outcomes quarterly — using detection lead time and false positive rate data to validate model performance and expand multi-modal coverage to additional asset classes. Book a Demo to see the full deployment workflow.
Frequently Asked Questions
What is multi-modal AI in predictive maintenance?
Multi-modal AI refers to machine learning systems that process and correlate data from multiple source types simultaneously — combining sensor time-series, image data, text records, and process context to produce equipment health assessments with higher accuracy and earlier detection than single-source models.
How does iFactory fuse data from different modalities?
iFactory's fusion engine processes each modality through a dedicated extraction layer — frequency analysis for sensor data, computer vision for images, NLP for text — and then combines derived features through a correlation model trained on equipment-specific historical failure patterns.
What minimum data sources are needed to implement multi-modal AI?
Meaningful multi-modal health profiles can be built with as few as two modalities — for example, vibration data combined with work order text history. Detection performance improves with each additional modality, and iFactory is designed to add modalities incrementally as data sources become available.
How long before multi-modal AI produces reliable predictive alerts?
For equipment classes with existing failure event history, multi-modal models can produce calibrated health scores within the first month of deployment. For equipment without historical failure data, model accuracy improves over the first six months as the correlation engine accumulates operating pattern data.
Can iFactory integrate with existing sensor infrastructure and historians?
Yes. iFactory connects to process historians, OPC-UA servers, and sensor data platforms through API integration and batch export formats — enabling multi-modal fusion without replacing existing sensor infrastructure or data collection systems.
Build Complete Equipment Health Profiles from Every Data Source You Already Have
iFactory's multi-modal AI integrates sensor streams, thermal images, oil analysis reports, and maintenance text into unified health intelligence — giving predictive maintenance programs the detection accuracy and lead time that single-channel monitoring cannot match.