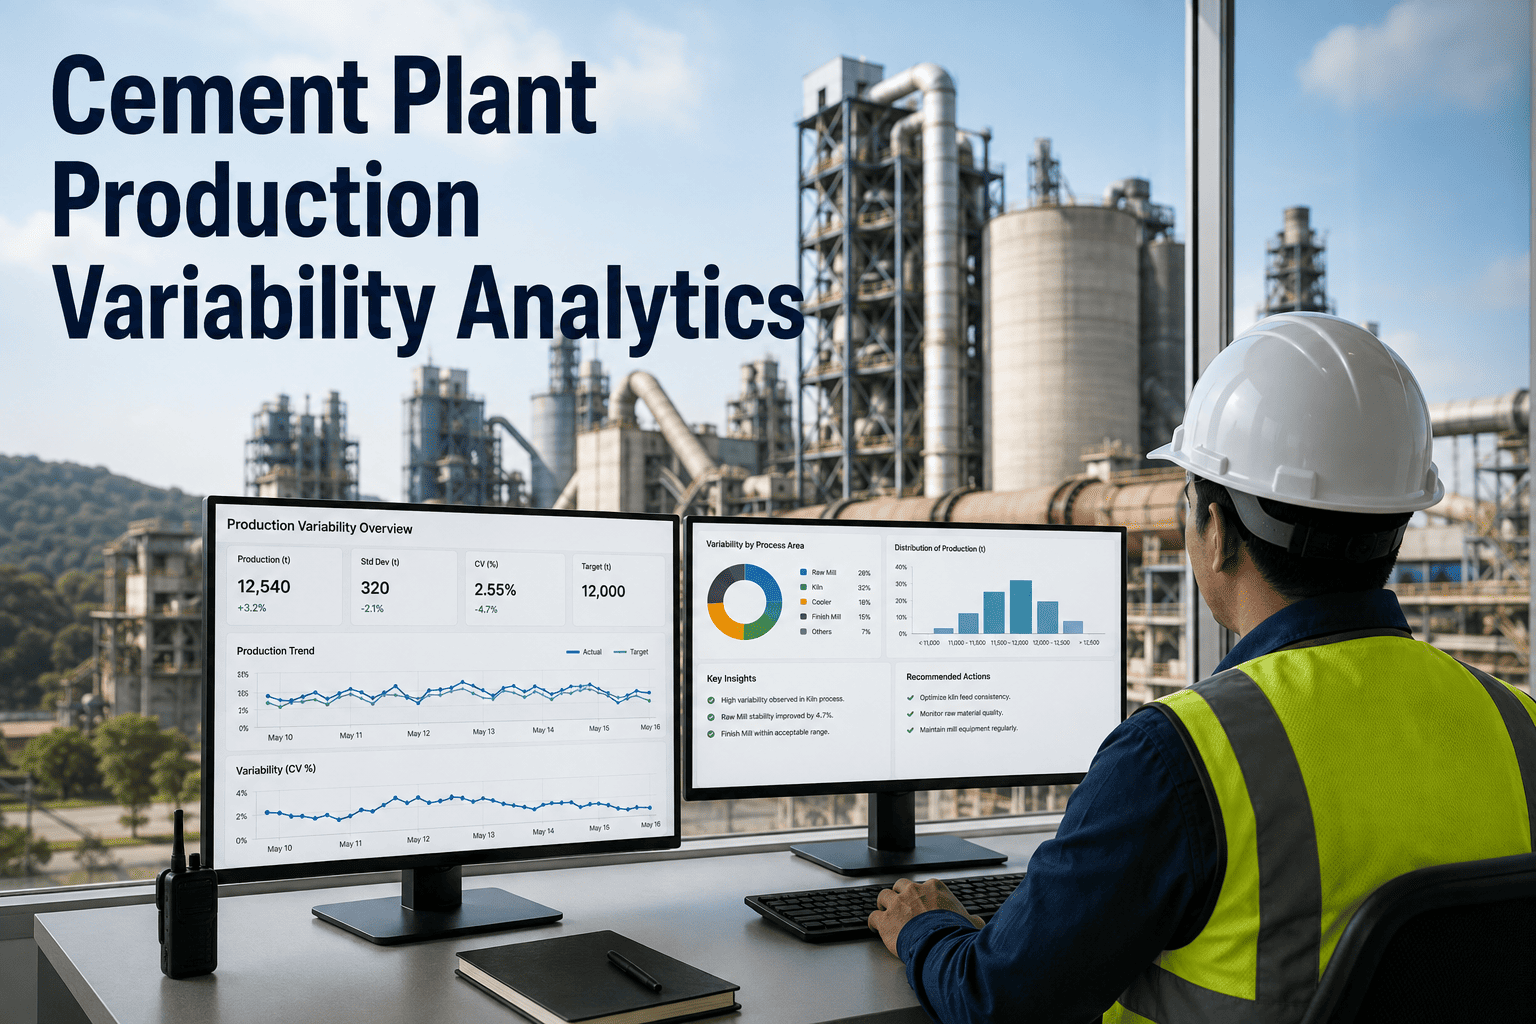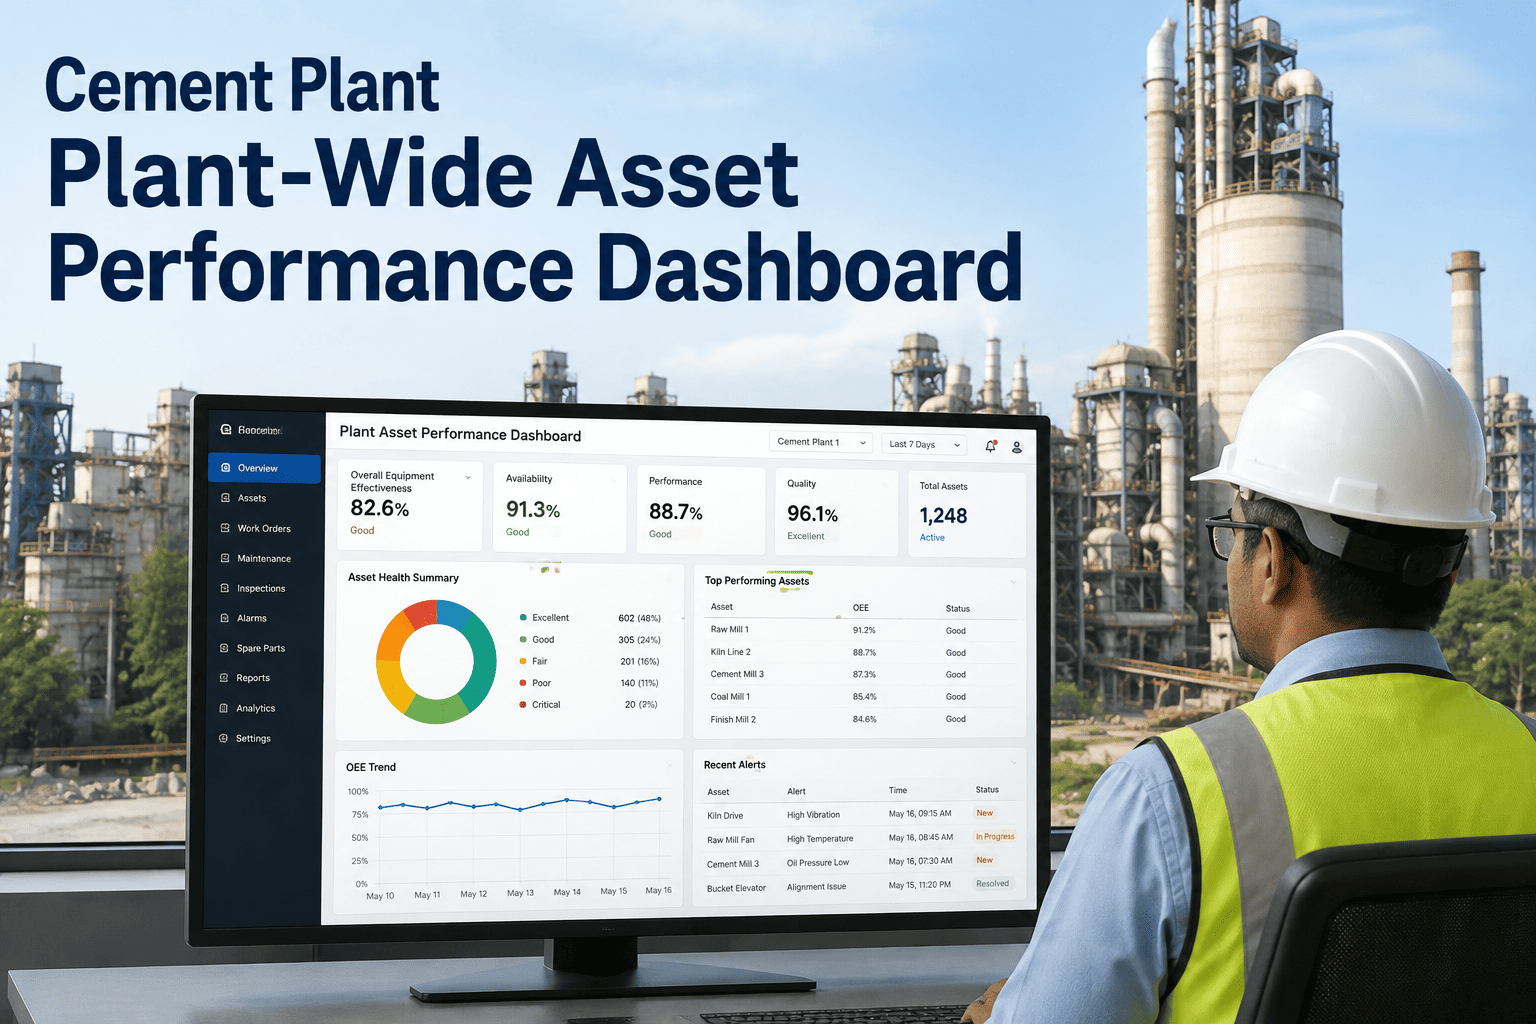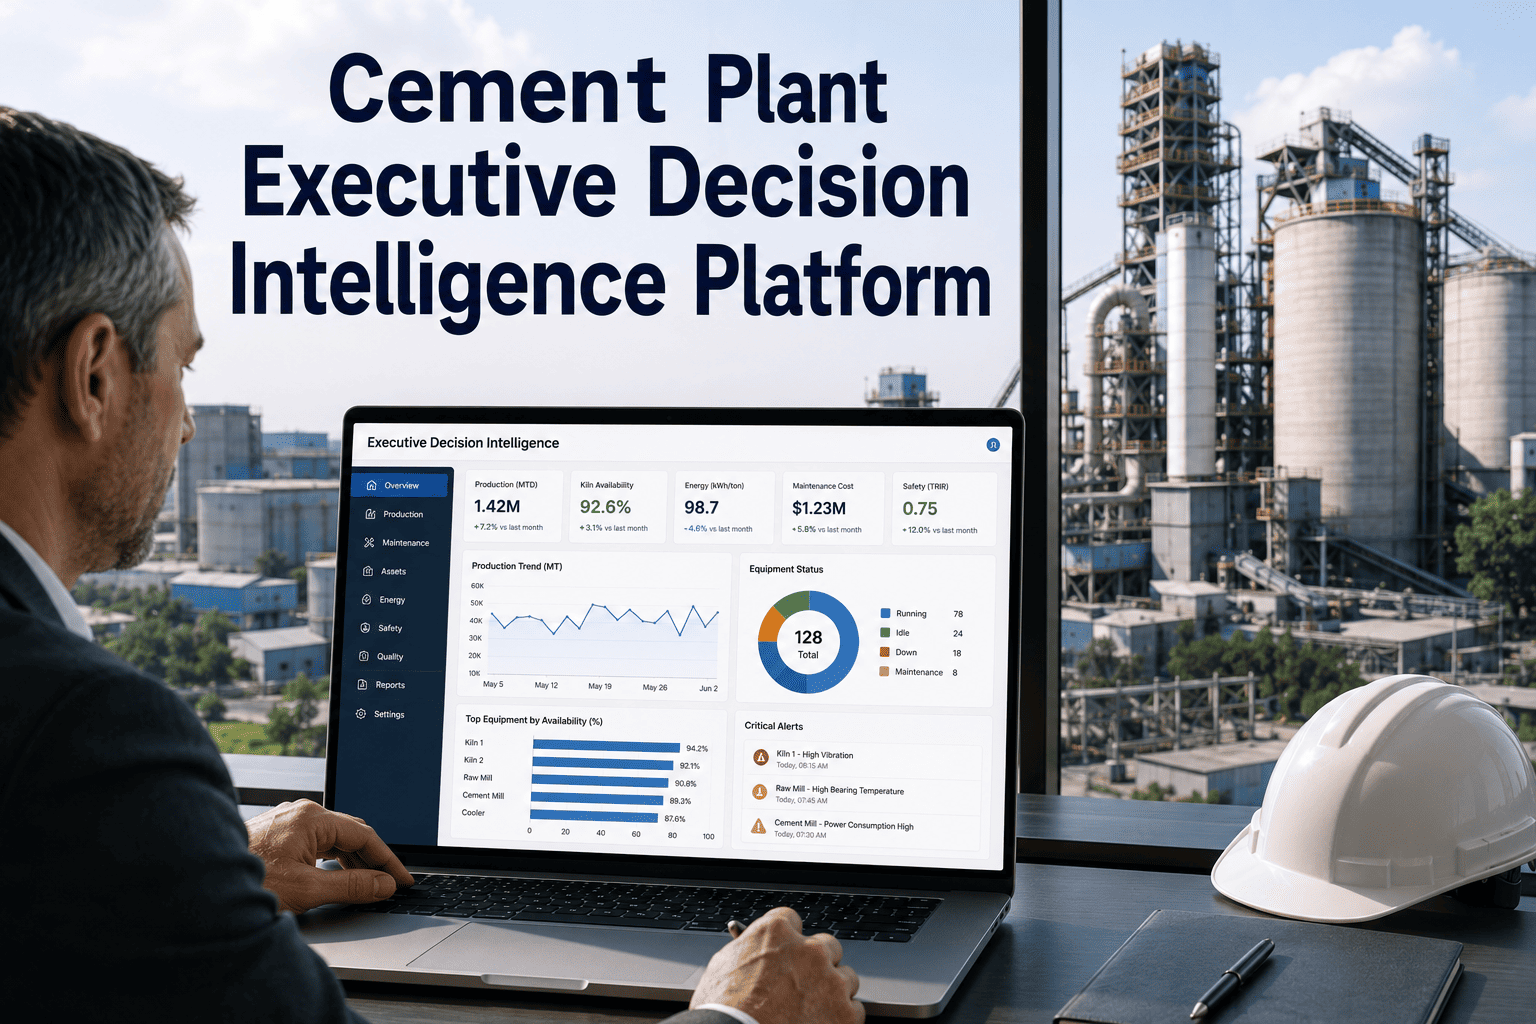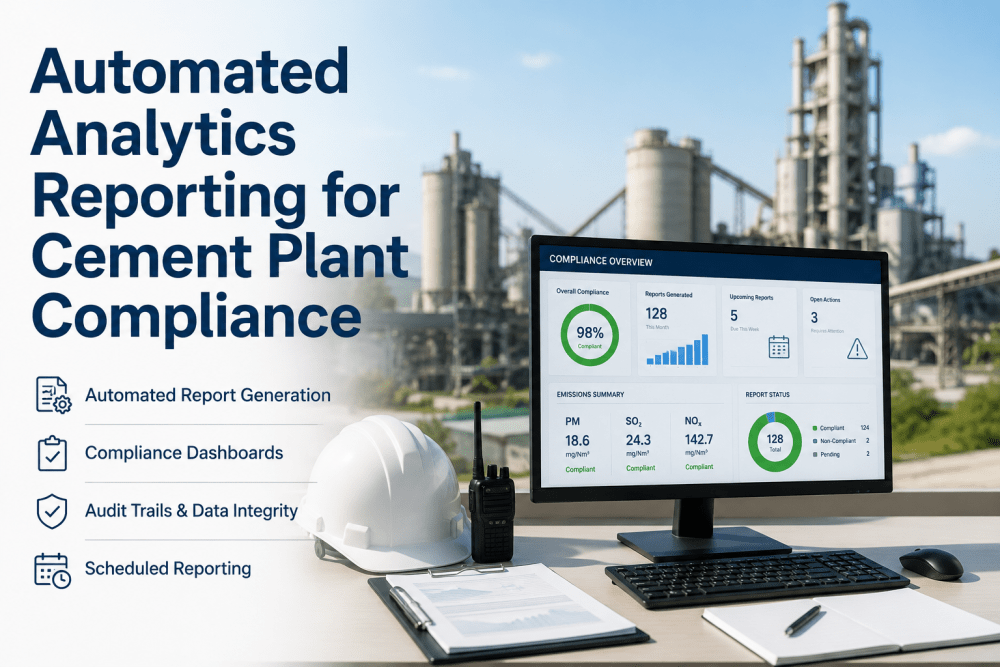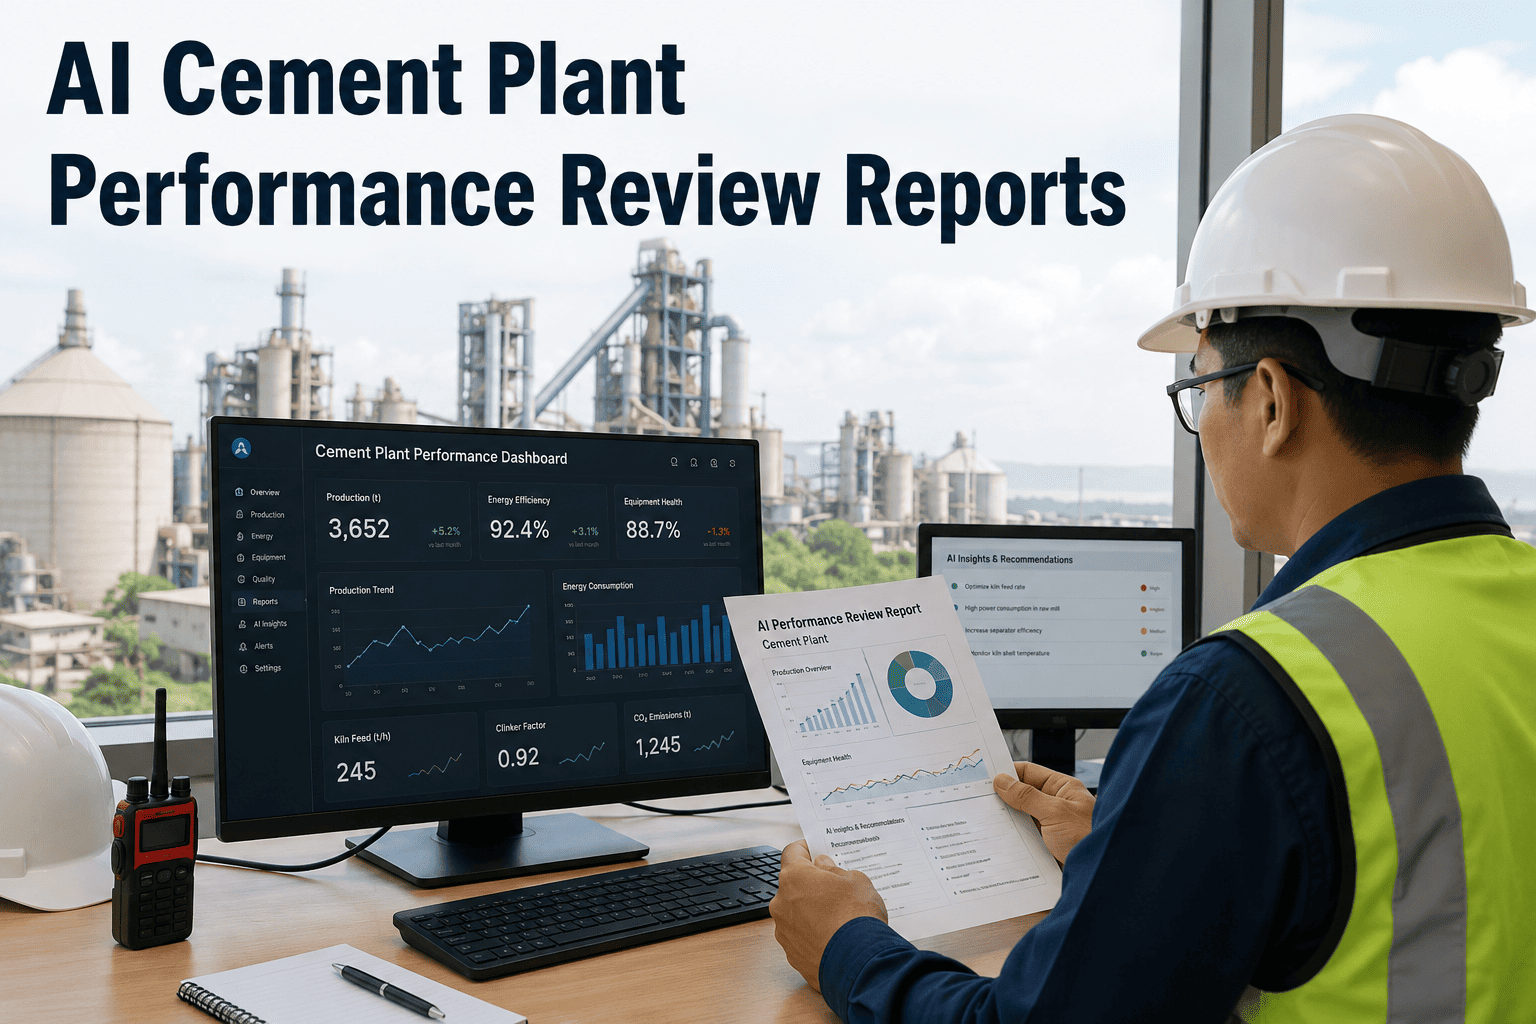
Cement plants generate thousands of data points per minute across kiln control systems, grinding circuits, quality labs, and maintenance logs, yet most plant managers receive their monthly performance review as a static spreadsheet that took a junior engineer two weeks to assemble. The data in that spreadsheet was current when it was exported, but by the time it is formatted, reviewed, and distributed, it is already three weeks old and completely disconnected from the operating decisions being made on the floor today. AI-generated performance reports eliminate the manual extraction and formatting pipeline entirely by connecting directly to plant data sources, automatically correlating production drops with maintenance events and energy spikes, and delivering a structured narrative report that highlights exactly what changed, why it changed, and what the projected impact is. Book a reporting automation review to see how iFactory turns your raw plant data into a finished monthly performance report without manual Excel work.
Stop Assembling Monthly Reports That Are Outdated Before You Finish Them
AI performance review reports connect to your cement plant data systems, automatically calculate production, energy, maintenance, and reliability metrics, and generate a complete monthly narrative report in minutes instead of weeks.
The Manual Reporting Trap in Cement Manufacturing
The conventional monthly performance review process in a cement plant follows a predictable and deeply inefficient pattern that consumes engineering resources without producing proportional insight. Data is exported from multiple disconnected systems, stitched together in spreadsheets, formatted for presentation, and circulated for review. By the time the final report reaches the plant manager or corporate management, the operating conditions it describes have evolved significantly, and the recommendations it contains are based on a snapshot that no longer reflects reality.
Plant engineers manually query the distributed control system for kiln and mill operating parameters, export work orders from the computerized maintenance management system, pull quality lab results for clinker and cement, and attempt to align timestamps across systems that do not share a common time base. The extraction phase alone consumes more than a full working day because each system requires different query formats, different time range selections, and different export protocols that cannot be automated without an integration layer.
Once data is exported, the real work begins. Shift handover times create data gaps, sensor calibrations create step changes in readings that must be filtered, and maintenance system timestamps often reflect when a work order was closed rather than when the actual repair was performed. Engineers spend hours manually cleaning this data to create a coherent time series, and every manual cleaning step introduces the risk of accidentally altering the underlying trends or discarding legitimate anomalies that would have been valuable performance indicators.
The final phase of manual reporting is pure presentation: creating charts that show the metrics management expects to see, writing text that explains the visible trends, and formatting everything into a document structure that has remained largely unchanged for decades. This commentary is almost always descriptive rather than analytical because the engineer assembling the report does not have time to perform the deep correlation analysis that would reveal root causes. They describe what happened, not why it happened, which limits the actionable value of the entire exercise.
The Four Pillars of an AI-Generated Cement Performance Report
An AI performance report is not simply a formatted version of the same data that appears in a manual spreadsheet. It is a structured analytical document built on four pillars, each of which requires the AI to process raw time-series data through specific calculation engines and correlation logic to produce insights that manual reporting cannot reliably generate at monthly intervals.
The production pillar goes beyond total tonnage to calculate clinker factor trends, kiln feed rate stability coefficients, and the correlation between raw meal chemistry deviations and clinker quality results. The AI identifies specific time windows where kiln instability reduced effective production rate, quantifies the production loss in tons, and cross-references those windows with operating parameter changes such as oxygen levels, burner adjustments, or raw mix variations. This level of time-correlated production analysis is almost never present in manual reports because it requires minute-by-minute data processing across multiple variables simultaneously, which exceeds what a spreadsheet analyst can accomplish in a reasonable timeframe.
Energy reporting in a manual review typically reports average specific heat consumption in kilocalories per kilogram of clinker and average specific power consumption in kilowatt-hours per ton of cement for the month. The AI report calculates these same metrics but breaks them down by operating mode, product type, and time of day, revealing patterns that monthly averages completely obscure. For example, the AI might identify that specific heat consumption is consistently 40 kilocalories per kilogram higher during night shifts when a specific operator is running the kiln, or that power consumption per ton in the finish mill spikes whenever the separator speed is adjusted above a certain threshold. These granular patterns are the actionable insights that drive real efficiency improvements, and they are invisible in monthly averages.
The maintenance pillar connects work order data from the CMMS with equipment runtime data from the DCS to calculate true mean time between failures and mean time to repair for critical equipment including the kiln, raw mill, cement mill, and crusher systems. More importantly, the AI correlates failure events with preceding operating conditions to identify failure precursors. If the baghouse differential pressure trended upward for three days before a fan trip, or if the vertical roller mill vibration amplitude increased gradually over two weeks before a bearing failure, the AI report documents that precursor pattern and flags it as a predictive indicator for future maintenance planning.
Quality reports in manual reviews typically present lab results in isolation: clinker free lime, cement blaine, setting times, and compressive strengths plotted over time. The AI report overlays these quality results against the process parameters that drove them, calculating the statistical correlation between kiln temperature profiles and free lime results, or between separator efficiency changes and blaine fineness variations. This correlation analysis transforms the quality report from a record of what was produced into an explanation of why specific quality results occurred, enabling process engineers to adjust operating parameters proactively rather than reacting to quality deviations after the fact.
From Data Silos to Integrated Insights
Cement plants typically operate with three to five separate data systems that do not communicate with each other. The AI reporting engine connects to each system, normalizes the data, and performs cross-system correlations that are impossible when data lives in separate silos. The table below shows the typical data sources in a cement plant and the specific insights that become available only when those sources are combined through automated integration.
Let AI Write Your Next Monthly Performance Review
iFactory connects to your DCS, CMMS, lab, and energy systems, calculates the correlations manually assembled reports miss, and generates a complete production, energy, maintenance, and reliability report automatically every month.
One Data Source, Two Report Views: Executive and Plant Floor
A single set of AI-analyzed plant data serves two fundamentally different audiences with completely different information needs. The executive view answers the question of whether the plant is on track strategically, while the plant floor view answers the question of what specifically needs to change operationally. Generating both views from the same automated analysis ensures that management and operations are looking at the same underlying truth, just presented at the appropriate level of detail for each audience.
How AI Detects What Manual Reports Miss: A Kiln Stability Example
The value of AI reporting is most visible when the system identifies a performance pattern that spans multiple data systems and would be virtually impossible for a manual analyst to detect within the time constraints of a monthly reporting cycle. The following sequence shows how the AI traces a subtle kiln stability problem from a production symptom through energy and maintenance data to a root cause that explains the entire pattern.
Production Data Flags a Rate Drop
The AI engine calculates kiln feed rate stability and detects that the coefficient of variation for feed rate increased by 35 percent during the second week of the reporting period. Total production for the week was only 4 percent below target, which would not trigger an alarm in a manual report that looks only at weekly totals. But the AI catches the stability degradation because it analyzes the minute-by-minute variance, not just the aggregate total, and flags it as a leading indicator of process upset even though the tonnage impact has not yet become severe enough to appear in summary metrics.
Energy Data Shows the Cost of Instability
Cross-referencing the instability window with energy data, the AI calculates that specific heat consumption increased by 55 kilocalories per kilogram during the same period when feed rate stability degraded. The manual report would show a monthly average heat consumption increase of perhaps 8 kilocalories per kilogram, diluted across the stable periods. The AI isolates the cost to the specific instability window and quantifies it as 120 tons of additional fuel consumed during those seven days, directly attributable to the operating instability that the production data identified in step one.
Process Data Identifies the Mechanism
Drilling into the DCS data for the instability window, the AI identifies that the secondary air temperature became highly variable, swinging by plus or minus 40 degrees Celsius on a 15-minute cycle, while the oxygen setpoint remained constant. This pattern is consistent with periodic false air ingress at the kiln inlet seal, which would explain both the feed rate instability caused by fluctuating burning zone conditions and the heat consumption increase caused by excess cold air diluting the combustion atmosphere. A manual analyst might notice the temperature swings if they happened to look at that specific trend during that specific week, but the AI examines every trend for every reporting period without exception.
Maintenance Data Confirms the Root Cause
Finally, the AI queries the maintenance system and finds that a work order was closed three weeks before the reporting period for adjustment of the kiln inlet seal, but a subsequent inspection note indicates the seal gap was at the upper limit of the acceptable range. The AI report connects all four data points into a single narrative: the kiln inlet seal, adjusted to the edge of tolerance three weeks ago, has degraded further and is now causing intermittent false air ingress that is driving secondary air temperature swings, feed rate instability, and excess fuel consumption. The recommended action is specific and timed: inspect and adjust the kiln inlet seal before the next reporting period to recover the 55 kilocalories per kilogram heat consumption penalty.
What Changes When AI Generates Your Monthly Reports
Figures from cement plants that transitioned from manual spreadsheet-based performance reporting to AI-generated automated reporting within the first six months of deployment.
A Cement Plant Manager on Reclaiming Engineering Time
We had a process engineer who spent the first two weeks of every month building the performance report for our three-kiln complex. It was a massive spreadsheet with links to data files that broke constantly, and by the time she finished, the report was so outdated that the shift supervisors had already moved past the issues it described. When we implemented automated reporting, the first report ran on the second day of the month and included a correlation between our raw mill vibration trend and a specific feed material change that nobody had ever noticed because nobody had ever had time to plot those two variables together on the same timeline. That single finding paid for the entire first year of the reporting system in avoided maintenance costs, and we got our process engineer back to actually improving the process instead of formatting charts.
Frequently Asked Questions
How does the AI reporting system connect to our existing plant data infrastructure?
The reporting engine connects to your plant systems through standard industrial protocols including OPC UA for DCS and SCADA data, ODBC or REST APIs for CMMS and ERP systems, and direct database connections for laboratory information management systems. The integration does not require changes to your existing control system configuration or network architecture. The reporting system reads data from these sources on a scheduled basis, typically daily, and stores it in a dedicated analytics layer that performs the calculations and correlations without putting any load on your production systems. Book a demo to see the specific integration options for your DCS and CMMS platforms.
Can we customize the report structure and KPIs to match our corporate reporting standards?
Yes, the entire report structure is configurable to match your corporate template, including the specific KPIs displayed, the calculation methodologies used, the threshold values that determine red, yellow, and green status indicators, and the narrative tone and language of the AI-generated commentary. Most cement companies have specific ways they calculate metrics like overall equipment effectiveness or specific energy consumption that differ from textbook definitions, and the reporting system accommodates those custom calculations precisely. The report output can be generated in PDF, web dashboard, or editable document formats depending on how your management team prefers to consume the information. Talk to a specialist about aligning the report template with your corporate standards.
What is the minimum data history required before the AI can generate meaningful reports?
The reporting system can generate its first automated report with as little as one month of integrated data, but the quality and depth of the AI-generated insights improve significantly as the system accumulates historical context. With one month of data, the report can accurately calculate current-period metrics and identify anomalies relative to the available baseline. With three to six months of history, the AI can establish meaningful trends, calculate rolling averages that smooth out seasonal variations, and identify recurring patterns such as monthly maintenance cycles that correlate with production drops. With twelve or more months of history, the system can perform year-over-year comparisons that account for seasonal effects and provide the most robust baseline for anomaly detection. Book a demo to discuss the data onboarding process for your plant.
How does the AI handle data gaps or sensor failures that occur during the reporting period?
Data quality management is a core function of the reporting engine. When the system detects a data gap due to sensor failure, communication loss, or maintenance system downtime, it applies a set of rules that depend on the severity and duration of the gap. Short gaps of a few minutes are filled using interpolation from adjacent data points. Longer gaps trigger the system to exclude the affected time period from calculations that require continuous data and to flag the exclusion in the report with an explicit note about the data quality issue. The AI never silently fabricates data to fill gaps, and it provides a data quality score for each section of the report so the reader knows exactly how much of the analysis is based on complete data versus estimated or excluded periods. Talk to a specialist about data quality handling for your specific sensor reliability profile.
Is the reporting system secure and does it transmit data outside of our plant network?
The reporting system can be deployed entirely within your plant network or corporate IT infrastructure, with no requirement to transmit raw process data outside of your firewall. The AI calculation engine runs on servers that you control, and the report generation and storage happen within your designated environment. If you choose to use cloud-based features such as remote dashboard access or cross-plant benchmarking, the data transmitted is encrypted in transit and at rest, and only the calculated metrics and report outputs are shared, not the underlying raw process data. The system supports standard enterprise security protocols including role-based access control, single sign-on integration, and audit logging of all data access and report generation activities. Book a demo to review the security architecture and deployment options.
Reclaim Your Engineering Time and Get Reports That Drive Action
Book a 30-minute reporting automation assessment. Share a sample of your current monthly report, and iFactory will show you what an AI-generated version looks like using your own plant metrics and data structure.