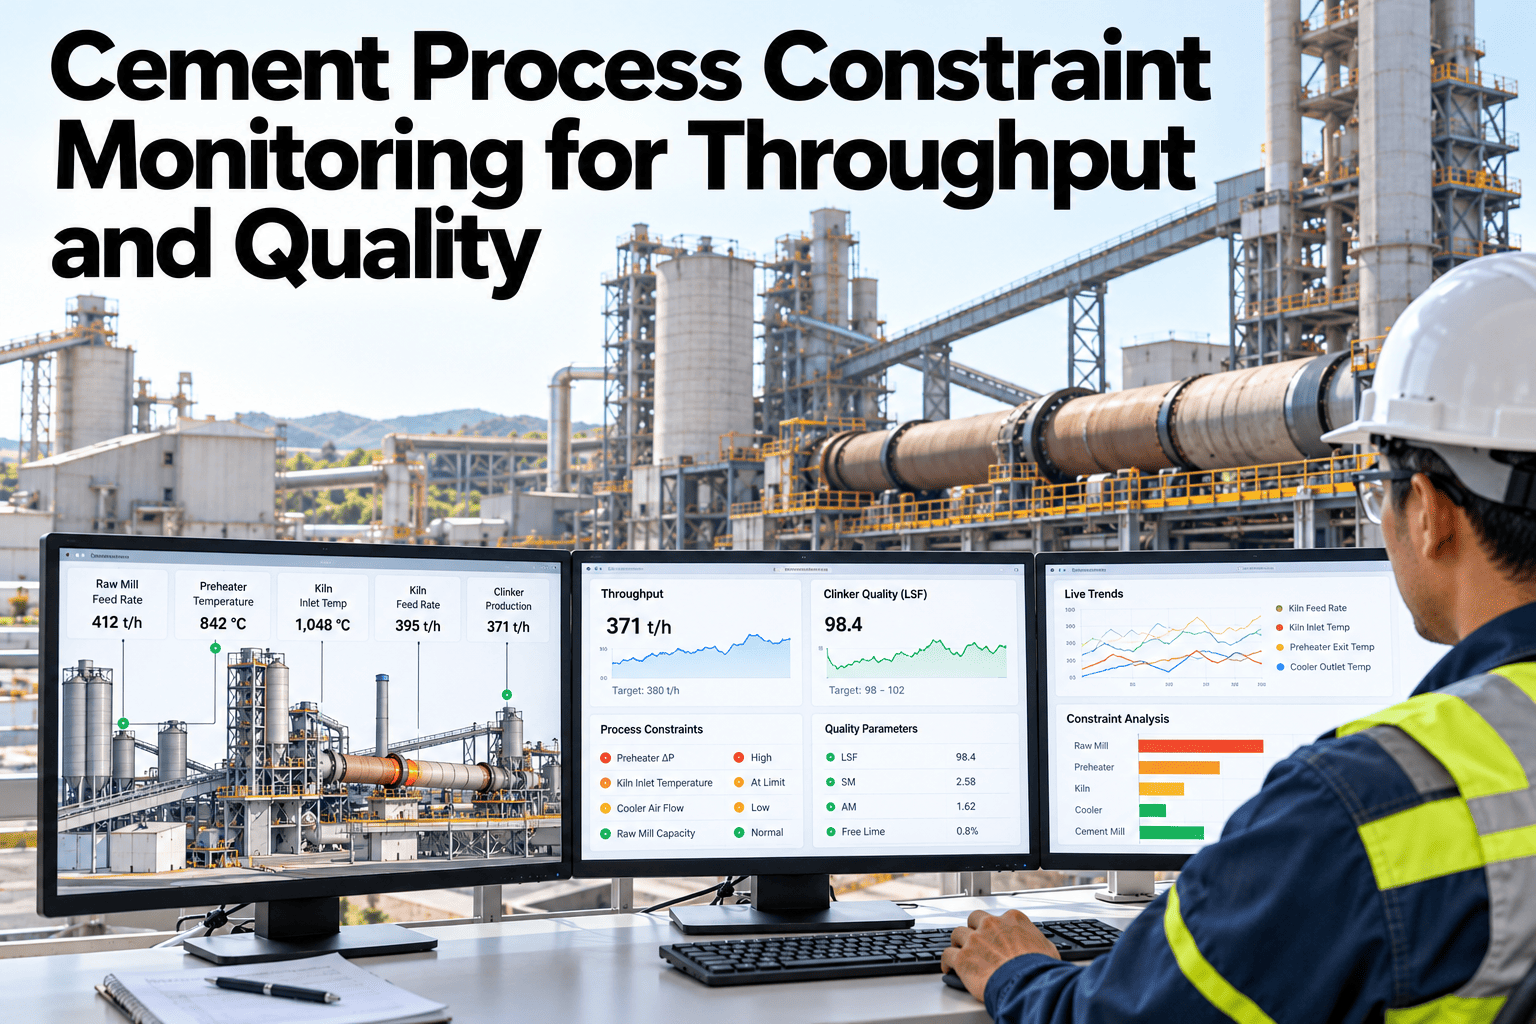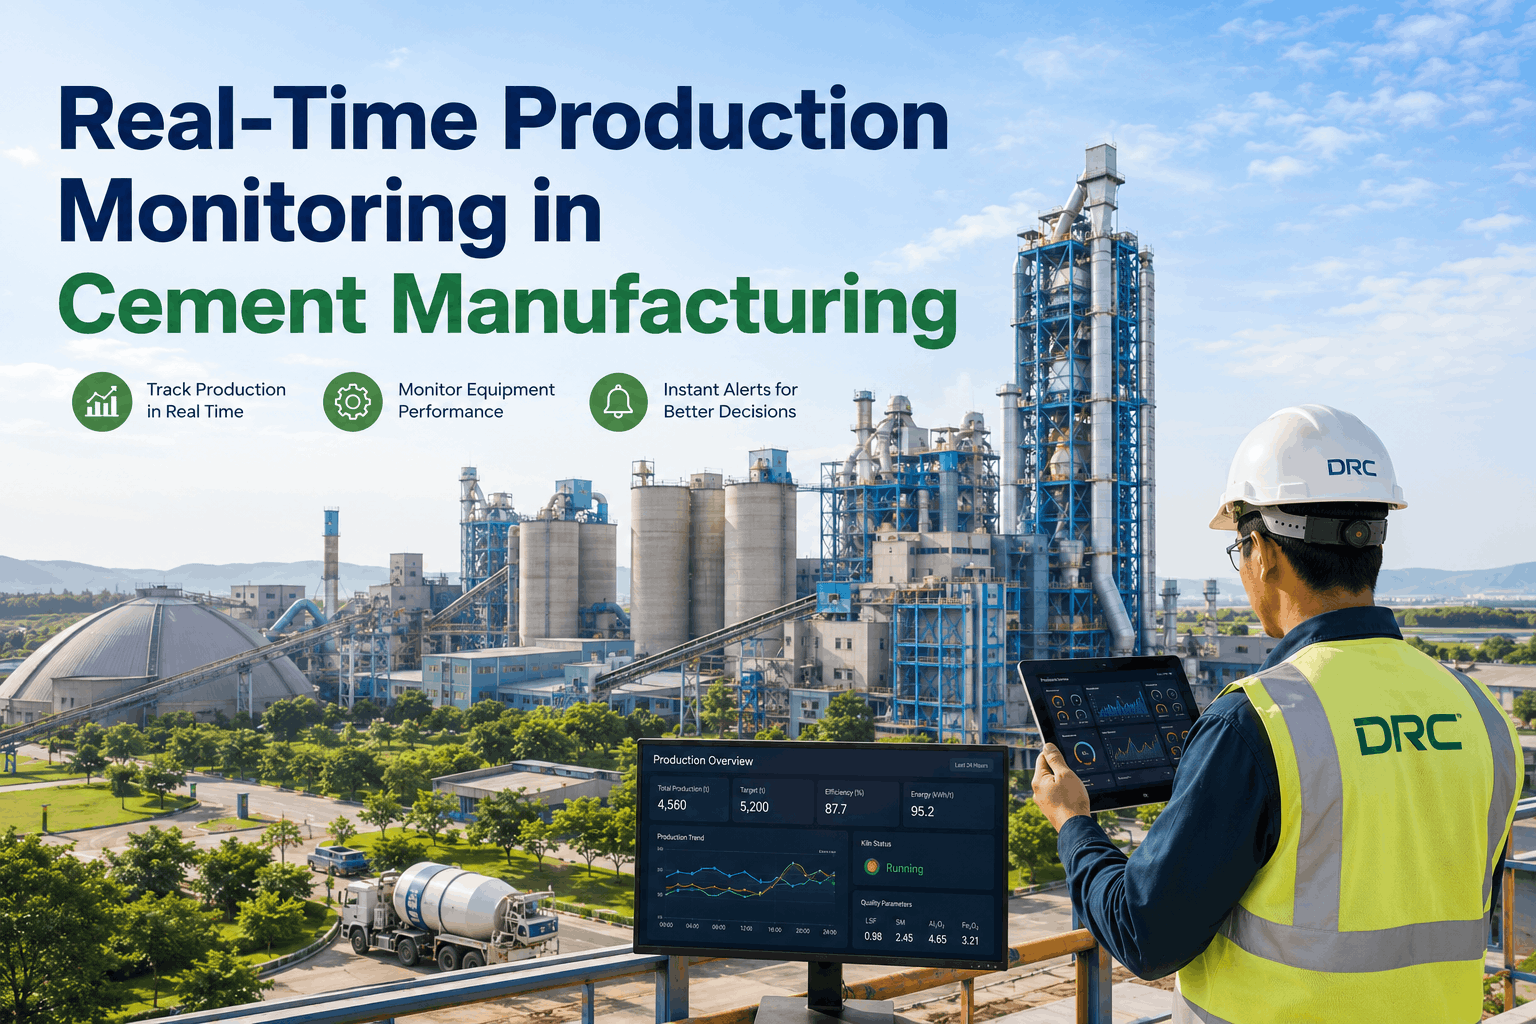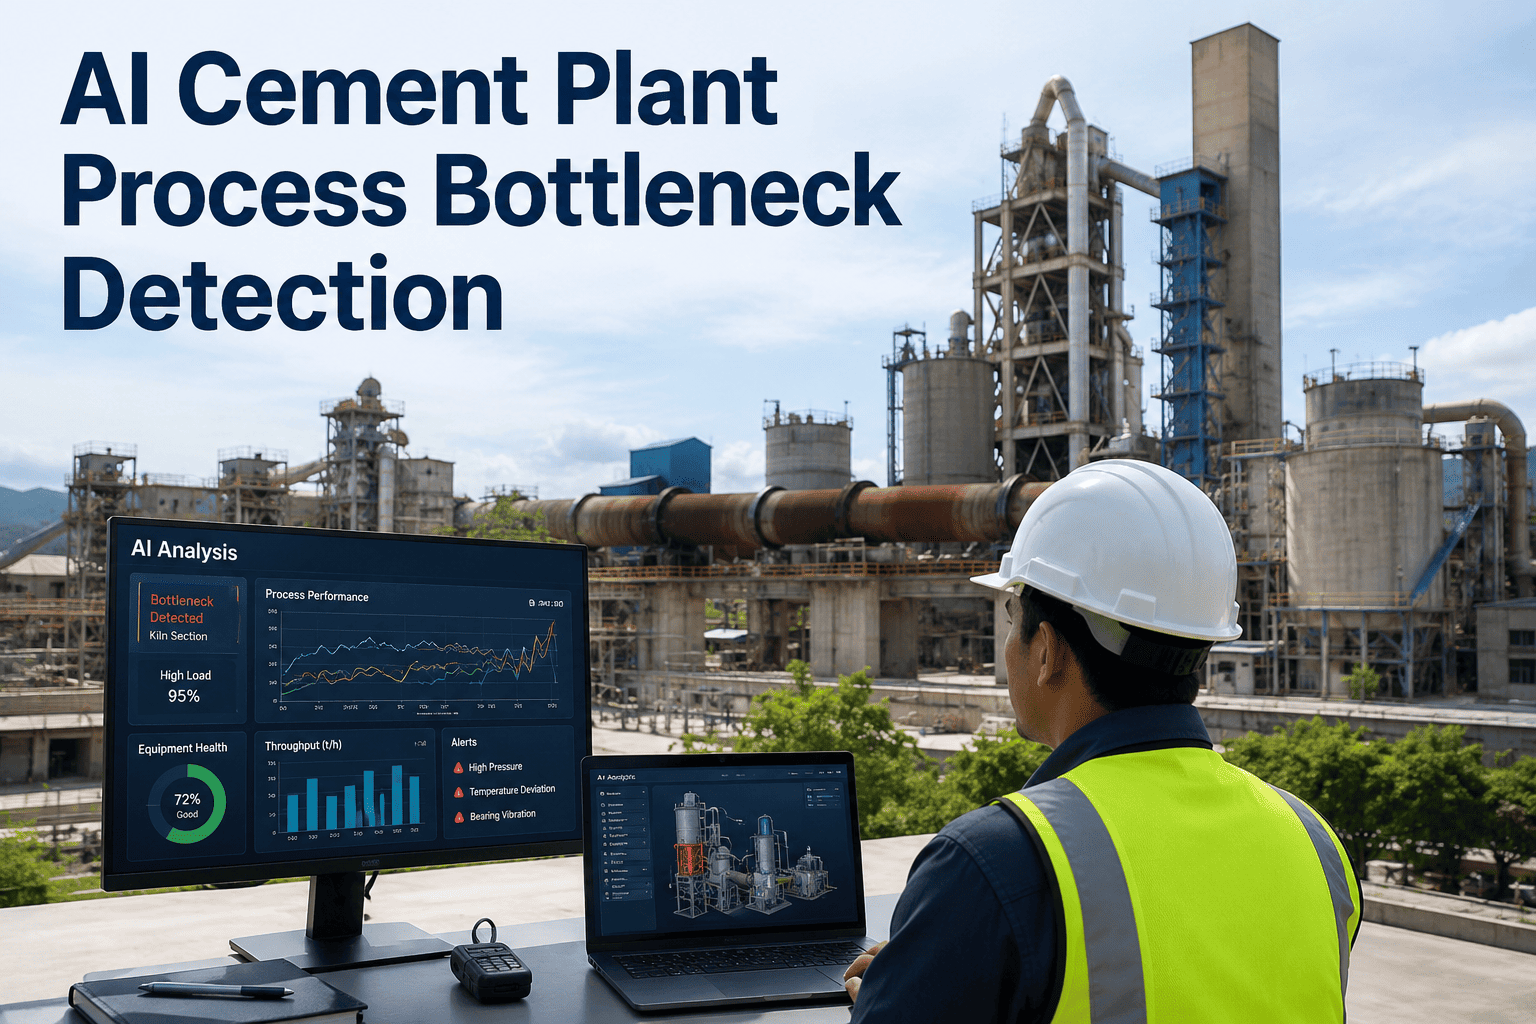
Every cement plant already has a bottleneck right now, and most plants don't know exactly where it is until output falls short at month-end. A raw mill running at 78% of rated capacity while the kiln runs at 92% is not a kiln problem — it is a raw grinding problem, and no amount of kiln tuning will fix it. Monthly production reports and shift-log spreadsheets identify the constraint weeks after it formed, by which point it has usually already migrated somewhere else. iFactory's AI-driven process analytics finds the active constraint in hours instead of weeks, and shows exactly which asset is capping your line right now — see how at Book a Demo.
Find The Real Constraint Before It Costs You A Full Shift Of Output
iFactory continuously compares actual throughput against rated design capacity at every stage of your production line — crushing, raw grinding, kiln, cement mill, and packing — and flags the exact asset that is limiting plant output the moment the constraint shifts, not weeks later in a monthly report.
Which Stage Is Actually Limiting Your Line Today?
Cement production is a chain of five stages, and a chain only moves as fast as its slowest link. Traditional reporting tracks each stage in isolation — a crusher throughput report here, a kiln feed log there — which makes it nearly impossible to see which stage is the binding constraint at any given moment. iFactory instead builds a single, continuous ratio for every stage: actual tons-per-hour output divided by that stage's rated design capacity. The stage with the lowest ratio, at any point in time, is the current bottleneck, and that answer changes shift to shift as feed quality, equipment wear, and ambient conditions shift with it.
In this illustrative snapshot, raw grinding is the binding constraint even though the kiln is running closer to its nameplate rating. Every ton of extra kiln capacity is wasted until raw mill throughput improves, which is exactly the kind of misdirected investment iFactory's constraint mapping is built to prevent — plants routinely spend on kiln upgrades while the actual limiter sits one stage upstream.
The five ratios above are not a static snapshot taken once a month; they are recalculated continuously as feed rate, ambient temperature, fuel blend, and equipment condition change throughout the day. A raw mill that runs at 90% of rated capacity on a dry morning can fall to 74% by mid-afternoon once clay moisture content rises, and a plant relying on a monthly average would never see that swing at all. iFactory's constraint engine keeps a running record of which stage has held the lowest ratio across every shift, every day, and every week, which makes it possible to separate a one-off dip from a persistent, structural limitation. This running record is also what makes the difference between reacting to a single bad shift and correctly identifying the stage that deserves engineering attention or capital investment. Plants that adopt this kind of continuous constraint tracking typically discover that the bottleneck they assumed they had — often the kiln, because it is the most closely watched asset in the plant — is not actually the stage limiting output most of the time.
Five Hidden Causes Behind Most Cement Line Bottlenecks
A bottleneck alert only tells you where the constraint is. Resolving it requires knowing why that stage is underperforming, and the underlying causes are rarely obvious from a control room screen. iFactory correlates throughput data against maintenance history, sensor calibration records, and raw material lab results to identify which of these five patterns is driving the constraint. In most plants, more than one of these causes is active at any given time on different stages, which is why a single throughput number is never enough on its own — the diagnosis has to come from correlating that number against the specific data source most likely to explain it.
Unplanned Equipment Failure
Motor damage, bearing seizure, and belt breakage remain the single largest source of cement line bottleneck events, tracing back to a large majority of all constraint incidents plant-wide. Because these failures develop gradually before the final trip, they are also the category where early detection delivers the most avoidable downtime, since the difference between a scheduled bearing swap and an emergency shutdown often comes down to whether the fault was caught during its first week of development or its last day.
Wear And Gradual Degradation
Crusher liners, mill grinding media, refractory lining, and conveyor belts degrade slowly enough that throughput can fall well below rated capacity before anyone notices the loss on a shift report. This category is particularly costly because the throughput loss is gradual and easy to rationalize away shift after shift, until months of accumulated capacity loss finally shows up as a quarter with disappointing production numbers and no single obvious cause.
Fan And Blower Inefficiency
ID fans, raw mill fans, and ESP fans consuming excess power while delivering reduced airflow create a hidden capacity constraint, and fan systems alone can account for a large share of total plant electrical draw. A fan drawing its normal current while moving noticeably less air is a classic sign of impeller wear or damper misalignment, and it rarely trips an alarm because the electrical draw itself looks entirely unremarkable to a control room operator.
Instrumentation Drift
Temperature sensors, flow meters, and analyzers that drift out of calibration push operators toward conservative setpoints, which quietly derates the process without a single alarm ever firing. Because no alarm limit is ever technically breached, this cause is one of the hardest for a plant to self-diagnose without cross-referencing instrument readings against independent lab or process data over an extended period.
Raw Material Variability
Limestone chemistry fluctuation, clay moisture swings, and inconsistent feed blend force conservative kiln operation, often well below the kiln's rated capacity, purely to protect clinker quality. Quarries rarely deliver perfectly uniform material, and without a system that correlates incoming feed chemistry against kiln performance in real time, operators default to the safest, most conservative setpoint available rather than the setpoint the current material would actually support.
Stop Guessing Which Asset Is Costing You Output.
iFactory pinpoints your plant's binding constraint in hours, tracks how it shifts across shifts and conditions, and shows you exactly what to fix first.
How One Small Fault Becomes A Plant-Wide Bottleneck
Cement plant assets are heavily interdependent, which means a minor, undetected fault on one machine can propagate into a full production stoppage within days. The sequence below traces a real pattern iFactory has flagged repeatedly across ID fan bearings — the kind of failure that looks like nothing at all until the moment it stops the kiln.
Vibration and thermal signatures typically make this pattern visible up to eight weeks before failure, which is the entire window iFactory's anomaly detection is built to catch. Instead of waiting for step three, the platform flags step one, while the fix is still a scheduled bearing replacement rather than an emergency shutdown.
The same cascading logic applies well beyond ID fan bearings. A worn crusher liner reduces throughput gradually enough that the raw mill compensates by drawing down its buffer bin, which masks the crusher's declining performance until the buffer runs low and the raw mill itself starts starving for feed. A drifting kiln feed weigh scale can push an operator toward a more conservative kiln speed to protect clinker quality, which then leaves the cement mill under-fed even though the cement mill itself has done nothing wrong. In every one of these cases, the asset that eventually shows the visible symptom — a starved mill, a derated kiln, an idle packer — is rarely the asset where the problem actually started, which is why constraint detection has to track the full chain of dependencies rather than monitoring each machine as an island.
Primary Constraint Or Secondary Constraint? The Distinction That Matters Most
Effective debottlenecking requires a system-level view across every stage simultaneously, not just the ability to measure individual equipment performance in isolation. Once a plant fixes its primary constraint, a secondary constraint that was previously hidden behind it becomes the new binding limit, and treating that secondary constraint as if it were the real problem wastes both time and capital.
Primary Constraint
The actual stage-level throughput limiter right now — the asset whose output ceiling is holding back every stage downstream of it, regardless of how well those downstream stages perform. Fixing the primary constraint is the only intervention that raises plant-wide output today, and any effort spent elsewhere produces no measurable change in total throughput until this stage is addressed.
Secondary Constraint
An asset that only becomes binding after the primary constraint is resolved — real, but not yet the limiting factor, and not where the next investment or maintenance effort should go. Secondary constraints are worth tracking in parallel so the plant is ready to address them the moment they become binding, rather than discovering the next limit only after production has already stalled again.
iFactory's cross-shift analytics also separates a shift performance gap from a genuine structural constraint. If one crew consistently runs the raw mill at 90% capacity while another only reaches 78% under the same feed conditions, that gap is a training and setpoint-guidance problem, not a capital project. If every shift caps out at the same ceiling regardless of crew, that is the real structural bottleneck requiring equipment or process intervention — and knowing which one you are facing changes the entire response plan.
Getting this distinction wrong is expensive in both directions. Approving a capital project to expand mill capacity when the actual issue is inconsistent operator setpoints wastes budget on equipment that was never the real limit, while dismissing a genuine structural constraint as "just a shift issue" delays the equipment investment the plant actually needs, letting the same capacity loss repeat month after month. iFactory's continuous constraint tracking is designed to answer this question with data rather than opinion, comparing performance across matched conditions so the diagnosis holds up whether it points toward a training program or a maintenance work order.
What Plants See After Moving From Monthly Reports To Real-Time Constraint Detection
Across facility deployments where cement plants replaced spreadsheet-based bottleneck tracking with continuous AI constraint mapping, the shift from reactive to real-time visibility produced consistent, measurable gains.
These figures compound rather than stack, since each improvement removes friction from the next one. Fewer false alarms mean operators trust the system enough to act on genuine alerts immediately instead of second-guessing them, which shortens the time between detection and correction. Earlier detection reduces unplanned downtime, and less unplanned downtime means the recovered hours can go toward the additional 15-25% of capacity many plants find sitting in existing assets rather than toward emergency repairs. None of this requires a new kiln, a new mill, or a new crusher — it requires seeing the constraint clearly enough, early enough, to act on it before it costs a full shift of output.
Reading A Shift Variability Report The Right Way
Comparing throughput across shifts under matched feed and equipment conditions is one of the fastest ways to separate an operational gap from a structural one. The table below illustrates the kind of comparison iFactory's shift analytics generates automatically for every production stage.
| Shift | Raw Mill Throughput (% of rated) | Diagnosis |
|---|---|---|
| Shift A | 90% | Near best-shift performance, setpoints well tuned |
| Shift B | 83% | Moderate gap, likely setpoint drift during the shift |
| Shift C | 78% | Largest gap, candidate for targeted operator guidance |
When the gap between best and worst shift is wide under otherwise similar conditions, the fastest capacity gain available is often training and setpoint standardization — not a maintenance project or capital spend. iFactory generates this comparison automatically for every production stage and every shift, controlling for feed quality and equipment condition so the comparison is fair, and flags which stage has the widest recoverable gap so training resources go toward the crew and shift combination where they will close the largest gap first, rather than being spread evenly across a plant where the gap is concentrated in just one or two shifts.
We used to find out about a bottleneck when the monthly production report came out, and by then whatever had constrained the line for three weeks had usually already changed. Since we started using iFactory's constraint mapping, our shift supervisors get an alert the moment a stage falls behind its rated capacity, with the likely cause already attached. We've moved two capital projects off the roadmap because the real issue turned out to be operator setpoint variation, not equipment limits.
Frequently Asked Questions
Q: How is this different from the OEE dashboards we already have?
Most OEE dashboards report availability, performance, and quality after the fact, usually rolled up to a shift or daily figure that tells you a stage underperformed without telling you why or what to do next. iFactory's constraint mapping runs continuously at the stage level, comparing actual throughput to rated design capacity in near real time, and layers in the likely root cause — mechanical, fan inefficiency, instrumentation drift, or raw material variability — so supervisors get a specific, actionable alert rather than a lagging summary number. The two are complementary rather than competing: OEE tells you how the plant performed, while constraint mapping tells you which stage to act on next and why, which is the piece most existing OEE dashboards were never designed to answer. Reach out through Support Contact to see how this compares to your current OEE reporting.
Q: Do we need new sensors installed, or does this work with what we already have?
In most plants, the majority of the data iFactory needs already exists in weight feeders, mill drives, XRF analyzers, and packing machine controllers, and is accessible through standard OPC-UA connections without replacing any DCS or SCADA system. Some plants add targeted vibration or thermal sensors on assets with known blind spots, such as ID fan bearings, but this is scoped per plant rather than assumed upfront. A Book a Demo session can walk through what your specific instrumentation already supports.
Q: How quickly can a plant identify its first real constraint after implementation?
Because the underlying throughput and equipment data already exists in most control systems, the constraint mapping model typically becomes useful within the first few weeks of connection, well before a full year of historical data has accumulated. Early results usually confirm what operators suspected informally, which is valuable in itself, and the model's accuracy improves as it accumulates more shifts, seasons, and feed-quality variations across the plant's operating history. Most plants see their first actionable constraint alert within the first month, and the diagnostic depth — distinguishing mechanical wear from instrumentation drift, for example — improves steadily over the following quarter as the model observes a fuller range of operating conditions across different seasons and feed sources.
Q: Can this distinguish a genuine equipment limit from a shift performance gap?
Yes, and this is one of the more valuable distinctions the platform makes. By comparing throughput at the same stage across different shifts under matched feed and equipment conditions, iFactory separates a training or setpoint issue — recoverable through guidance rather than capital spend — from a structural constraint that shows up consistently regardless of which crew is running the line. Plants use this distinction to prioritize training programs ahead of equipment investment wherever the data supports it.
Q: Does resolving one bottleneck just create a new one somewhere else?
Often, yes, which is exactly why a system-level view matters more than fixing one asset in isolation. Once a primary constraint is resolved, a secondary constraint that was previously hidden behind it typically becomes the new binding limit, and iFactory's continuous constraint tracking is designed to surface that shift immediately rather than leaving plants to rediscover it weeks later through another round of underperformance. Contact Support Contact for a walkthrough of how constraint tracking continues after your first fix.
Your Next Capacity Increase Doesn't Require A CapEx Approval.
It requires a bottleneck analysis. iFactory identifies your line's binding constraint, tracks how it shifts, and shows you where the next ton of capacity is actually hiding.