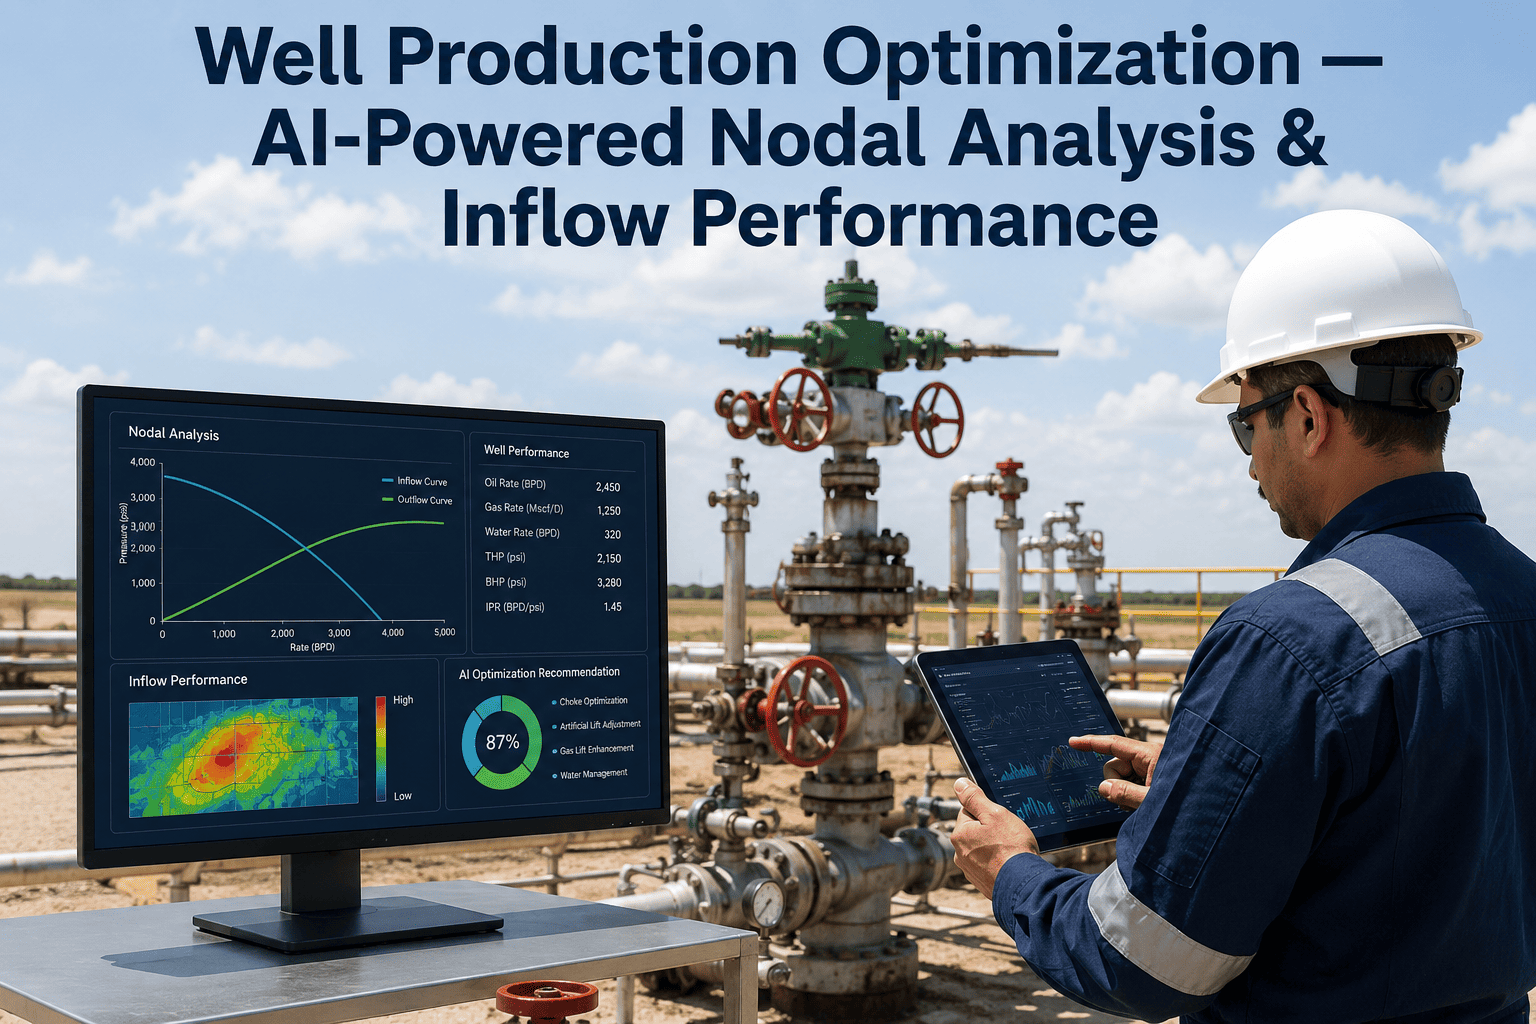
Every well is a chain of pressure losses running from the reservoir through the perforations, up the tubing, across the choke, and out to the separator — and the weakest link in that chain, not the reservoir alone, usually decides how much oil or gas actually reaches the tank battery. Nodal analysis has been the standard method for finding that weak link for decades, intersecting the inflow performance relationship with the outflow curve to reveal exactly where a well is losing potential. AI-powered nodal analysis platforms now run that same diagnosis continuously across an entire field instead of well by well on demand, and production teams comparing the two approaches are increasingly choosing to book a demo to see it applied against their own well list.
One Diagnostic Method, Every Node Between the Reservoir and the Separator
Nodal analysis has always been the right framework for finding underperformance — the challenge has been running it often enough, and on enough wells, to catch a developing restriction before it becomes a chronic production shortfall. AI closes that gap by keeping the inflow and outflow model current for every well, all the time.
Inflow Performance
The IPR curve describes how much fluid the reservoir can deliver to the wellbore at a given pressure — and it shifts as reservoir pressure declines over the well's life.
Outflow Performance
Tubing size, choke setting, and surface flowline losses determine how much of that inflow potential actually reaches the surface at a usable rate.
Production Allocation
Multi-well and multi-zone allocation depends on accurate individual well models, and a stale IPR on one well skews the allocation for the whole pad.
Achievable Rate vs. Actual Rate: Where the Gap Comes From
Nodal analysis exists because a well's theoretical maximum rate and its actual measured rate are rarely the same number, and the difference between them is almost always traceable to a specific node in the system.
Achievable rate based on current reservoir potential
Actual measured rate at the tank battery
Where the Restriction Usually Hides
The same six nodes account for the vast majority of underperformance flagged across production optimization reviews, which is exactly why a systematic, continuous model catches issues that spot checks miss.
Near-Wellbore Skin Damage
Formation damage from drilling fluid invasion or scale buildup reduces effective permeability right at the wellbore, quietly lowering the IPR curve below its original potential.
Undersized or Plugged Perforations
Perforation efficiency degrades over time from fines migration or scale, adding a pressure drop at the sandface that a generic well model won't capture without recalibration.
Oversized or Undersized Tubing
Tubing sized for early-life rates often becomes a bottleneck or, less commonly, oversized enough to allow slugging as the well declines, and neither shows up without an updated outflow curve.
Choke Setting Mismatch
A choke sized around an outdated flow assumption can throttle a well well below its current deliverability, especially after a workover changes the well's flow characteristics.
Surface Flowline Losses
Paraffin buildup, corrosion, or an undersized flowline segment adds friction losses that are easy to overlook when the analysis stops at the wellhead instead of extending to the separator.
Stale IPR Assumptions
Reservoir pressure declines continuously, but many wells are still evaluated against an IPR curve built at first production, overstating what the well should currently be capable of.
Machine-learning-refined IPR modeling deployed across a large unconventional portfolio has delivered measurable production uplift with no new capital spend.
OxMaint's AI nodal analysis platform keeps inflow and outflow models current across your entire well portfolio and flags exactly which node is limiting each well's rate.
How AI Nodal Analysis Runs Continuously Across a Field
The underlying physics haven't changed — what's different is how often the model gets refreshed and how many wells it can be run against at once.
1
Continuous Production and Pressure Data Ingestion
Wellhead pressure, flow rates, and available bottomhole pressure data stream in continuously rather than being pulled together manually for an occasional review.
2
IPR Recalibration Against Current Reservoir Behavior
Machine learning models refine the inflow performance curve using rate-transient behavior and production history, rather than relying on a static curve set at first production.
3
Outflow Curve Reconciliation
Tubing, choke, and flowline performance are checked against current multiphase flow correlations to see whether the outflow system still matches the well's actual configuration.
4
Bottleneck Identification and Ranking
Where the IPR and outflow curves intersect below the achievable rate, the model identifies which specific node is responsible and ranks wells by the size of the recoverable gap.
5
Recommendation and Allocation Update
The recommended fix, whether a choke change, tubing swap, or stimulation candidate, is surfaced to the production engineer, and the updated well model feeds directly into field-level allocation.
Typical Findings by Well Scenario
The specific fix depends on which node is limiting the well, which is exactly why a continuous, well-by-well model outperforms a one-size-fits-all optimization rule.
| Well Scenario |
Node Typically Responsible |
AI Capability Applied |
Typical Recoverable Gap |
| Underperforming new completion |
Near-wellbore skin or perforation efficiency |
IPR recalibration against offset well performance |
10–20% of achievable rate |
| Mature well past first workover |
Oversized tubing or mismatched choke setting |
Outflow curve reconciliation against current rates |
8–15% of achievable rate |
| Field-wide unconventional portfolio |
Stale IPR assumptions across many wells |
Continuous ML-based IPR refresh at scale |
Approximately 1–2% aggregate uplift |
| Multi-zone commingled well |
Allocation error from an outdated single-zone model |
Zone-level inflow reconciliation for allocation accuracy |
Improved allocation accuracy field-wide |
Manual Review vs. Continuous AI Nodal Analysis
The gap between how often a well's model gets refreshed manually and how often conditions actually change is where most missed uplift comes from.
Manual periodic nodal review
Refreshed occasionally
AI continuous nodal analysis
Refreshed continuously
What Separates a Working Rollout From a Stalled One
What consistently works
Validating the AI-refreshed IPR against a handful of wells with known workover history before trusting it across the full portfolio.
Ranking flagged wells by the size of the recoverable gap in barrels or dollars, not just by the size of the statistical deviation from baseline.
Feeding confirmed fixes and their outcomes back into the model so the recommendation quality keeps improving well over well.
Where rollouts stall
Treating a single field-wide IPR curve as good enough instead of recalibrating at the individual well level where the real gaps live.
Stopping the model at the wellhead and ignoring flowline and surface losses that can hide a meaningful part of the gap.
Generating a long list of flagged wells without a clear economic ranking, which buries the handful of interventions that would actually move the needle.
The Bottom Line for Production Engineers
Nodal analysis has never been the wrong tool — it's simply been too labor-intensive to run often enough across a full portfolio to catch a developing bottleneck while it's still cheap to fix. AI-powered nodal analysis keeps the inflow and outflow model current for every well, all the time, so the production engineer's attention goes to the handful of wells where a specific, well-understood fix will actually recover meaningful rate, rather than spreading review time thin across a well list that mostly doesn't need it.
Frequently Asked Questions
The restriction limiting your next well's rate is probably already visible in data you're collecting today.
See how OxMaint keeps inflow and outflow models current across your portfolio and ranks wells by exactly how much recoverable rate is sitting behind each bottleneck.