Artificial lift is the single largest operating expense most producers carry, consuming somewhere between 60 and 80 percent of lease operating costs across a typical well portfolio. Yet most electric submersible pumps, rod pumps, and gas lift systems are still optimized the way they were a decade ago — a periodic well test, a pumper's site visit, and a reactive call after the equipment has already started to underperform or fail. AI-driven lift analytics replace that cycle with continuous monitoring across the whole portfolio, and production teams comparing the two approaches are increasingly choosing to book a demo before their next round of workover planning.
One Platform, Three Lift Methods, One Production Optimization Problem
ESPs, rod pumps, and gas lift systems fail differently, cycle differently, and get optimized differently — but they share the same underlying economics. Every day a well runs below its achievable rate, or every intervention that could have been predicted a week earlier, is money that never needed to leave the lease operating budget.
Electric Submersible Pumps
Run life is the primary lever — every unplanned pull costs both the workover bill and the deferred production during downtime.
Rod Pumps
Stroke rate and pump fillage drive both energy cost and rod string fatigue, and the two are easy to get wrong without dynamometer data.
Gas Lift
Injection rate optimization has diminishing returns past a breakeven point that shifts constantly with reservoir pressure decline.
Where the Lease Operating Budget Actually Goes
Artificial lift dominates operating spend so thoroughly that even small percentage gains in run life or energy efficiency translate into real dollars across a multi-well portfolio.
Artificial lift operations — 60–80% of lease operating expense
All other lease operating costs
Where Each Lift Method Loses Performance
The failure signatures are different for every lift method, which is exactly why a single fixed monitoring threshold rarely works across a mixed portfolio.
ESP: Gas Interference and Cycling
Free gas entering the pump intake causes cycling and cavitation damage long before a motor trips on thermal protection, and by the time surface amps show the problem, internal wear has already accumulated.
ESP: Scale and Corrosion Buildup
Gradual scale accumulation on impellers shows up as a slow efficiency decline that's easy to miss without continuous trending against the pump's original performance curve.
Rod Pump: Pump-Off and Fluid Pound
Running a fixed stroke rate without adjusting for actual pump fillage causes fluid pound, which accelerates rod and pump wear far faster than a well running at its correct fillage percentage.
Rod Pump: Rod String Fatigue
Dynamometer card shape changes gradually as rod fatigue accumulates, and manual card review on an infrequent schedule often misses the trend until a parted rod forces an unplanned workover.
Gas Lift: Injection Past Breakeven
Injection rates set once and left unadjusted commonly sit past the point of diminishing returns, wasting compression capacity that could be redirected to a better-performing well.
Gas Lift: Valve Failure and Multipointing
A failed or leaking gas lift valve is difficult to diagnose from surface data alone, and undetected multipointing wastes injection gas without the corresponding production response.
Rod pump energy costs alone can be cut 15 to 25 percent through data-driven stroke rate optimization, without sacrificing production.
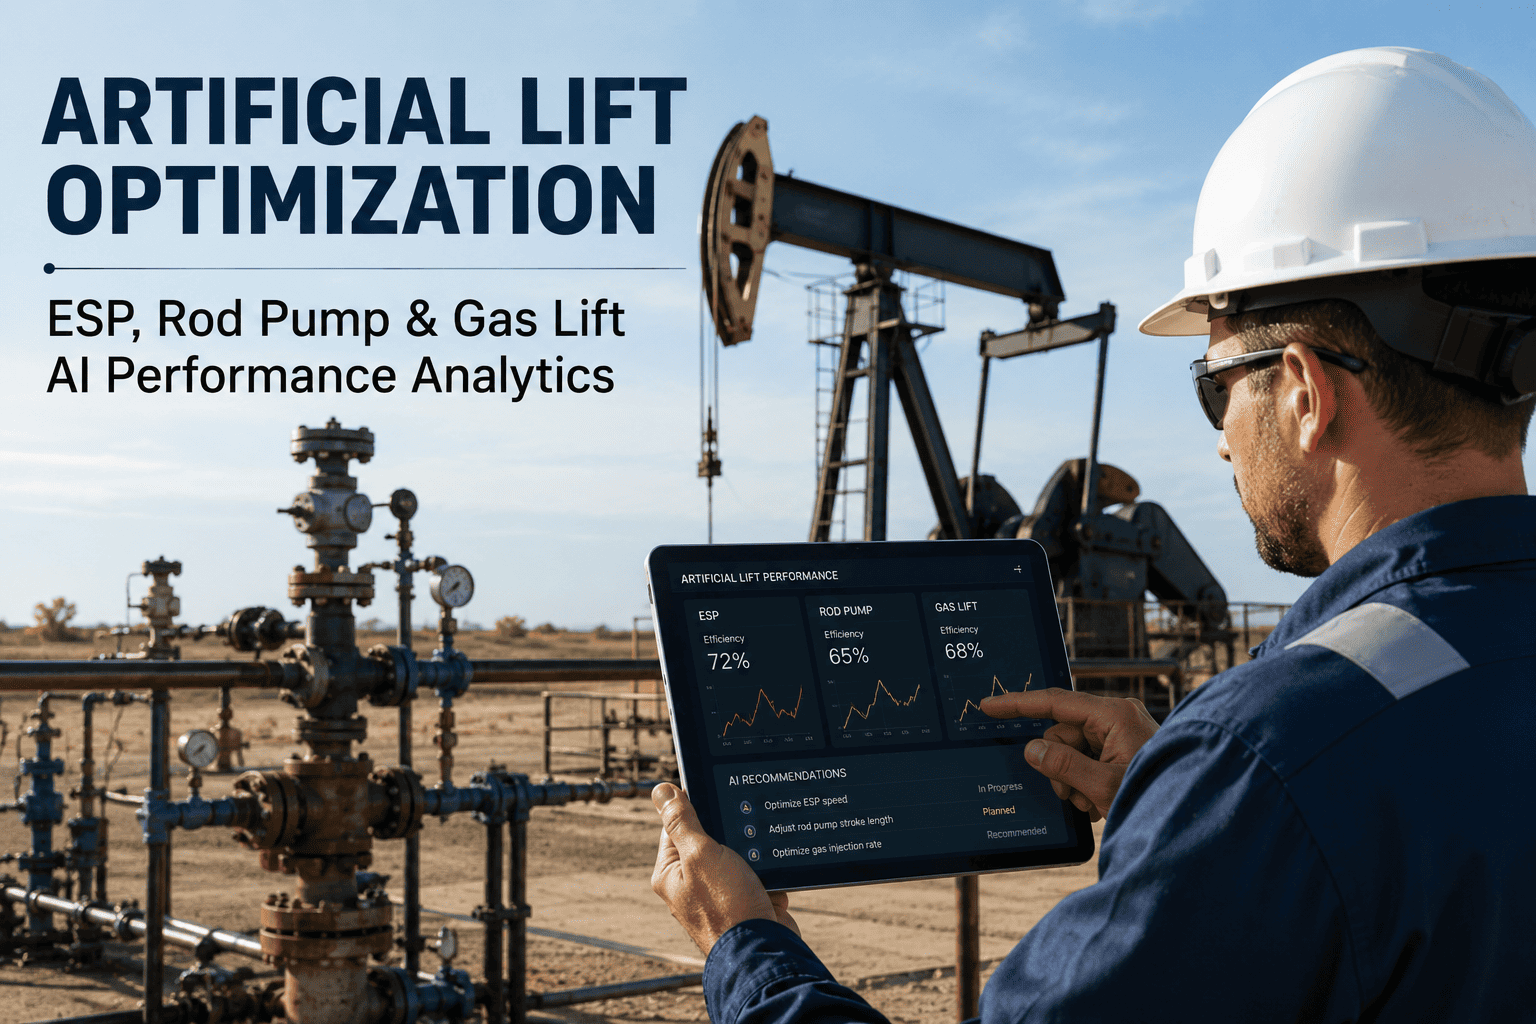
OxMaint's artificial lift platform continuously monitors ESP, rod pump, and gas lift performance across your full well portfolio and flags the interventions that actually move the economics.
How AI Lift Optimization Works Across a Portfolio
The same underlying workflow applies across ESP, rod pump, and gas lift wells, even though the specific parameters being modeled are different for each.
1
Continuous Field Data Ingestion
Dynamometer cards, ESP panel readings, and gas lift injection meter data stream in continuously from SCADA rather than being reviewed on a fixed inspection schedule.
2
Well-Specific Performance Baseline
Each well gets its own baseline model built from its own performance history, since a fixed threshold across a diverse portfolio produces excessive false alerts.
3
Failure Mode Classification
Card shape changes, ESP amp trends, and gas lift injection efficiency are classified against known failure signatures to identify the specific developing problem, not just an anomaly.
4
Set Point and Intervention Recommendation
The platform recommends the specific stroke rate, frequency, or injection rate adjustment needed, along with a prioritized list of wells where intervention will have the largest economic impact.
5
Outcome Tracking and Model Refinement
Every adjustment and its resulting production and run-life outcome feeds back into the well's model, sharpening future recommendations for that specific well.
Typical Gains by Lift Method
The specific improvement lever differs by lift method, but the pattern across all three is the same: continuous optimization outperforms periodic review.
| Lift Method |
Primary Optimization Lever |
AI Capability Applied |
Typical Reported Gain |
| Electric submersible pump |
Run life extension and gas interference avoidance |
Continuous amp and vibration trend classification |
2–4% oil uplift, extended run life |
| Rod pump |
Stroke rate and fillage optimization |
Automated dynamometer card classification |
15–25% energy cost reduction |
| Gas lift |
Injection rate optimization near breakeven |
Closed-loop multirate test automation |
Approximately 2% production uplift |
| Mixed lift portfolio |
Prioritized intervention scheduling |
Economic ranking of predicted failures across all wells |
Reduced unplanned workover frequency |
Run Life Extension: Reactive vs. AI-Monitored ESP Wells
ESP run life is where AI-driven monitoring shows some of the most dramatic reported gains, since early detection of gas interference and scale buildup avoids the wear that shortens a pump's service life.
Reactive monitoring baseline
Baseline run life
AI-monitored ESP wells
Meaningfully extended
What Separates a Working Rollout From a Stalled One
What consistently works
Building a well-specific baseline instead of applying one fixed threshold across a diverse portfolio with very different lift equipment and production profiles.
Prioritizing recommendations by economic impact so the production engineer's limited intervention time goes to the wells where it matters most.
Closing the loop between recommendation and outcome, so the model keeps improving instead of producing the same static advice every week.
Where rollouts stall
Rolling out across the entire portfolio at once instead of validating the model against a smaller group of wells with known performance history first.
Sending recommendations to a dashboard that isn't part of the production engineer's daily workflow, so alerts get reviewed too late to act on.
Treating gas lift, rod pump, and ESP wells with the same optimization logic instead of the lift-specific parameters each method actually depends on.
The Bottom Line for Production Engineers
Artificial lift optimization isn't a one-time equipment decision — it's a continuous management problem across every well on a portfolio, every day it's producing. The gap between a well running at its correct stroke rate, injection rate, or ESP frequency and one running on a set point chosen months ago compounds daily, in both lost production and accelerated equipment wear. Closing that gap with continuous, well-specific monitoring is where most of the improvement documented across recent field deployments has come from.
Frequently Asked Questions
Your next intervention decision shouldn't wait for the next scheduled well test.
See how OxMaint continuously monitors ESP, rod pump, and gas lift performance across your portfolio and ranks interventions by the economics that actually matter to your operation.