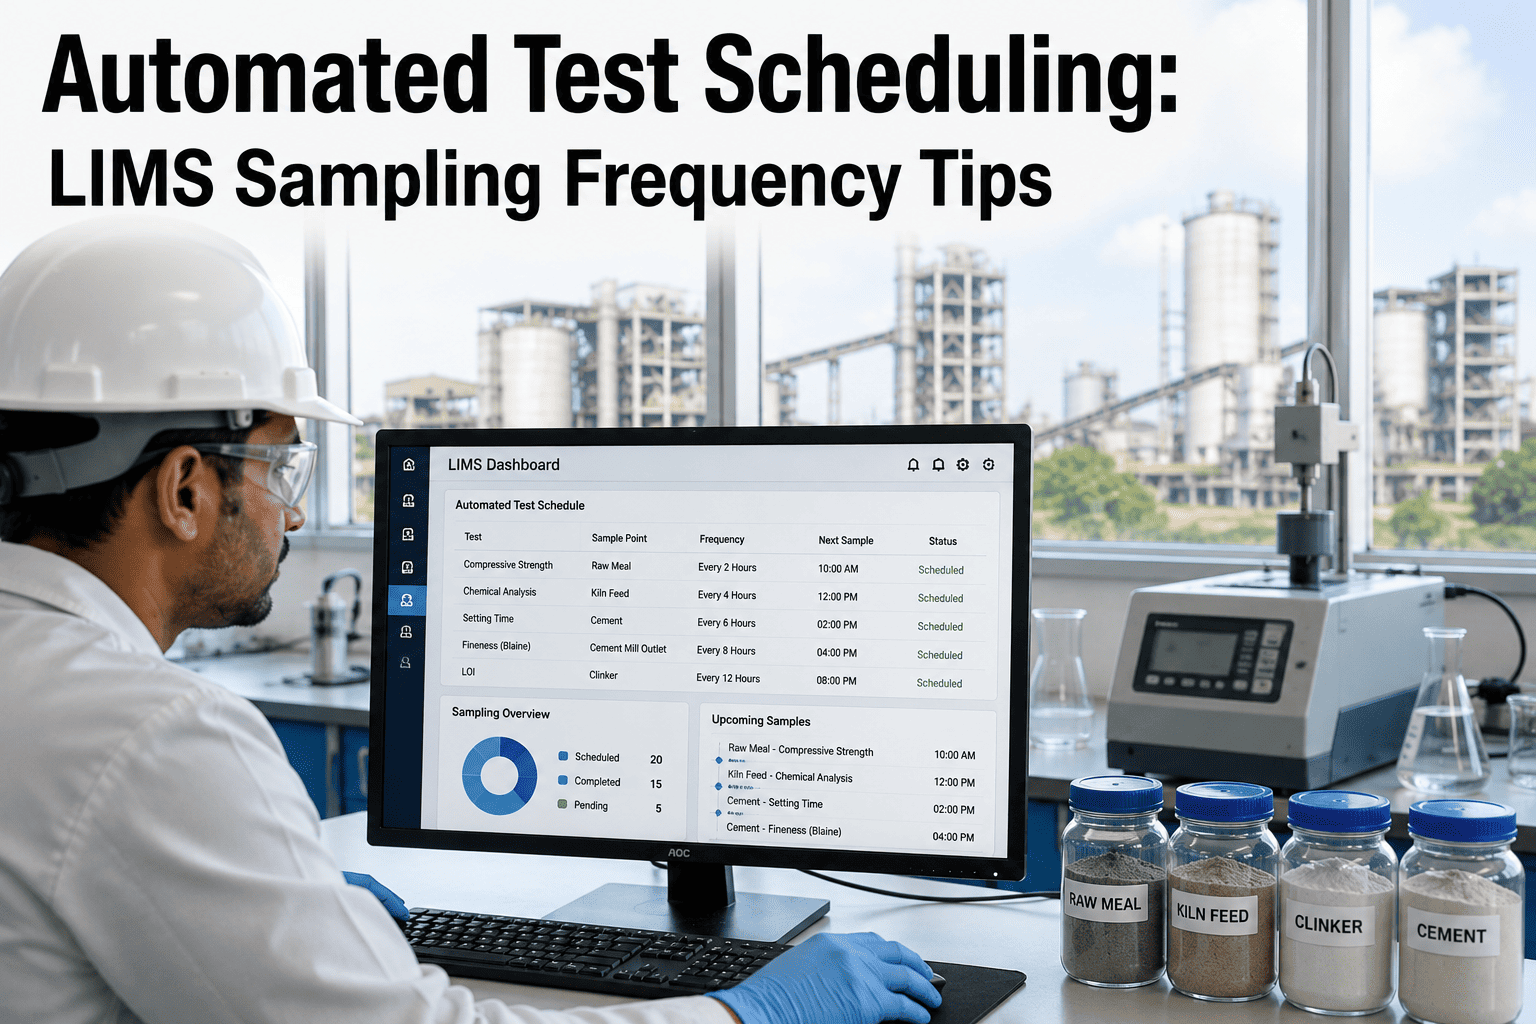
Ask a cement lab supervisor how a sampling schedule actually gets followed on a busy shift, and the honest answer is usually "mostly." A wall chart or a shared spreadsheet tells technicians what to test and when, but a busy shift with instrument downtime, a rush sample, or simply a distracted moment means an hourly kiln feed sample slips to ninety minutes, or a scheduled fineness check gets pushed to the next convenient gap rather than the interval the quality plan actually calls for. None of this reflects poorly on the technician — it reflects the limits of a manual schedule competing against a live production floor. Automated test scheduling removes that competition by generating the queue itself and pushing it to whoever is on shift, and labs that want to see how their current sampling plan would translate into an automated queue can Book a Demo to walk through it directly.
The Sampling Schedule Problem: Why Manual Test Calendars Break Down
A cement plant's quality plan typically specifies sampling intervals for a dozen or more distinct points — raw meal, kiln feed, hot meal, clinker, cement at multiple mill stages — each with its own frequency ranging from hourly to shift-based to daily. On paper, this is a clean schedule. In practice, a manual system asks a technician to hold that entire calendar in working memory, or to check a static chart, while simultaneously handling instrument queues, urgent retests, and whatever unplanned event just occurred on the floor. The schedule does not fail because anyone is careless — it fails because a static document cannot compete with a dynamic shift.
The failure mode is also rarely dramatic, which is part of why it persists for so long without being addressed. A missed hourly sample does not shut down the kiln or trigger an alarm — it simply leaves a gap in the trend dataset that nobody notices until a quality review months later shows an unusually sparse stretch of readings around a particular shift or date. Multiply that pattern across every sampling point on a busy plant's quality plan, and the cumulative gap in the historical record becomes large enough to genuinely undermine trend analysis, correlation work, and any statistical process control effort built on top of it, even though no single missed sample ever looked significant on its own. A quality manager reviewing a full quarter of data for a certification audit is often the first person to notice the pattern, and by then the missing samples cannot be recovered — they represent process conditions that no longer exist.
Three Ways to Trigger a Sample: Time-Based, Event-Based, and Quality-Triggered Scheduling
Automated scheduling is not a single fixed-interval timer — it is three distinct trigger types working together, each covering a category of sampling need that a purely time-based chart handles poorly on its own. Understanding the distinction matters because a lab evaluating an automated scheduling system should be checking for all three, not just a calendar tool that digitizes the existing fixed-interval chart without adding the event and quality-driven logic that actually closes the gaps described above.
The combination matters more than any single trigger type. A plant running only time-based sampling will miss the extra scrutiny an upset condition demands; a plant relying only on event-based sampling has no routine baseline to detect the upset in the first place. Automated scheduling runs all three simultaneously, merging them into a single prioritized queue rather than requiring a technician to mentally reconcile three separate systems.
Quality-triggered scheduling deserves particular attention because it is the trigger type most manual systems handle worst. A paper or spreadsheet schedule has no mechanism to automatically tighten sampling frequency the moment a result starts trending toward a control limit — that decision depends entirely on someone reviewing the trend, recognizing the pattern, and manually deciding to add extra samples, which is exactly the kind of judgment call that gets missed during a busy shift. An automated system applies the same escalation logic every time a defined trend condition is met, which means the extra scrutiny an emerging deviation deserves is guaranteed rather than dependent on someone happening to notice the pattern in time.
Building the Right Cadence: A Sampling Frequency Reference
The table below reflects common baseline sampling intervals for integrated cement plant quality control. Actual cadence should always be validated against a plant's specific quality management system and product certifications, but this provides a reference starting point for configuring an automated schedule.
| Sample Point | Typical Cadence | Primary Trigger Type |
|---|---|---|
| Raw meal / kiln feed | Hourly to two-hourly | Time-based, quality-triggered escalation |
| Clinker (free lime) | Hourly to two-hourly | Time-based, quality-triggered escalation |
| Cement fineness (Blaine) | Per shift | Time-based |
| Cement setting time | Per shift or per batch | Time-based, event-based on gypsum change |
| Compressive strength sets | Daily, with staged curing pulls | Time-based |
| Incoming raw material | Per delivery | Event-based |
| Post-maintenance mill startup | Increased frequency for defined window | Event-based |
Configuring these cadences into an automated system is a one-time setup task, but the value compounds daily — every sample the system generates against the correct interval is one less decision a technician has to make correctly under time pressure, and one less opportunity for schedule drift to accumulate across a shift. The reference table above is deliberately conservative; individual plants may run tighter cadences on parameters with a history of variability, or extend intervals on points with a long track record of stability, and an automated scheduling system makes that kind of per-point customization easy to configure and easy to revisit as conditions change.
Automated Notification: How Technicians Actually Get Told What to Test Next
A generated schedule only has value if it reaches the person who needs to act on it, in a form they will actually see during a busy shift. Automated scheduling systems typically deliver that notification through several channels working together, so the queue does not depend on any single point of visibility.
The escalation layer is what most distinguishes automated scheduling from a digital version of the same wall chart. A missed sample on a paper chart is invisible until someone happens to notice the gap during a review; a missed sample in an automated queue triggers a visible, timed escalation, which means the gap gets closed within the same shift rather than discovered days later during a data review.
There is a deliberate design choice behind using multiple notification channels rather than a single one: shift work does not happen at a fixed workstation. A technician might be at the raw mill sampling point when a kiln feed sample becomes due, away from the shared dashboard entirely, which is exactly the situation a mobile alert is built to cover. The dashboard remains the system of record for the full queue and its priority order, while mobile alerts handle the moment-to-moment nudge that keeps the queue from silently falling behind while someone is physically elsewhere on the plant floor. The escalation channel exists specifically for the case where both of the first two channels fail to produce action within the expected window, giving a supervisor visibility into a gap before it becomes a pattern.
The Numbers: What Automated Scheduling Changes for Lab Throughput
The throughput gain from automated scheduling is often smaller in raw hours saved than the gain from other LIMS automation layers, but its value shows up disproportionately in data quality rather than labor time. A sampling plan that is actually followed consistently produces a trend dataset that analytics and correlation work can trust; a sampling plan with silent gaps and drifted intervals produces a dataset with holes that undermine exactly the kind of quality trending a plant is trying to build toward.
This is worth stating plainly because it is easy to under-value scheduling automation relative to more visible investments like instrument integration or DCS connectivity. Those layers make individual results faster and more accessible, which is tangible and easy to point to. Scheduling automation's contribution is quieter — it is the difference between a dataset with occasional unexplained gaps and one that is genuinely complete, and that completeness is precisely what determines whether a plant's later investment in trend analytics and correlation modeling produces trustworthy insight or simply amplifies the noise from an already inconsistent sampling record.
What Automated Scheduling Doesn't Fix
The realistic framing is that automated scheduling removes the memory and coordination burden from an already correctly designed sampling plan — it does not redesign the plan itself. If a plant's underlying sampling frequency was set years ago and never revisited against current production rates, product mix, or raw material variability, automating a schedule that was already miscalibrated simply means the wrong cadence gets followed with perfect consistency instead of inconsistently. That is still an improvement in most cases, since consistent execution is a prerequisite for evaluating whether the cadence itself needs adjusting, but it is worth treating scheduling automation and sampling plan review as two related but distinct projects rather than assuming one automatically fixes the other. Plants that suspect their current sampling frequency or point selection needs review alongside a scheduling automation rollout can contact iFactory Support to discuss both together.