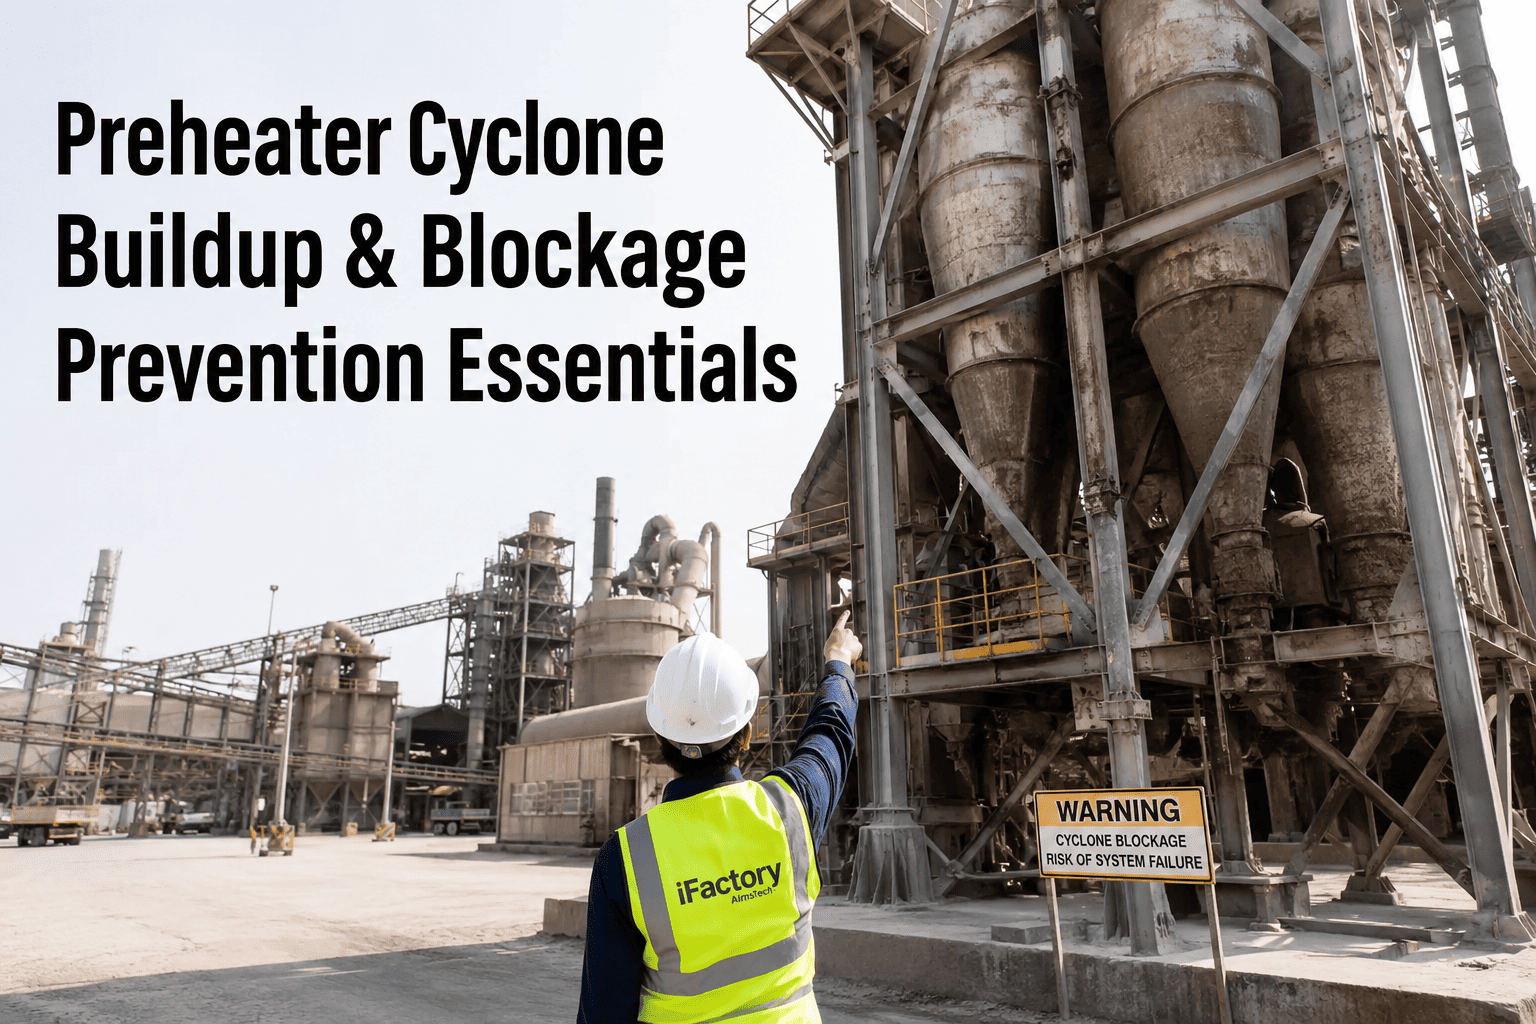
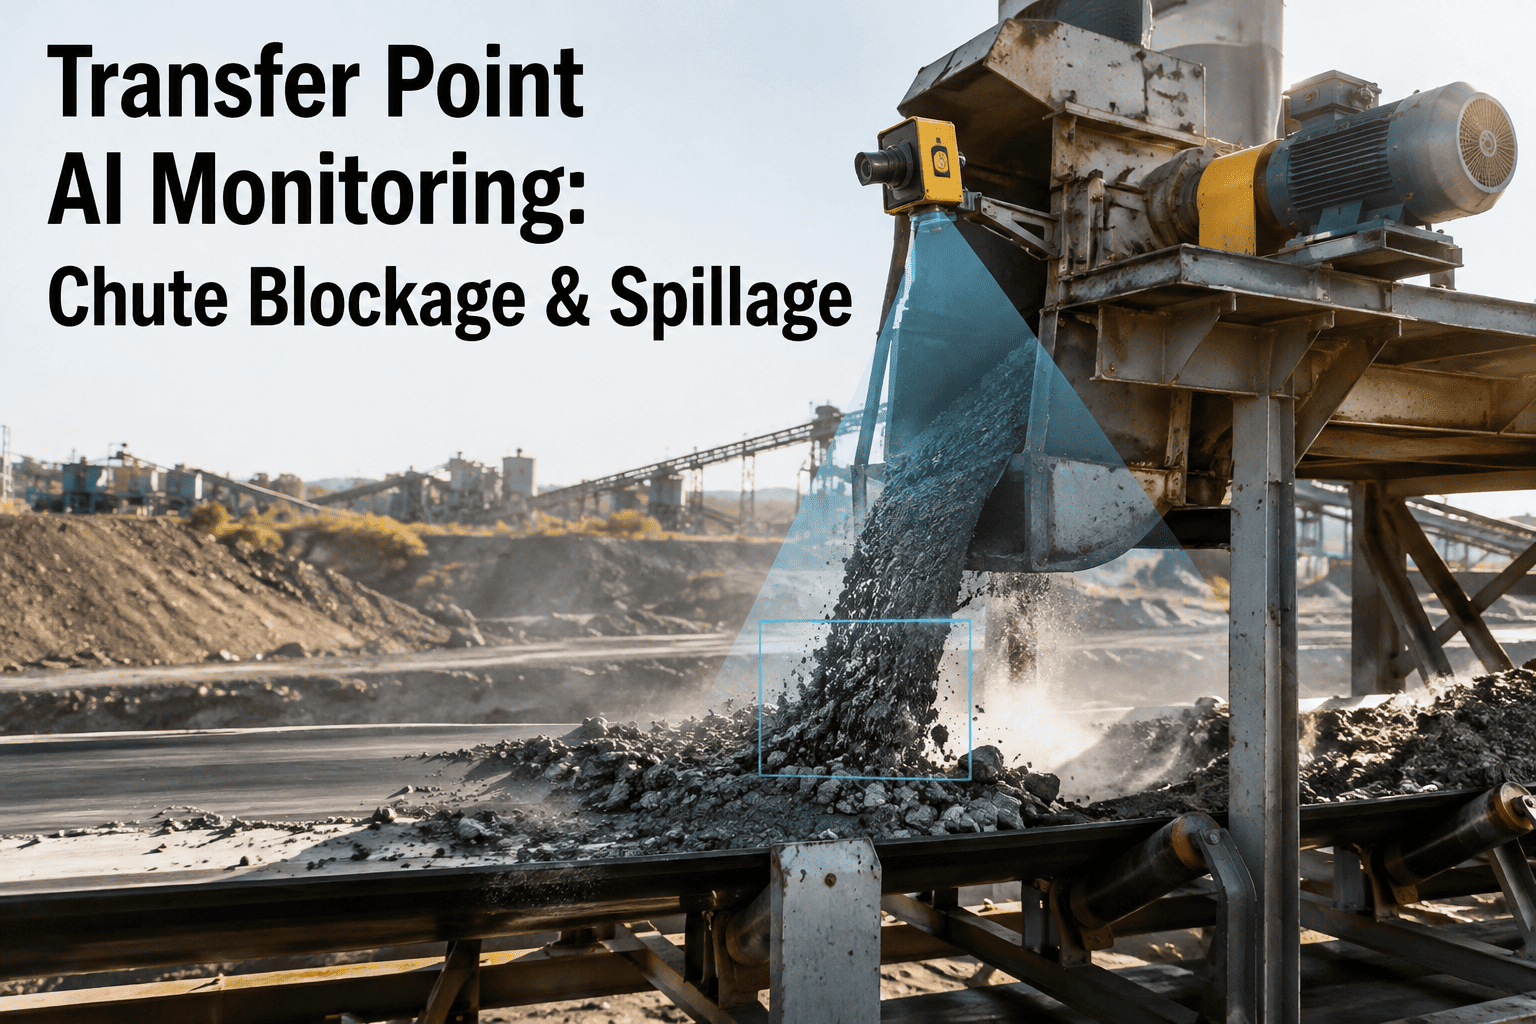
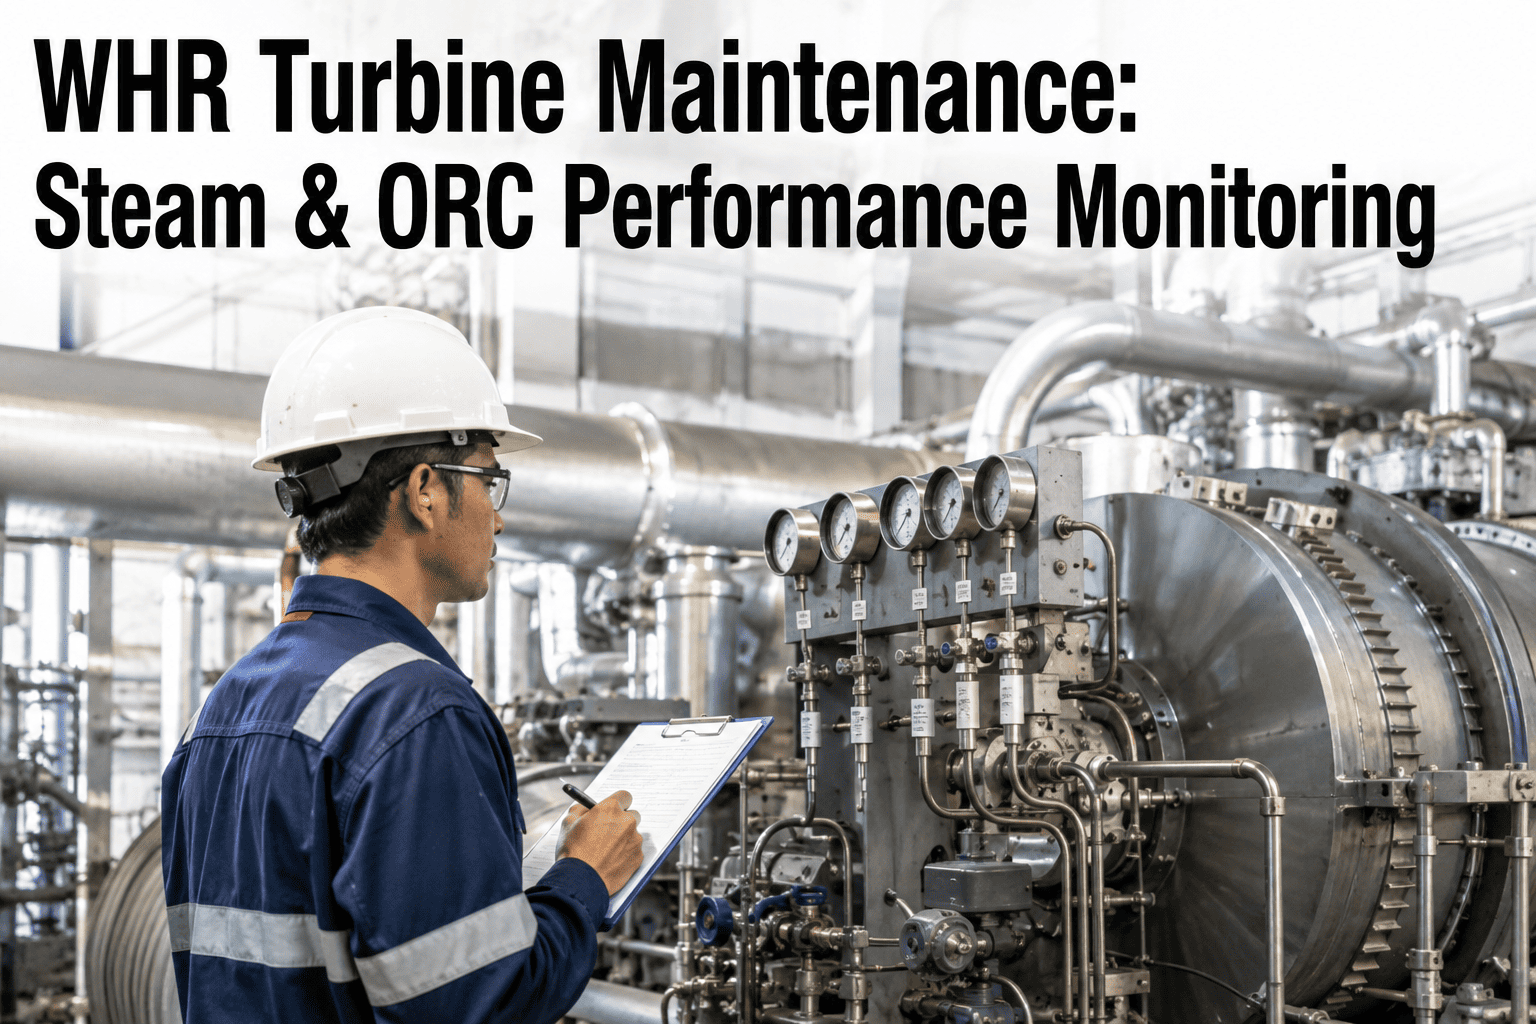
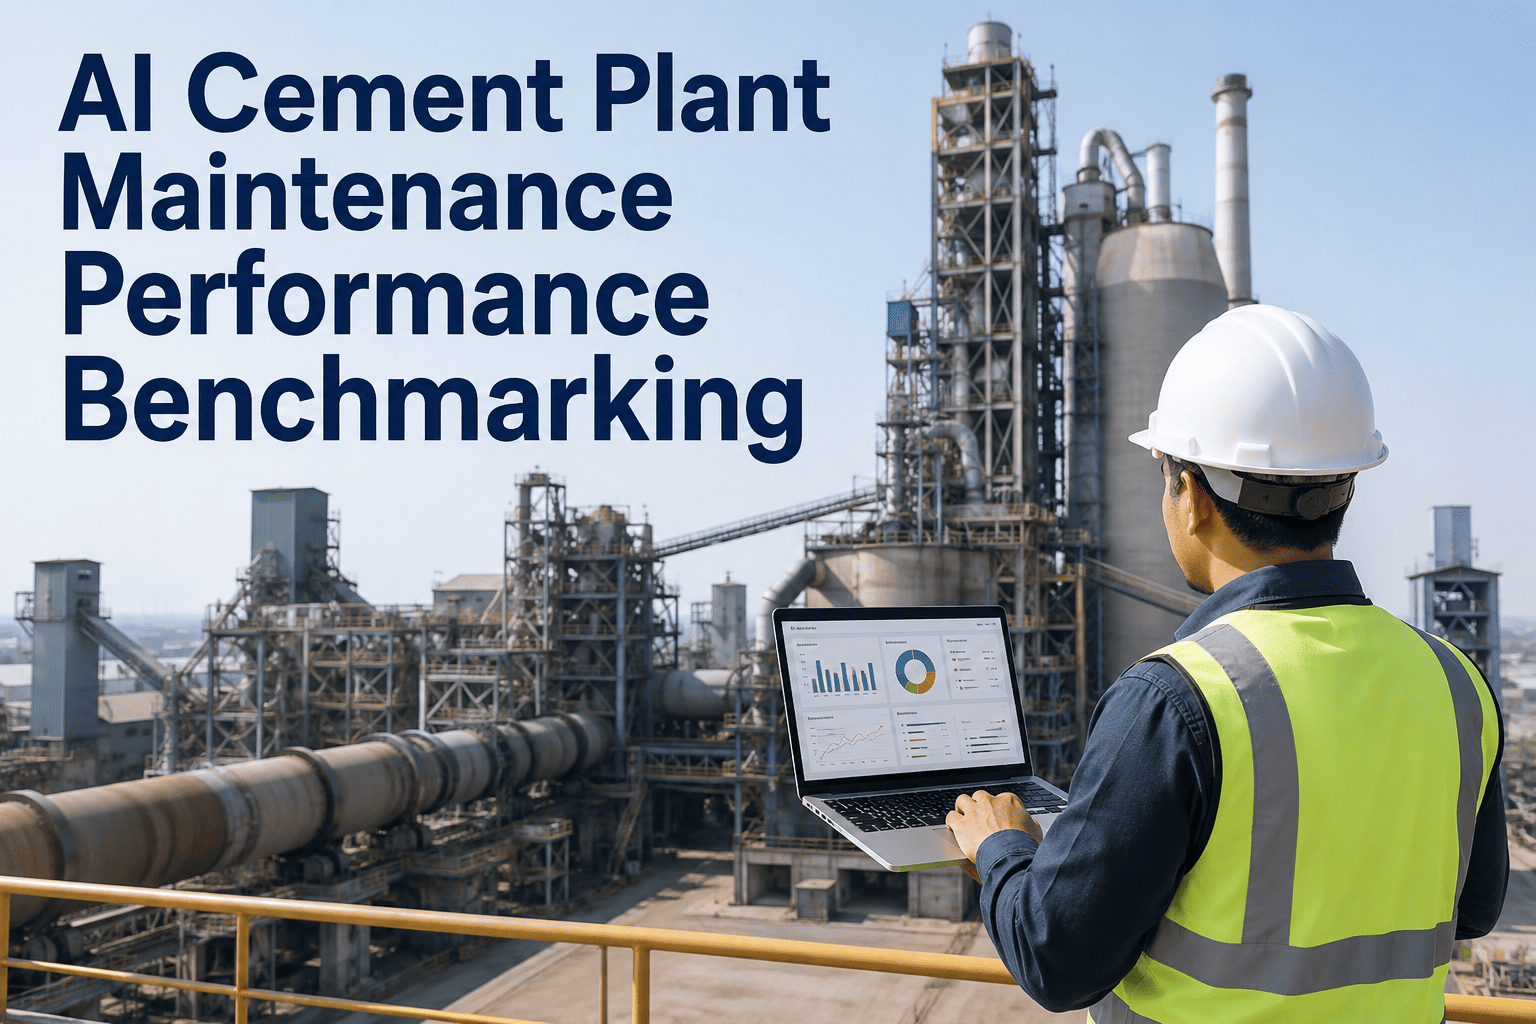
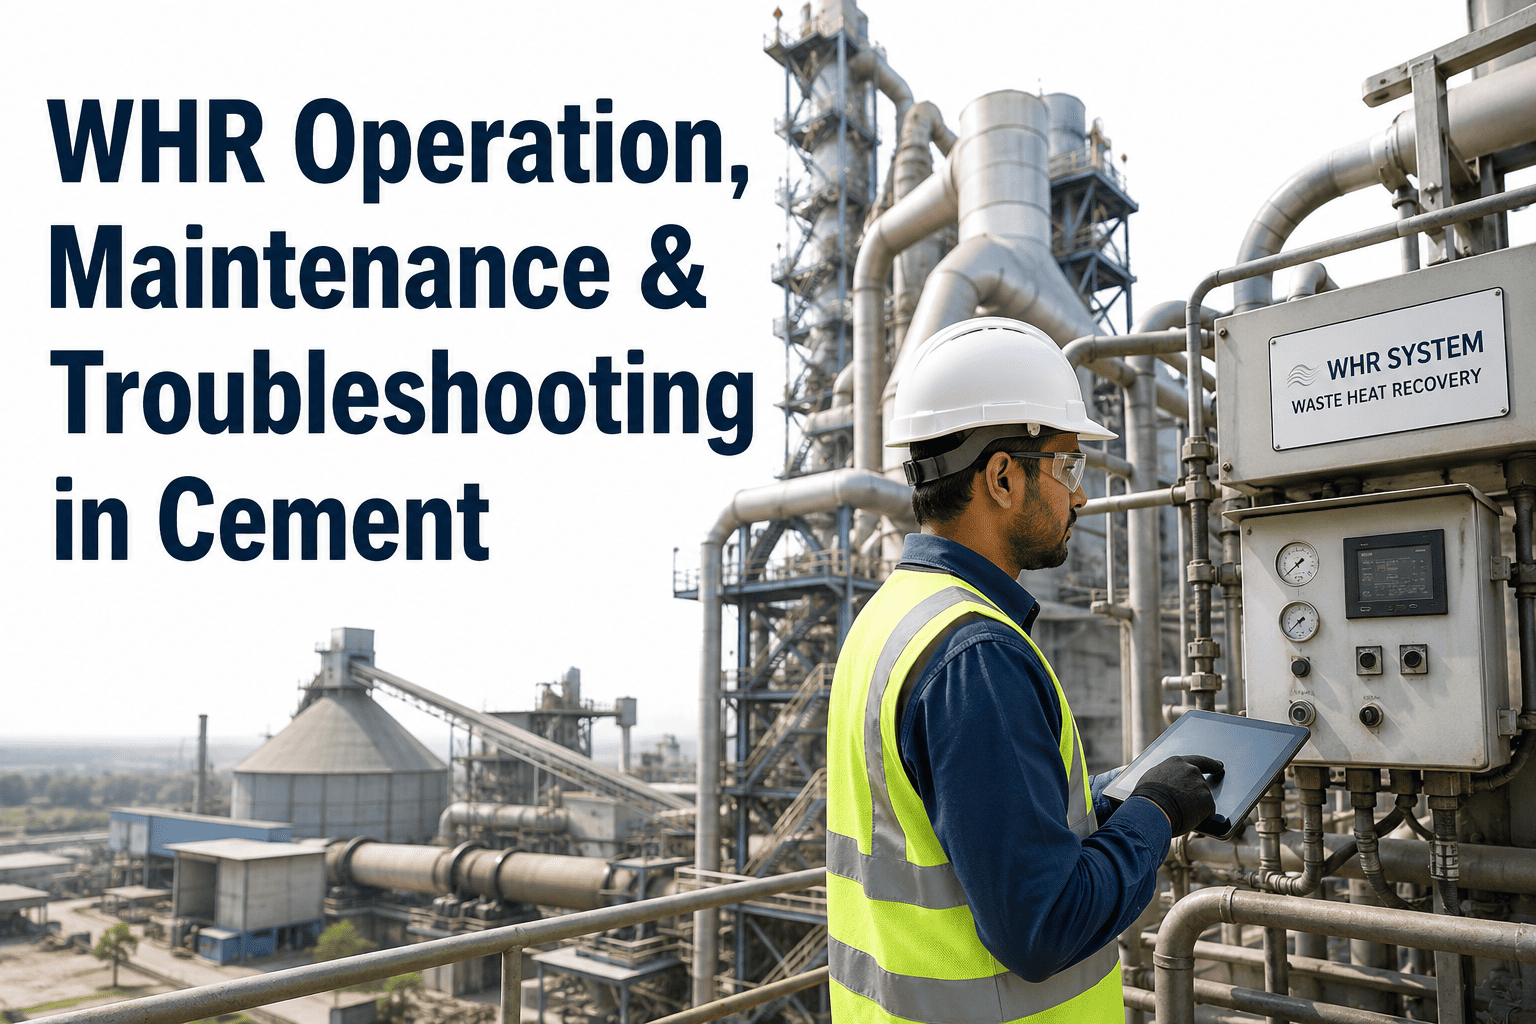
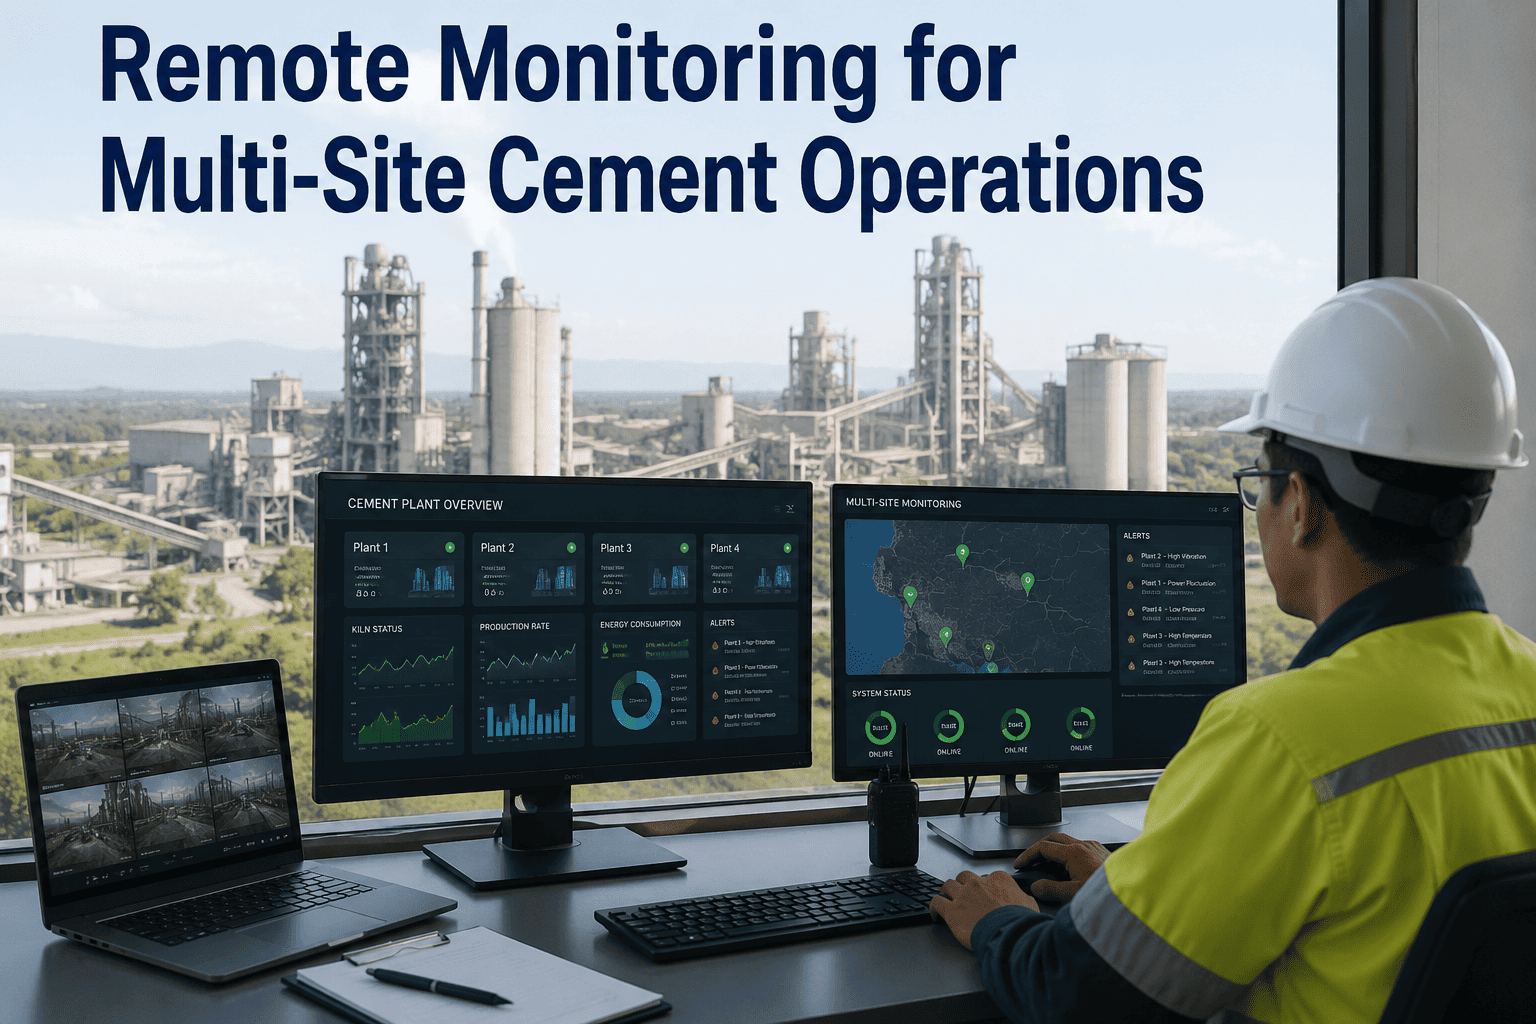
The calciner and riser duct are integral components of modern cement production, serving as the primary zones for raw meal preheating and calcination. Inefficient monitoring of these areas can lead to material buildup, partial or complete blockage, and dangerous temperature excursions that compromise both production throughput and equipment integrity. For plant operators and maintenance teams, understanding the root causes of these issues is critical to minimizing unplanned downtime. This article provides a comprehensive technical analysis of calciner and riser duct monitoring, covering detection methods, preventive strategies, and best practices for continuous operational health. By leveraging real-time data and predictive analytics, cement plants can significantly reduce the risk of calciner failures. To explore how advanced monitoring solutions can be tailored to your plant's specific needs, Book a Demo today.
Optimize Your Calciner Performance Now
Prevent costly blockages and temperature excursions with real-time monitoring. Let our experts guide you toward zero unplanned downtime.
Core Monitoring Parameters for Calciner & Riser Duct
Material Buildup Detection
Continuous monitoring of pressure differentials across the calciner and riser duct reveals early signs of material accumulation. A gradual increase in pressure drop indicates buildup, while sudden spikes suggest partial blockage. Thermal imaging and acoustic sensors provide additional validation, enabling targeted cleaning before critical obstruction occurs.
Temperature Profile Analysis
Temperature excursions in the calciner can stem from fuel imbalances, raw meal feed fluctuations, or refractory degradation. Deploying a dense network of thermocouples along the riser duct and calciner walls allows for precise hotspot detection. Advanced analytics correlate temperature anomalies with operational parameters to identify root causes swiftly.
Blockage Dynamics & Flow Patterns
Riser duct blockages often originate from sticky raw meal deposits or improperly sized alternative fuels. Monitoring gas velocity and static pressure at multiple elevations helps map flow disruptions. Computational fluid dynamics (CFD) models, when fed with real-time data, predict blockage formation and recommend preventive actions such as air cannons or sonic horns activation.
Refractory Health & Structural Integrity
Refractory lining degradation accelerates material adhesion and temperature spikes. Using laser scanning and infrared thermography, teams can assess refractory thickness and detect spalling. Integrating this data with calciner operating hours and thermal cycles enables condition-based maintenance scheduling, extending refractory life by up to 30%.
Step-by-Step Calciner Monitoring Implementation
Sensor Network Design
Install pressure transmitters, thermocouples, and acoustic sensors at critical locations: calciner inlet, outlet, riser duct bends, and transition zones. Ensure redundancy for high-temperature areas.
Data Acquisition & Edge Processing
Deploy edge computing units that sample sensor data at 1-second intervals, performing initial filtering and anomaly detection locally to reduce latency and bandwidth requirements.
Predictive Model Training
Use historical data of past blockages and temperature events to train machine learning models. Features include pressure drop rate of change, temperature gradient, and fuel flow variability.
Dashboard & Alert Configuration
Create a centralized dashboard showing real-time KPIs (calciner delta-P, riser duct temperature map, refractory health index). Configure mobile alerts for pre-blockage warnings and temperature exceedances.
Continuous Optimization & Feedback Loop
Review model accuracy monthly and retrain with new data. Adjust cleaning schedules (air cannons, sonic horns) based on predictive outputs. Document all events for root cause analysis.
Transform Your Calciner Operations
Stop reacting to failures. Start predicting them. Our monitoring suite gives you full visibility into calciner and riser duct health.
Comparative Analysis: Monitoring Technologies for Calciner & Riser Duct
| Technology | Detection Capability | Response Time | Installation Cost | Maintenance Requirement |
|---|---|---|---|---|
| Pressure Transmitters | Buildup, blockage | Real-time | Low | Quarterly calibration |
| Thermocouple Arrays | Temperature excursions | 1-2 seconds | Medium | Annual replacement |
| Acoustic Sensors | Material flow anomalies | Sub-second | Medium | Bi-annual cleaning |
| Infrared Thermography | Refractory hotspots | 5-10 minutes | High | Monthly lens inspection |
| Laser Scanning | Refractory thickness | Per shift | High | Annual calibration |
Root Causes of Calciner Buildup
Material buildup in the calciner is primarily driven by low gas velocities, high moisture content in raw meal, and improper fuel combustion. When the calciner operates below its design gas velocity, fine particles settle and agglomerate on walls and refractory surfaces. Additionally, the use of high-moisture alternative fuels can introduce sticky ash that adheres to surfaces. Temperature fluctuations below the calcination threshold (typically 850-900°C) prevent complete decomposition, leaving partially calcined material that forms hard crusts. Monitoring gas velocity and moisture content at the calciner inlet provides early warnings, allowing operators to adjust fan speeds and fuel mix ratios before buildup becomes critical.
Riser Duct Blockage Mechanisms
Riser duct blockages often originate from the accumulation of coarse particles that settle in horizontal or low-velocity sections. The presence of large clinker fragments or oversized alternative fuel pieces can create a dam effect, trapping finer material behind them. Temperature gradients along the riser duct also contribute: cooler zones near the duct walls cause condensation of volatile compounds (e.g., alkali sulfates), which act as binding agents. Real-time monitoring of differential pressure across the riser duct, combined with temperature profiling, can pinpoint the exact location and severity of a developing blockage. Automated cleaning systems such as air cannons, when triggered by predictive alerts, can dislodge material before it consolidates.
Frequently Asked Questions
What are the early signs of calciner buildup?
How often should riser duct inspections be performed?
Can temperature excursions be prevented entirely?
What is the typical ROI for calciner monitoring systems?
How do alternative fuels affect calciner monitoring?
Ready to Eliminate Calciner Blockages?
Join industry leaders who have achieved 99% uptime with our real-time monitoring solutions. Take the first step toward operational excellence.