A preheater blockage doesn't announce itself. It starts as a few millimeters of alkali-rich coating clinging to the wall of a Stage 4 cyclone, and three to six weeks later it has narrowed the gas path enough to swing draft, spike O2 readings, and eventually stop kiln feed cold. Most plants only find out how far the buildup had progressed after a 50 to 200kg slab of it lets go and blocks a duct outright, and by then the fix costs a shutdown measured in hours rather than the trim it would have taken a week earlier. Cement producers running four to six stage preheaters lose an average of $180,000 to $650,000 in output and emergency clearing labor per blockage event, and more than 60% of those events trace back to coating that had been building in plain sight of instrumentation nobody was watching closely enough. Catching that curve before it becomes a shutdown is what separates a preheater running at rated capacity from one that surprises the control room every few weeks, and it starts with knowing exactly where and why the coating actually forms — something worth walking through against your own stage data in a demo.
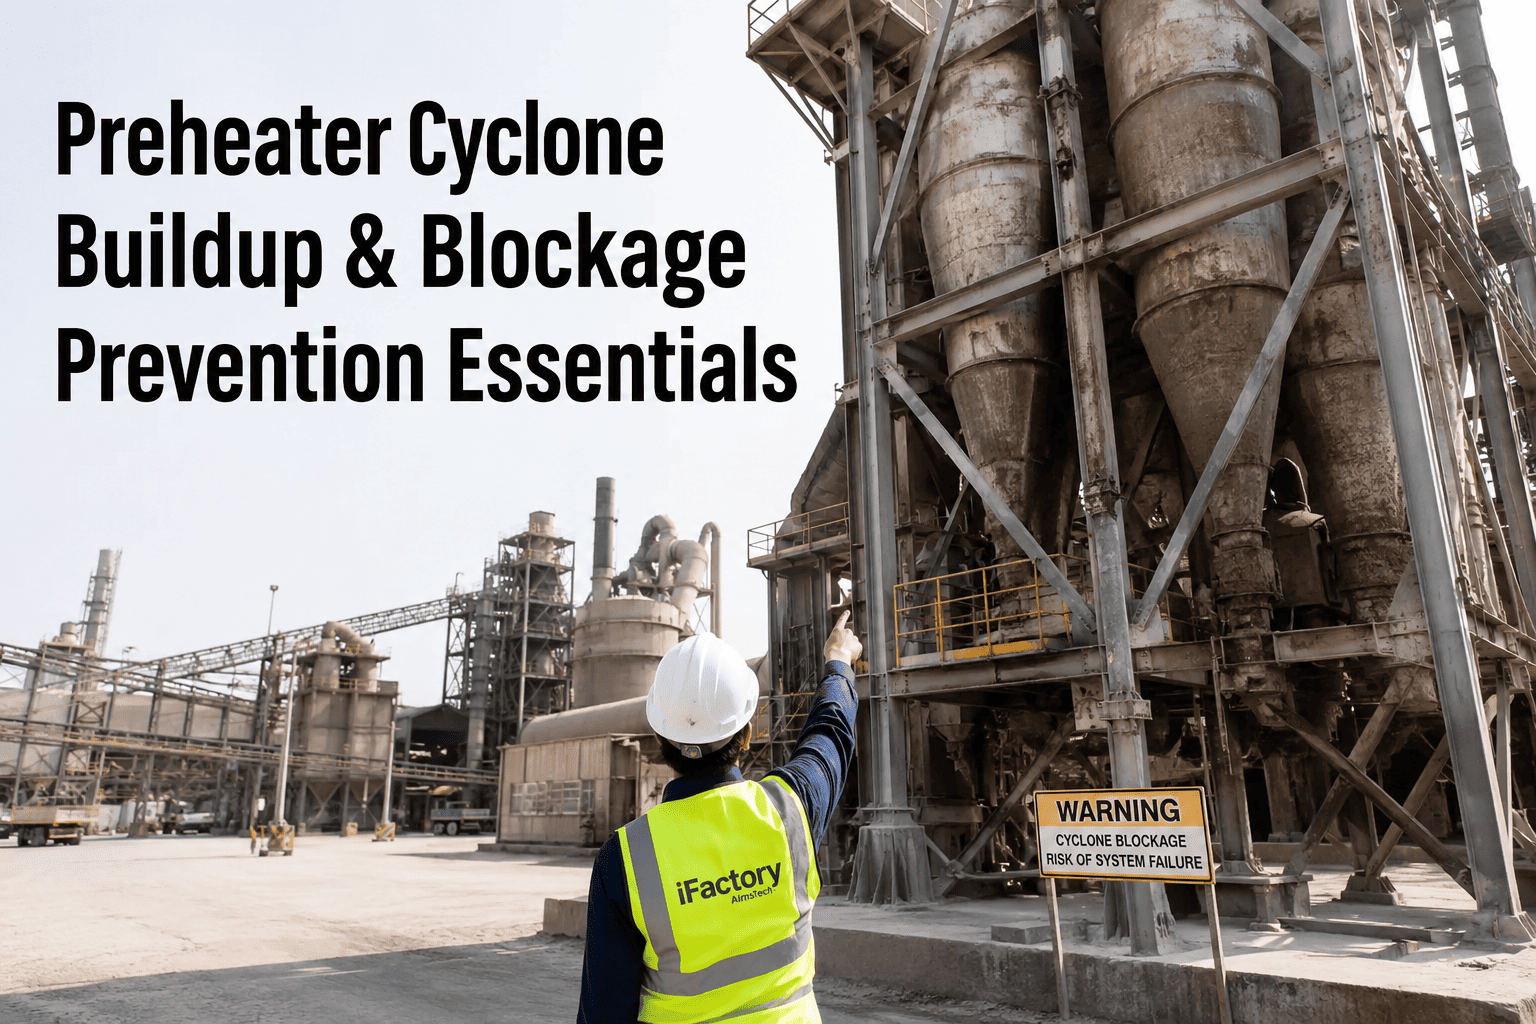
Preheater Cyclone Buildup and Blockage Prevention
Raw material chemistry, alkali management, and cleaning strategy — the three levers that keep a cyclone preheater running at stable performance instead of drifting toward its next unplanned clearing shift.
Why the Coating Forms in the First Place
Every raw mix carries a small load of alkalis, chlorides, and sulfates riding along with the calcium carbonate, silica, and alumina. In the burning zone of the kiln, at temperatures well above 1,400°C, those trace compounds volatilize into the gas stream. As that gas moves counter-current up through the preheater tower, it cools stage by stage, and somewhere between 800°C and 900°C the volatile compounds condense back out — not evenly, but preferentially onto the coolest available surface, which is usually the cyclone wall or the inside of a riser duct. This is the alkali cycle: evaporate in the kiln, condense in the preheater, get carried back down with the meal, and evaporate again. Left unmanaged, the cycle concentrates rather than dilutes, because each pass adds a little more from the incoming raw material and fuel.
The reason this shows up as a physical blockage rather than a chemistry footnote is that the condensed alkali chlorides and sulfates are sticky at the intermediate temperatures where they form. They act as a glue that binds fine kiln dust into a crust on cyclone walls and duct bends. That crust doesn't stay put — it thickens under continued gas flow, and either it gradually narrows the cross-section of a duct until draft resistance rises, or a slab of it finally breaks free under its own weight and drops onto whatever is downstream, which is exactly the mechanism behind most sudden blockage events.
What's Condensing Where, and What It Turns Into
Not every buildup is the same compound behaving the same way. Chlorides, sulfates, and potassium salts condense at different points in the temperature curve and produce different failure modes, which is why a single generic "clean everything more often" policy tends to under-treat the highest-risk zones and over-treat the low-risk ones.
| Zone | Approx. Temperature | Dominant Compound | Typical Failure Mode |
|---|---|---|---|
| Stage 1–2 cyclone walls | 950–1,050°C | Minimal condensation | Rarely a blockage source |
| Stage 3 riser duct bends | 870–920°C | Early alkali sulfates | Gradual cross-section narrowing |
| Stage 4–5 inlet ducts | 800–900°C | Alkali chlorides & sulfates | Coating falls of 50–200kg |
| Calciner throat | 850–880°C | Mixed volatiles + fuel ash | Meal chute plugging |
| Kiln inlet / riser | >1,000°C then dropping | Concentrated chlorides | Ring formation, feed interruption |
Most Buildup Events Are Predictable Weeks Before They Block Anything
iFactory tracks differential pressure, exit gas temperature, and O2 drift stage by stage so a slow coating trend shows up as a chart line, not a control room alarm at 3am.
What a Narrowing Duct Looks Like on the Control Room Screen
A blockage rarely appears without warning in the process data — it appears without warning in the control room, because the process data was either not being watched closely enough or was drifting too slowly for a shift operator to flag against a busy panel of readings. These are the signals worth watching stage by stage rather than as a single tower-wide average.
Periodic Manual Checks vs Continuous Stage Monitoring
Most plants already log preheater differential pressure and exit temperatures, but the review cadence is often shift-to-shift or daily, which is too coarse to catch a 5 to 15mm-per-week buildup rate before it crosses a critical threshold. The gap isn't a lack of sensors — most plants already have them — it's the absence of a system that turns raw trend data into an early, stage-specific flag.
| Factor | Periodic Manual Review | Continuous AI-Based Monitoring |
|---|---|---|
| Review frequency | Shift-to-shift or daily log review | Continuous, every process scan |
| Detection basis | Operator experience and recall | Stage-specific trend and rate-of-change modeling |
| Typical lead time | Hours before symptoms are obvious | Days to weeks ahead of critical threshold |
| Blind spots | Slow drifts masked by normal process noise | Cross-checked against multiple correlated signals |
| Response trigger | Alarm after threshold breach | Early flag while buildup is still manageable |
Four Levers That Actually Break the Cycle
Detection buys warning time, but the underlying fix is limiting how much alkali, chloride, and sulfate is allowed to keep recirculating. These four levers are the ones cement plants combine, in different proportions depending on raw material and fuel chemistry, to keep the cycle from concentrating past the point where coating becomes unavoidable.
A Stage 4 Trend That Never Became a Shutdown
A 4,500 tpd line running a high-alkali local raw mix had a history of one to two Stage 4 blockage events per quarter, each costing roughly 14 hours of downtime plus a full shift of manual clearing. Differential pressure at Stage 4 had always been logged, but only reviewed during daily shift handover, by which point the reading had usually already crossed into alarm territory.
After stage-specific pressure and outlet temperature trending was set up to flag rate-of-change rather than absolute threshold, the same underlying buildup pattern that used to reach alarm level in week five instead triggered an early flag in week two — while differential pressure was still climbing gradually rather than spiking. The plant scheduled a targeted air-cannon cleaning pass at the next planned stop, four days later, instead of an unplanned clearing shift. The following quarter passed without a single unplanned Stage 4 event.
Five Questions Before Your Next Blockage Event
These are the questions worth answering honestly before assuming your preheater's buildup is under control — most plants find at least one gap once they walk through them stage by stage.
| # | Question | Why It Matters |
|---|---|---|
| 1 | Is Stage 4–5 differential pressure trended, not just logged? | Trend data reveals rate-of-change; a single reading doesn't |
| 2 | Do you know your current false air percentage at the preheater exit? | Every 1% above target wastes roughly 3 kcal/kg clinker |
| 3 | Is chloride and alkali input from alternative fuels tracked separately? | Alternative fuels often carry higher volatile loads than raw material alone |
| 4 | Are air cannons and dip tubes on a verified inspection schedule? | Cleaning equipment failure is a common hidden cause of buildup escalation |
| 5 | Would a slow week-over-week drift get flagged before the weekend shift? | Most large coating falls occur after a drift nobody escalated in time |
Preheater Buildup and Blockage Prevention — What Plants Usually Ask
Turn Every Cyclone Stage Into a Trend Line, Not a Guessing Game
See how iFactory tracks differential pressure, temperature spread, and draft stage by stage to flag buildup weeks before it becomes a shutdown — using your own preheater's data, not a generic threshold.