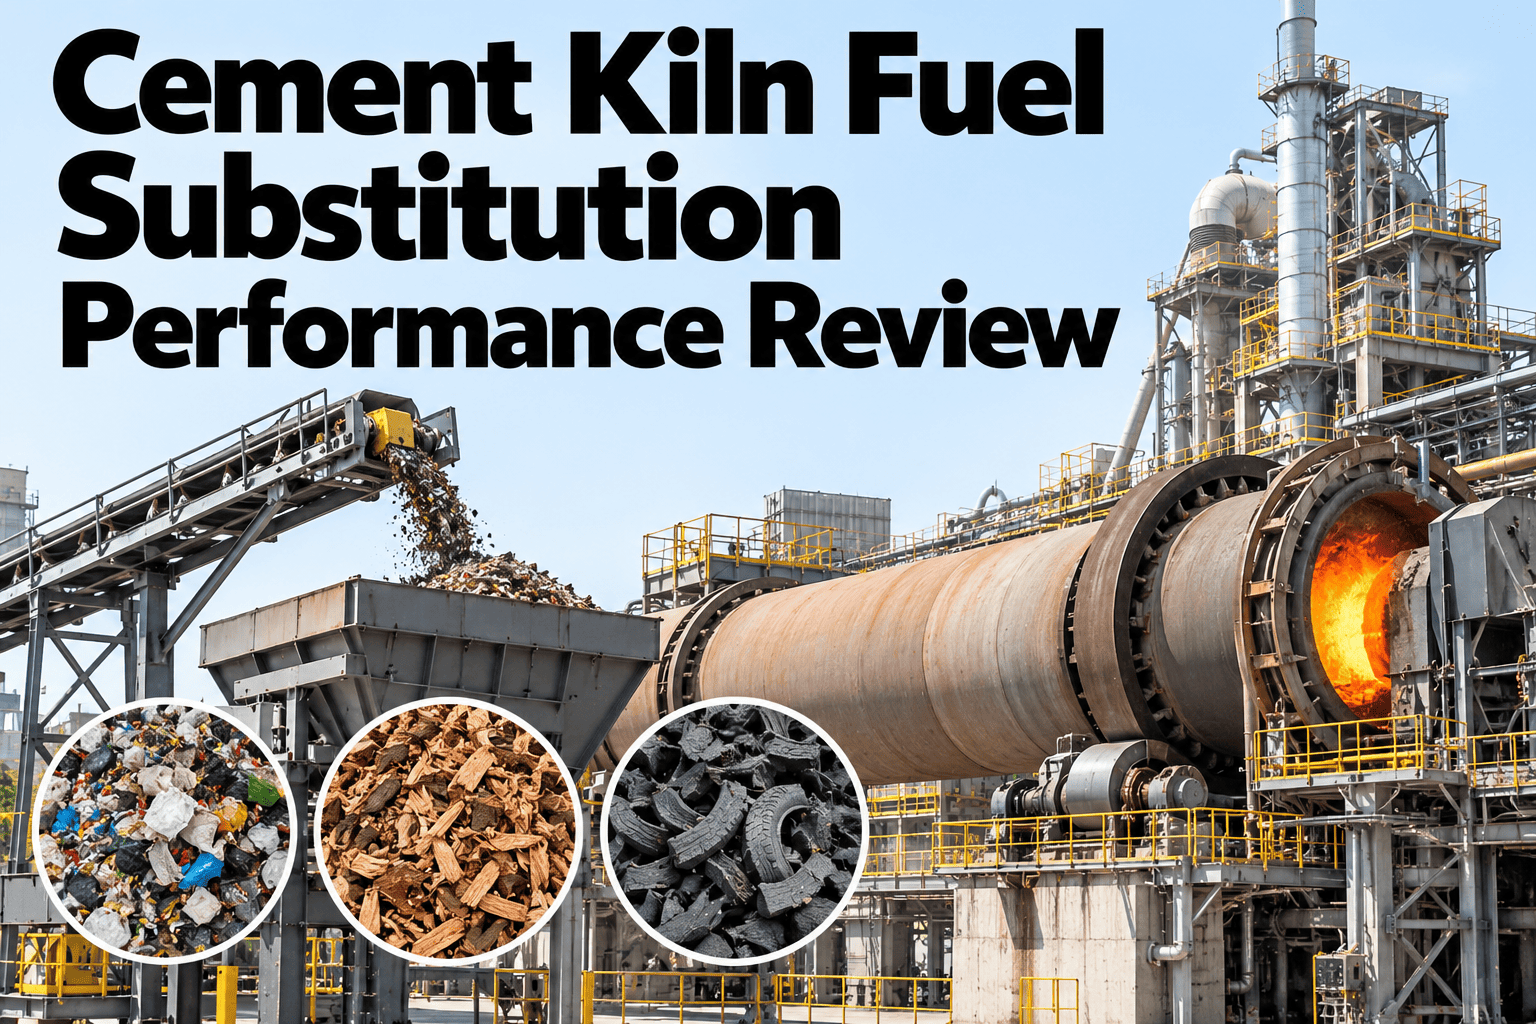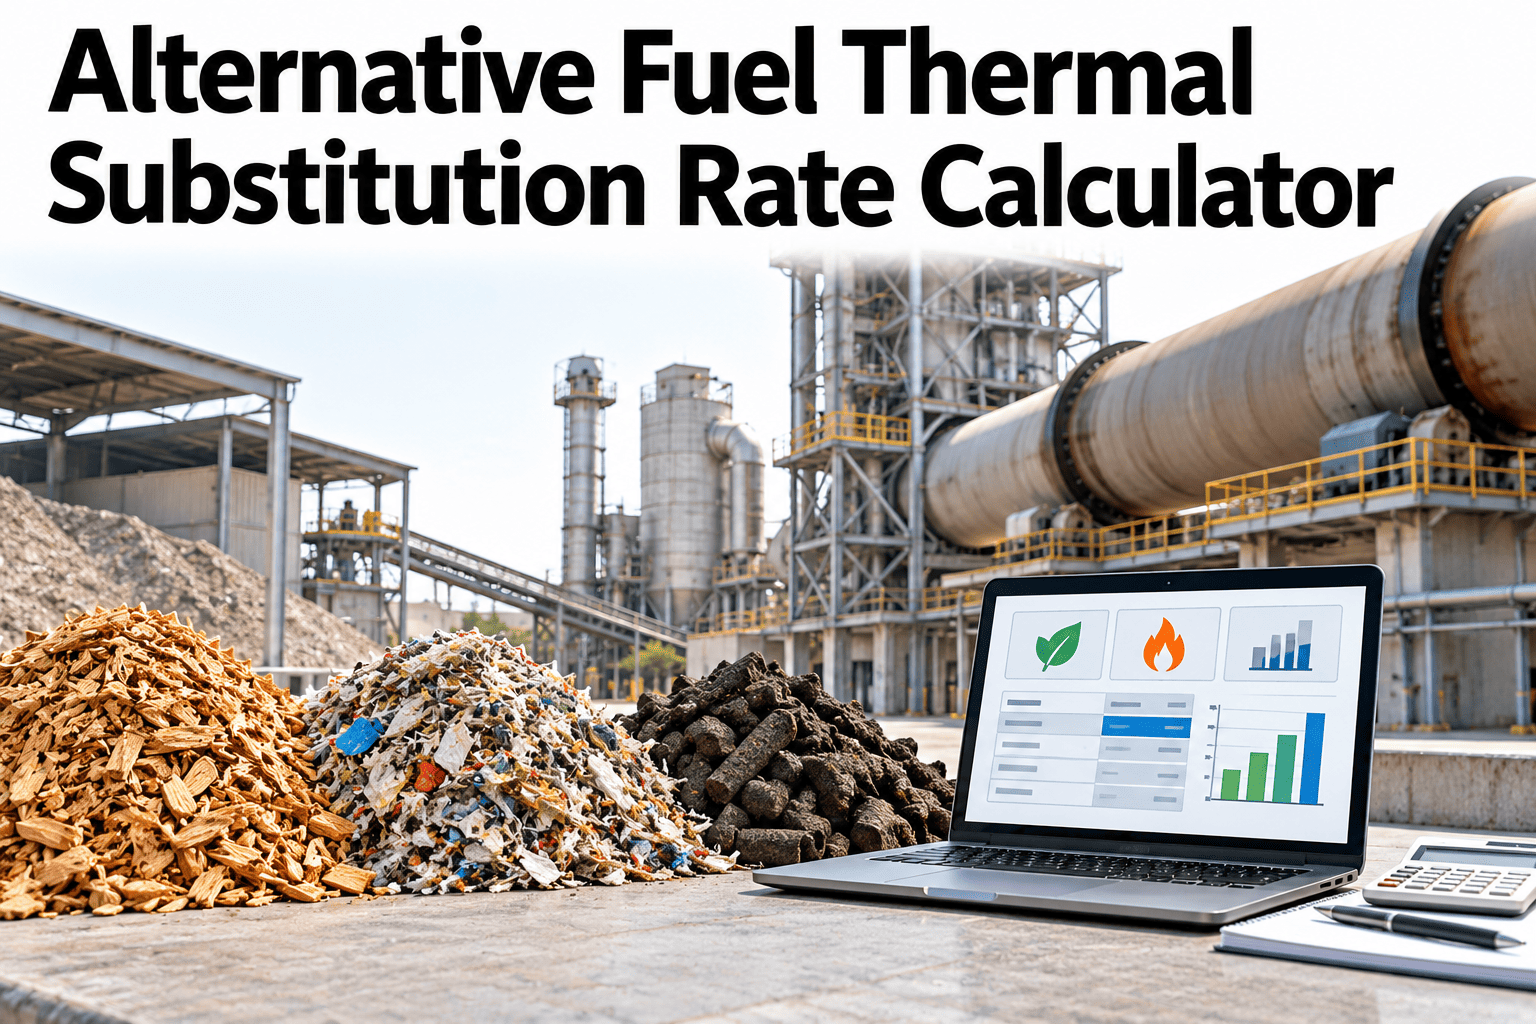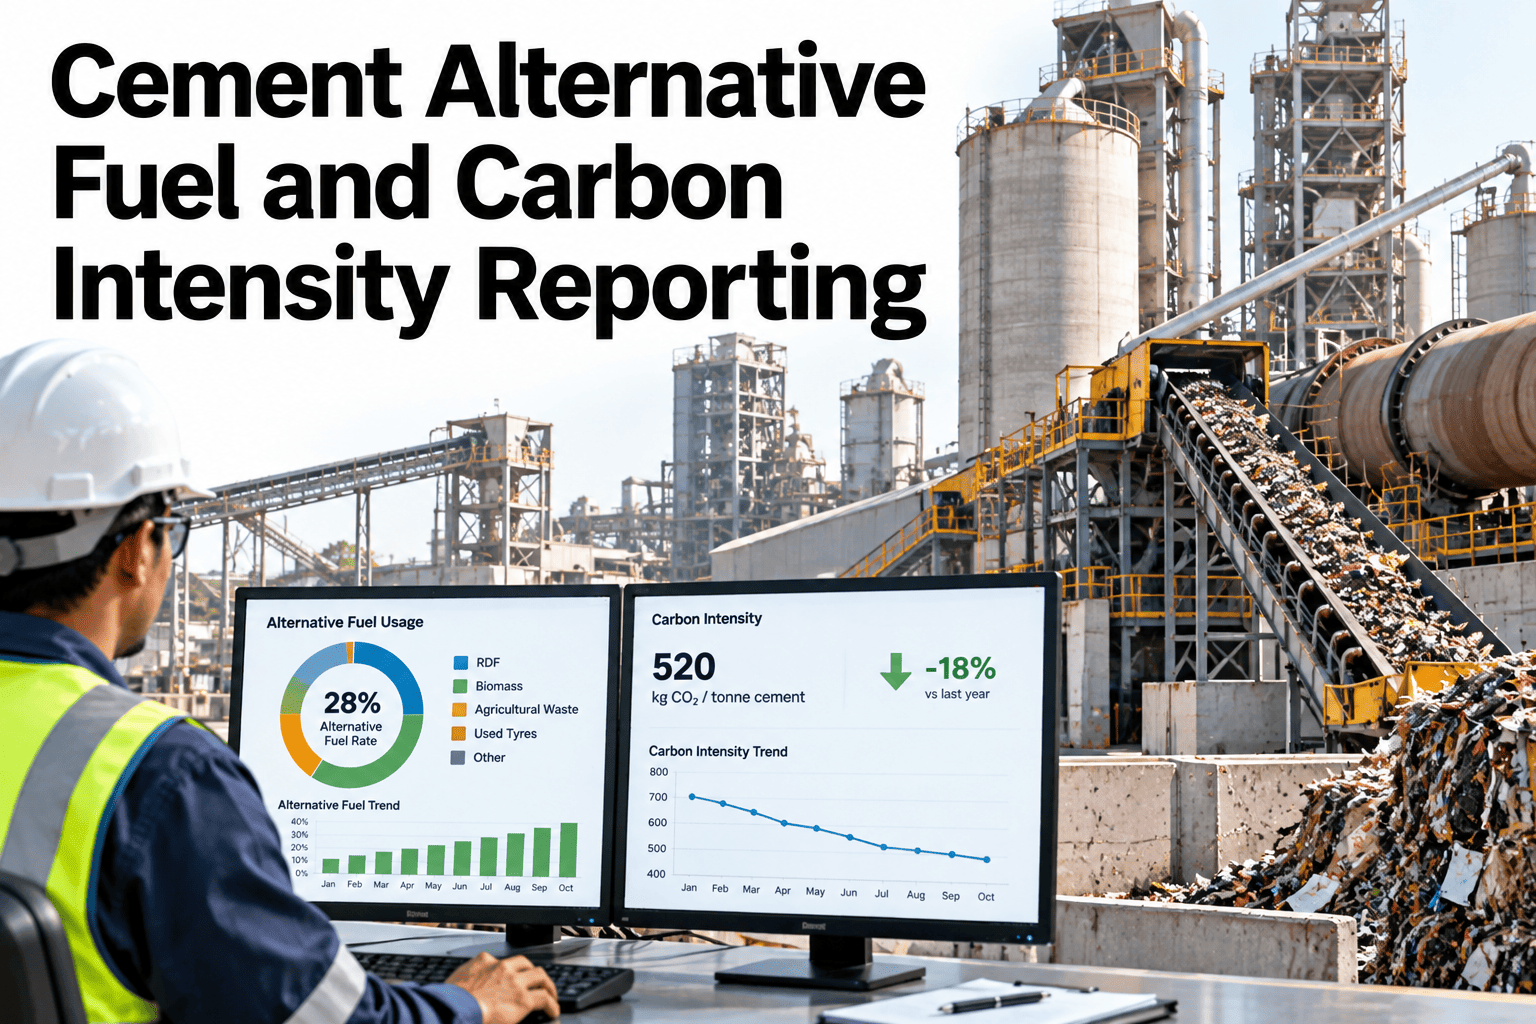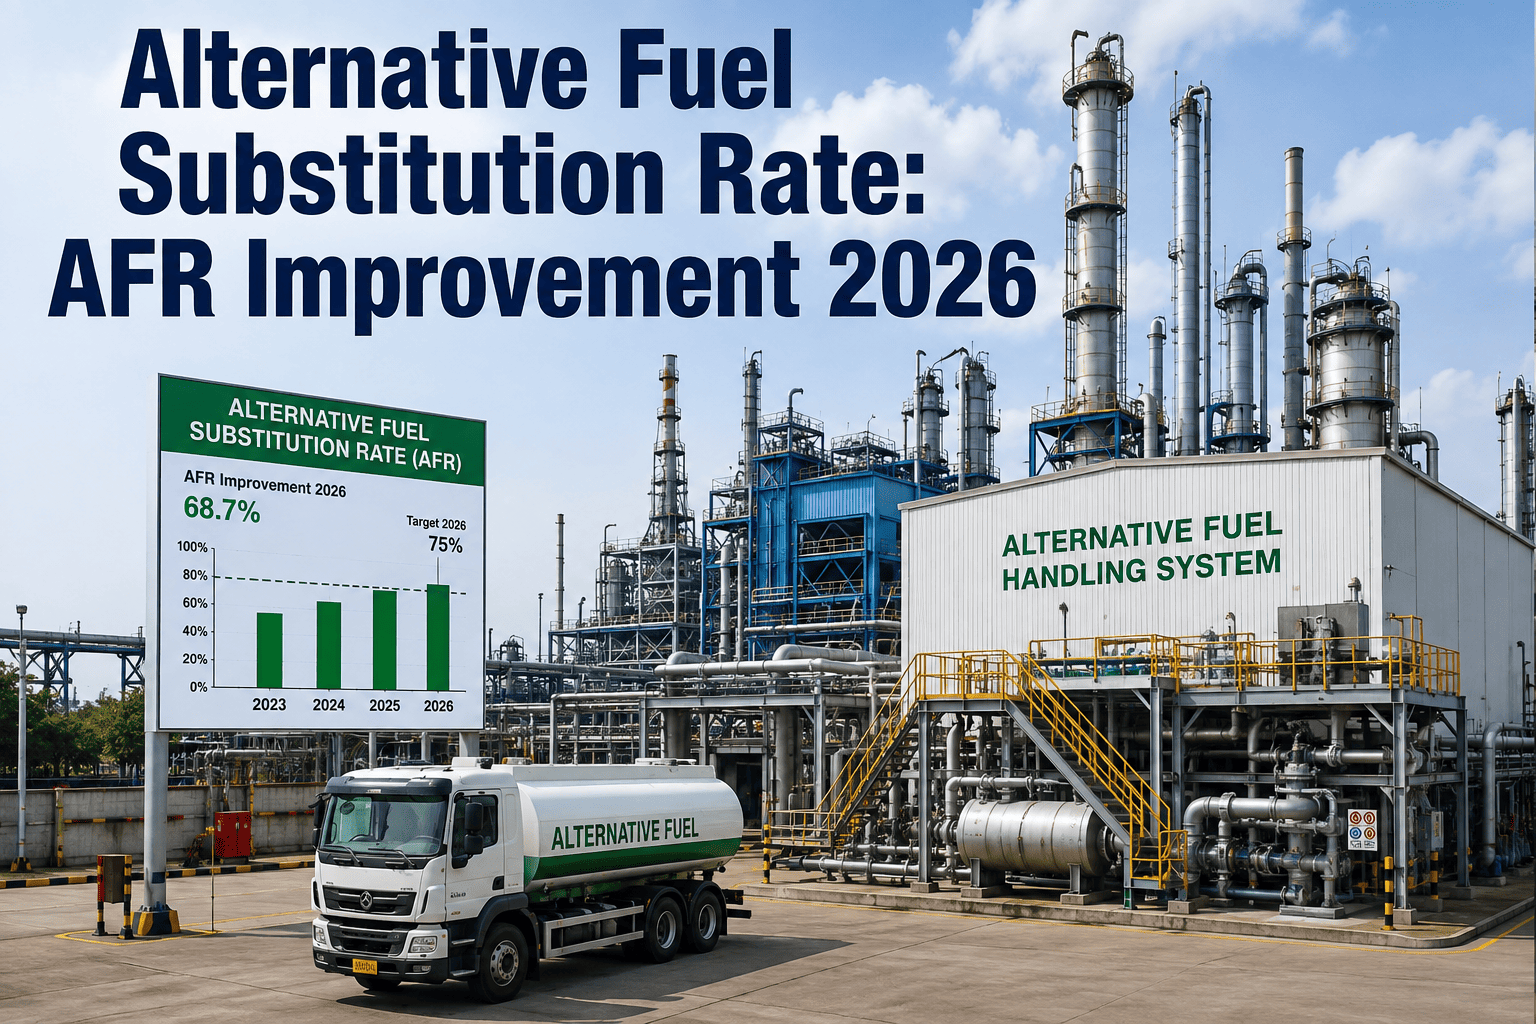
Cement decarbonization conversations often start with a single headline number, total CO2 emissions, when the metrics that actually drive that number down live one level deeper. Thermal substitution rate, clinker factor and energy intensity each move the needle differently, and a plant team without a shared KPI dictionary ends up with different people tracking different numbers, sometimes calculated differently, making progress hard to compare over time or across plants. A defined KPI framework, with clear definitions and a governance cadence, is what keeps a decarbonization program measurable rather than aspirational. Plant teams can review their own KPI definitions against this framework in a short session.
The Metrics Underneath the Headline CO2 Number
iFactory tracks thermal substitution rate, clinker factor and energy intensity on one shared KPI framework, consistently defined and calculated.
KPI Dictionary
A shared definition for each KPI, agreed and documented once, is what lets a number mean the same thing whether it's calculated by the kiln team, the sustainability team or a different plant in the network.
| KPI | What It Measures | Why It Matters for Decarbonization |
|---|---|---|
| Thermal substitution rate (TSR) | Share of kiln thermal energy from alternative fuels versus fossil fuel | Directly reduces fossil fuel-driven emissions as it rises |
| Clinker factor | Share of clinker in the final cement product | Lowering clinker factor is one of the largest levers on embodied CO2 per tonne |
| Energy intensity | Energy consumed per tonne of clinker or cement produced | Improving efficiency reduces both cost and emissions together |
| CO2 intensity | CO2 emitted per tonne of cementitious product | The composite figure that reflects the combined effect of the other KPIs |
Energy Intensity and Thermal Substitution Rate
Consistent Energy Intensity Calculation
A shared definition of which energy sources count, and against which production basis, keeps the figure comparable period to period.
TSR Tracked by Fuel Source
Thermal substitution rate is broken down by specific alternative fuel source, showing which are actually driving the rate up.
Clinker Factor by Product Line
Clinker factor tracked by cement product type shows where blended cement formulations are making the most difference.
See These KPIs Built From Your Own Plant Data
Book a 30-minute session and iFactory will build a sample KPI framework from your own production and energy data.
Governance and Review Cadence
A KPI framework without a review cadence tends to drift, with definitions quietly diverging across teams over time. A defined governance structure keeps the framework consistent.
Where iFactory Fits
iFactory builds a connected KPI framework from your plant's production, energy and fuel data, with consistent definitions and a governance structure.
Standardized KPI Dictionary
Shared, documented definitions keep every KPI consistent across teams and plants.
Connected Lever-to-Scoreboard View
TSR, clinker factor and energy intensity are shown alongside CO2 intensity, making the connection between lever and outcome visible.
Fuel-Source Level TSR Tracking
Thermal substitution rate is broken down by fuel source, supporting targeted decisions on alternative fuel investment.
Governance Cadence Support
A defined review schedule keeps KPI definitions current as processes and fuel mixes change.
Reviewed by iFactory's Cement Solutions team for alignment with general cement decarbonization KPI practice. Specific feature capabilities should be validated against current product functionality, and KPI calculation methods should align with your applicable carbon accounting and reporting standards.
Frequently Asked Questions
Does this KPI framework align with established carbon accounting standards?
The framework is built to be configurable against the specific standard your reporting requires, since calculation methodology can vary, and should be validated against your applicable standard before being used for external reporting. Support can review alignment with your specific reporting standard.
How often should the KPI dictionary be reviewed?
An annual review is common, though a significant process or fuel mix change should trigger an off-cycle review to confirm definitions still reflect current operations.
Can this track KPIs across multiple plants consistently?
Yes, a shared KPI dictionary applied across plants is exactly what enables meaningful cross-plant comparison, rather than each plant calculating its own figures independently. Discuss your plant data and use case to see this applied across your own network.
What data is needed to calculate thermal substitution rate accurately?
Fuel consumption data by source, both fossil and alternative, along with their respective heat content, is the core input needed to calculate TSR accurately rather than estimate it.
How does this support a decarbonization roadmap or target-setting process?
A consistent historical baseline across these KPIs is the foundation for setting a credible, trackable decarbonization target, rather than setting a goal against inconsistent historical data. Ask support how this supports your roadmap process.
Build One Shared Scoreboard for Decarbonization Progress
iFactory connects TSR, clinker factor and energy intensity to your CO2 intensity figure. Discuss your plant data and use case.