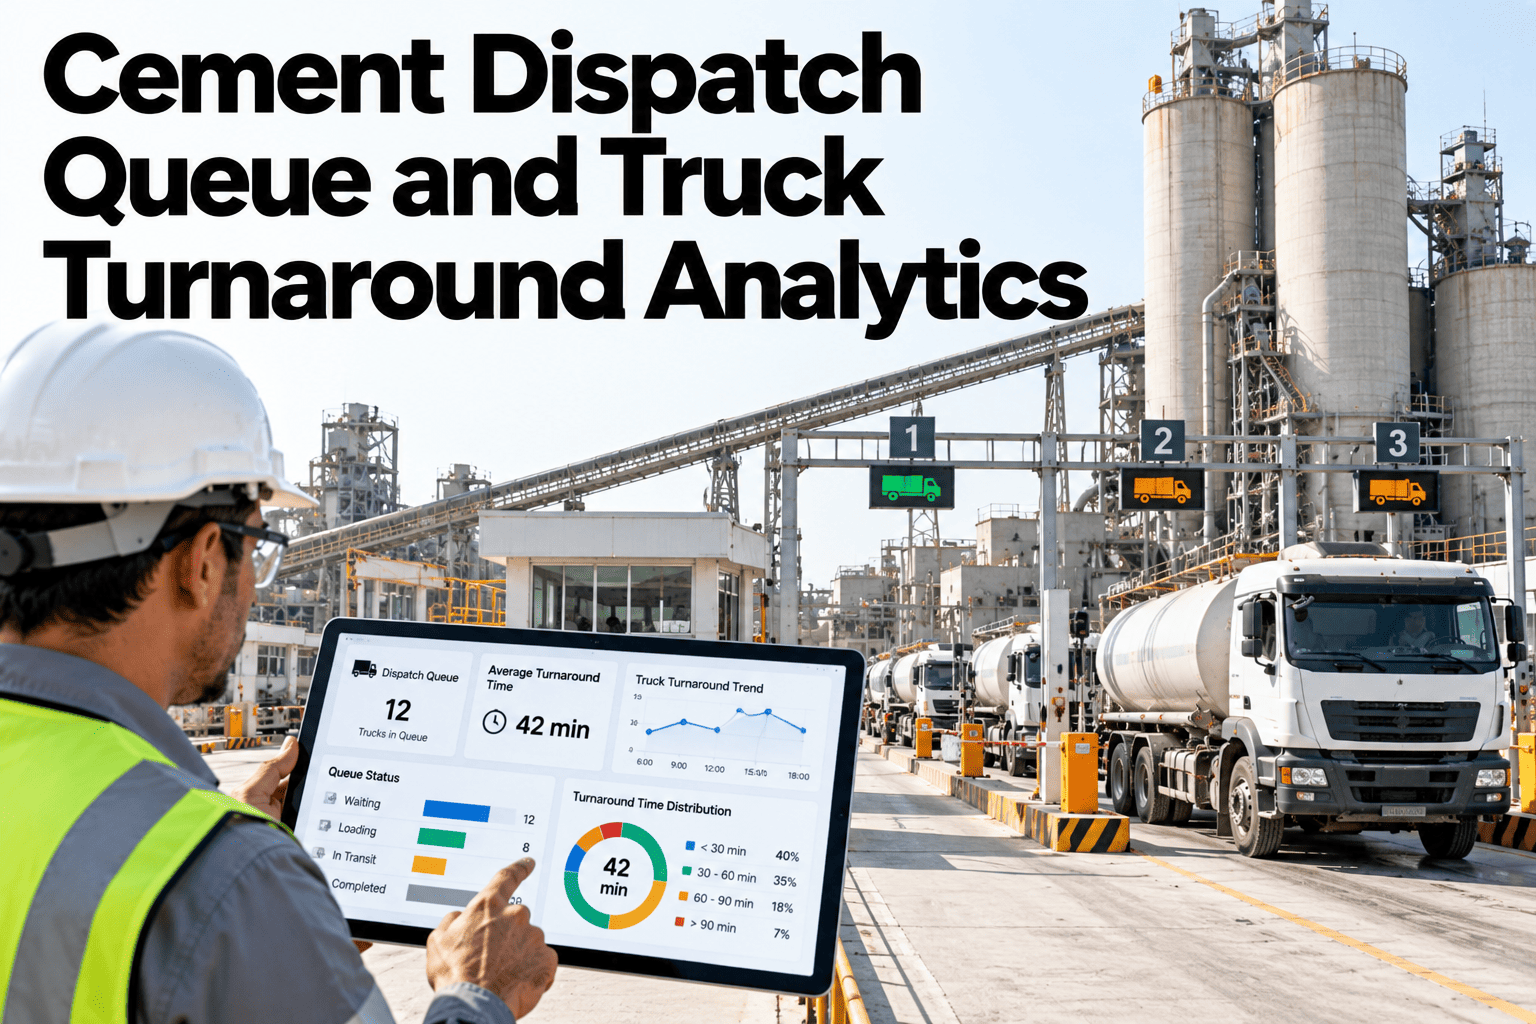
A truck that sits for two hours at a cement plant gate is not two hours of one problem. It is usually ten or fifteen minutes lost at each of several steps: queueing, weighing in, loading, weighing out and exiting, none of which looks alarming on its own. Dispatch queue analytics exist to pull those minutes apart so the real delay can be found and fixed, rather than blamed generically on "the gate being slow." Teams ready to see their own dispatch data this way can book a demo with the iFactory AI team.
Cement Dispatch Queue and Truck Turnaround Analytics
Truck turnaround time is the sum of several distinct steps. Timestamping each one separately turns a single frustrating average into a map of exactly where the minutes are going.
Timestamp Capture Across the Cycle
Every useful dispatch metric starts with a consistent, automatically captured timestamp at each step. A manually written gate log loses precision fast, especially during a busy shift when writing the time down is the last thing anyone wants to stop for.
| Step | Capture Method | Typical Source |
|---|---|---|
| Gate entry | Automatic on vehicle detection | Boom barrier or camera system |
| Weighbridge in | Automatic on weight stabilization | Weighbridge system |
| Loading start and end | Automatic from loading bay signal | Loading bay PLC |
| Weighbridge out | Automatic on weight stabilization | Weighbridge system |
| Gate exit | Automatic on vehicle detection | Boom barrier or camera system |
Queue Time Before the First Weigh
Queue time, the gap between gate entry and the start of weighing in, is often the single largest and most variable segment of the cycle. It is also the segment most sensitive to upstream conditions like packing line availability and loading bay occupancy.
In this illustrative view, queue time nearly quadruples between off-peak and peak hours, in minutes. Without the breakdown, that swing just reads as an unpredictable average turnaround time. With it, the plant can see exactly which hours need either staggered truck scheduling or added loading capacity.
Loading Duration
Loading duration itself is usually the most consistent step in the cycle, which makes any deviation from it worth investigating immediately rather than averaging away.
See Exactly Where Turnaround Time Goes
iFactory AI breaks down every dispatch cycle into queue, weighbridge and loading segments, so the real delay is visible, not guessed at. Book a 30-minute walkthrough.
Weighbridge Steps
The two weighbridge crossings, in and out, are short individually but add delay whenever the weighbridge becomes a shared bottleneck for multiple loading bays. Tracking wait time at the weighbridge separately from the weighing itself clarifies whether the fix is a process change or added capacity.
| Segment | What It Measures |
|---|---|
| Wait for weighbridge | Time queued behind other trucks at the scale |
| Weighing time | Time for the weight reading itself to stabilize and record |
| Documentation time | Time for paperwork or digital ticket generation |
Delay Categories
Not every delay has the same root cause, and grouping them into categories makes the pattern across a week or a month much easier to act on than reviewing individual truck records one by one.
Shift and Carrier Reports
Turnaround time patterns often trace back to a specific shift or even a specific carrier's drivers, and a report that can be filtered either way turns a general complaint into something specific enough to discuss directly.
| Report View | What It Reveals |
|---|---|
| By shift | Whether staffing or process differs meaningfully between shifts |
| By carrier | Whether specific drivers or fleets consistently take longer |
| By hour of day | Peak windows that may need staggered scheduling |
| By delay category | Whether the biggest lever is production, documentation or capacity |
Plain-Language Glossary
A shared vocabulary keeps dispatch, production and customer-facing teams reading the same turnaround data the same way.
Expert Review
Dispatch teams reviewing turnaround programs across cement plants keep returning to the same two notes.
Loading is not the bottleneck
The step people assume is slowest, loading, is usually the most consistent one. Queue time before the first weigh is where the real variability lives, tied closely to the packer upstream.
Share data with carriers
Sharing turnaround data directly with repeat carriers, rather than keeping it internal, tends to improve driver punctuality and documentation accuracy faster than any internal change alone.
Frequently Asked Questions
Which step usually causes the longest delay?
Queue time before the first weigh is most often the largest and most variable segment, especially during peak dispatch hours, more so than loading or the weighbridge crossings themselves. Book a demo to see your own queue time breakdown.
Can packing downtime really affect dispatch turnaround?
Yes, a packer stop reduces bag availability, which backs up loading and lengthens the queue behind it, even though the delay shows up at the gate rather than the packer.
Do we need automated timestamp capture, or can we log manually?
Manual logs tend to lose precision during busy periods, exactly when the data matters most, so automated capture from gate, weighbridge and loading systems gives a far more reliable picture. Ask support which gate systems are commonly connected.
How should delays be categorized?
Grouping by production, documentation, capacity and equipment covers most cases and keeps the weekly review focused on a short, actionable list. Book a demo to see a sample delay category breakdown.
Can carrier-specific data be shared externally?
Many plants do share turnaround summaries with repeat carriers, since it tends to improve punctuality and documentation accuracy on the carrier's side.
Find the Real Source of Every Dispatch Delay
iFactory AI breaks down queue, weighbridge and loading time into a clear, categorized view by shift and carrier. Book a walkthrough built around your dispatch yard.