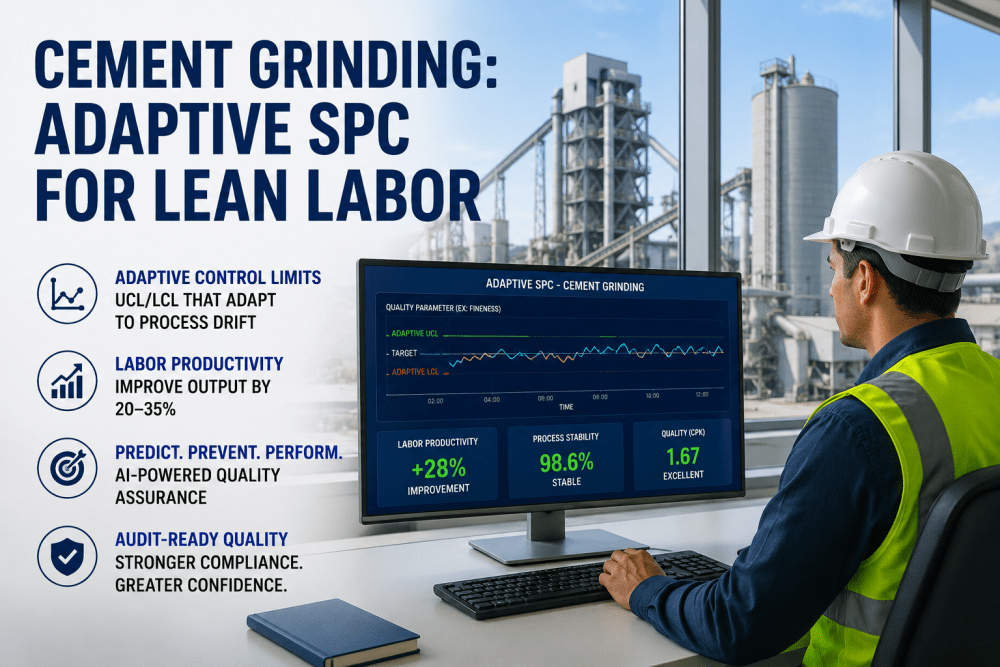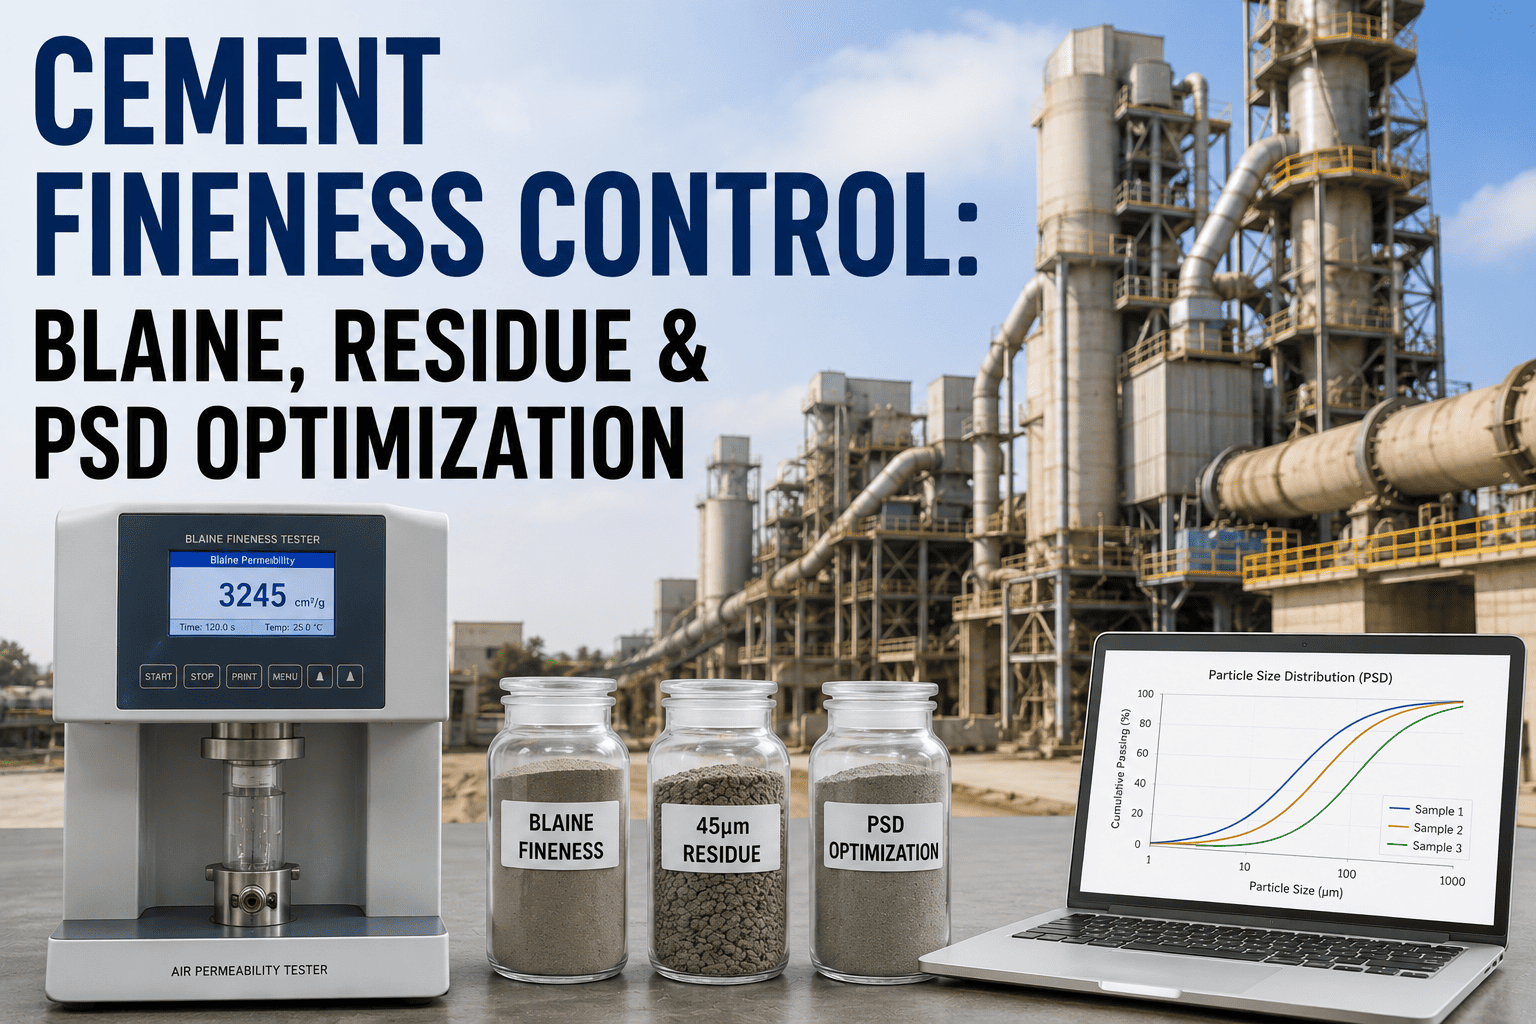
Two cement samples can carry the exact same Blaine number and behave completely differently in the field — one sets on schedule and hits strength targets, the other gives contractors early-age problems nobody can explain from the lab report. The difference almost always lives in the particle size distribution behind that single Blaine figure, not in the figure itself. Fineness control is where grinding efficiency and product quality intersect directly, and plants that manage it well are simultaneously protecting strength development and avoiding the energy cost of overgrinding. This article breaks down how Blaine, sieve residue, and full particle size distribution fit together, and how continuous fineness monitoring from iFactory keeps every batch inside spec without grinding a single unnecessary kilowatt-hour.
One Number Was Never Enough To Describe A Powder
Blaine fineness tells you total surface area. Sieve residue tells you what's left coarse. Neither one alone tells you the full particle size story, and neither catches a drifting separator until the batch is already out the gate. iFactory tracks all three together against your production data, in real time, so fineness deviations get caught before they reach the silo.
Three Ways To Measure The Same Powder
Cement fineness has been measured three different ways for decades, and each method answers a slightly different question. Relying on only one of them is exactly how two batches with identical headline numbers end up performing differently in concrete. Understanding what each method actually captures — and just as importantly, what it misses — is the foundation for building a fineness control program that catches real problems instead of chasing a single moving target.
The Particle Size Window That Actually Builds Strength
Not every micron of surface area contributes equally to cement performance. Particles below 30 microns drive the majority of strength development, particles under 10 microns matter most for early curing, and the 10 to 30 micron band carries more weight later in the hardening process. The commonly cited optimal window puts sixty to seventy percent of the total distribution between 3 and 30 microns, with another ten to twenty percent below 3 microns — and pushing meaningfully past that ultra-fine share is where overgrinding starts costing energy without buying any real strength in return.
The reason this window matters so much comes down to hydration chemistry rather than an arbitrary manufacturing preference. Particles below roughly 3 microns hydrate almost immediately after contact with water, which contributes to very early strength but adds comparatively little to the strength gained over the following weeks. Particles in the 3 to 30 micron band hydrate at a pace that lines up closely with the strength development curve that most specifications actually care about, which is why this band carries the heaviest weighting in a well-optimized distribution. Particles above 30 microns hydrate slowly and often incompletely — some of that coarse material may never fully react before the concrete has already reached its design strength, meaning that clinker is effectively wasted rather than contributing.
Typical Fineness Targets By Cement Type
Target Blaine and residue values shift meaningfully depending on the cement grade being produced, which is exactly why grade-specific setpoints matter more than a single plant-wide target. A rapid hardening cement is deliberately ground finer to accelerate early strength, while a low heat cement is deliberately kept coarser to slow the rate of hydration and limit thermal cracking risk in mass concrete pours. The ranges below reflect commonly referenced industry targets and should be validated against your own product specifications and applicable standards.
| Cement Type | Typical Blaine Range | 45-Micron Residue Target | Primary Quality Driver |
|---|---|---|---|
| Ordinary Portland Cement (OPC) | 300–380 m²/kg | ~8–12% | Balanced early and later strength |
| Portland Pozzolana / Blended Cement | 320–370 m²/kg | ~8–12% | Reactivity of the pozzolanic component |
| Rapid Hardening Cement | 400–450 m²/kg | ~5–8% | Maximized early-age strength |
| Low Heat Cement | 280–320 m²/kg | ~10–14% | Controlled heat of hydration |
What Goes Wrong At Each End Of The Distribution
Fineness problems rarely show up as a single obvious failure. They show up as one of two opposite drift patterns, and each one carries its own cost — one erodes strength and quality, the other erodes energy efficiency and margin. Recognizing which direction a mill has drifted is the first diagnostic step in any fineness investigation.
Why Fineness Control Is Really An Energy Conversation
It is tempting to treat fineness as purely a quality department concern and grinding energy as purely an operations concern, but the two are the same problem viewed from different sides of the plant. Narrowing the particle size distribution — producing fewer coarse particles without swinging too far into over-fine territory — is simultaneously the path to better strength consistency and lower specific energy consumption. A separator running an efficient, sharp cut point sends less material back through the mill for a second unnecessary pass, which improves PSD narrowness and reduces kWh per ton at the same time. This is why the most effective fineness control programs are not run purely out of the quality lab — they pull in mill feed rate, separator cut point, and specific energy data alongside the Blaine and residue results, because a fineness deviation is very often the earliest visible symptom of a grinding efficiency problem that has not yet shown up anywhere else.
What An Off-Spec Batch Or Grade Changeover Actually Costs
Every grade changeover carries a transition period where the product moving through the mill is neither fully the old grade nor fully the new one, and every minute spent in that gray zone before confirmed fineness testing catches up is material that risks being downgraded or reblended. Plants relying on manual lab sampling every hour or two run that transition blind for the gap between samples, while continuous fineness tracking shrinks that blind window down to nearly nothing. The financial impact compounds with grade-switching frequency — a plant running four to six grade changeovers a week accumulates a meaningful volume of downgraded or reblended material annually purely from delayed fineness confirmation, on top of the energy already spent grinding it once. Beyond the direct material cost, there is a scheduling cost too: every changeover that runs longer than necessary because the lab has not yet confirmed the new grade is in spec pushes back the next production window, compounding the impact across an entire production week.
Building A Fineness Control Program That Holds
Frequently Asked Questions About Cement Fineness Control
Keep Every Batch Inside Spec Without Grinding A Wasted Kilowatt-Hour
iFactory brings Blaine, sieve residue, and PSD trends together in one continuous view, ties them to separator setpoints and grade changeovers, and flags a drifting distribution before it ever reaches the silo — protecting both product quality and grinding energy at the same time.