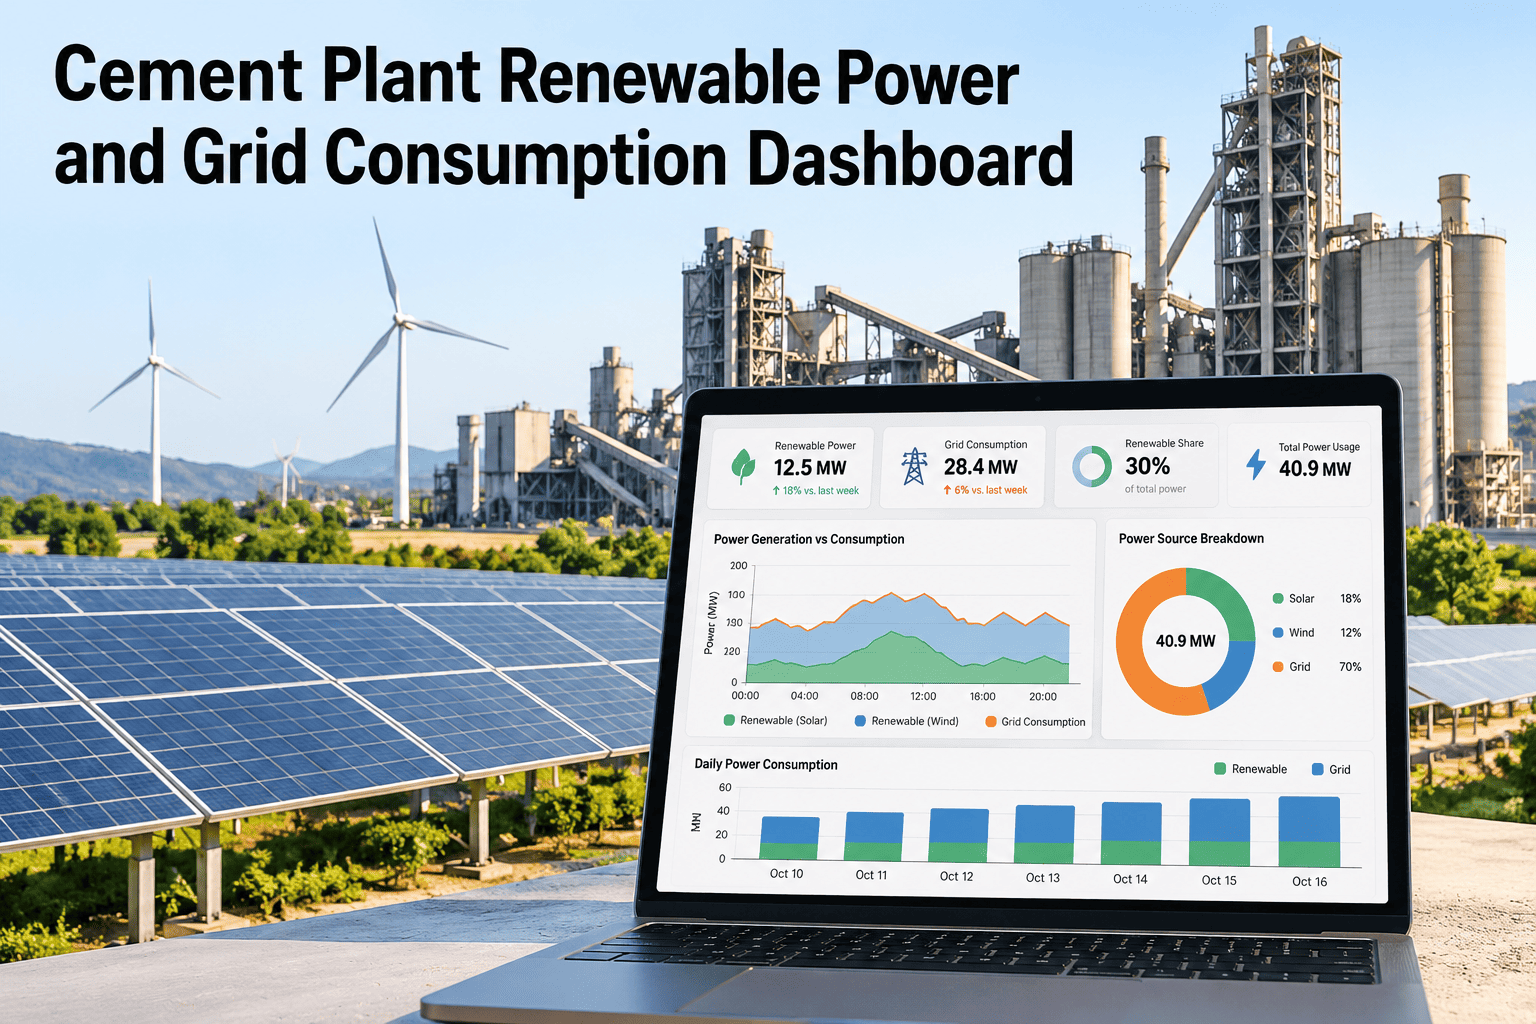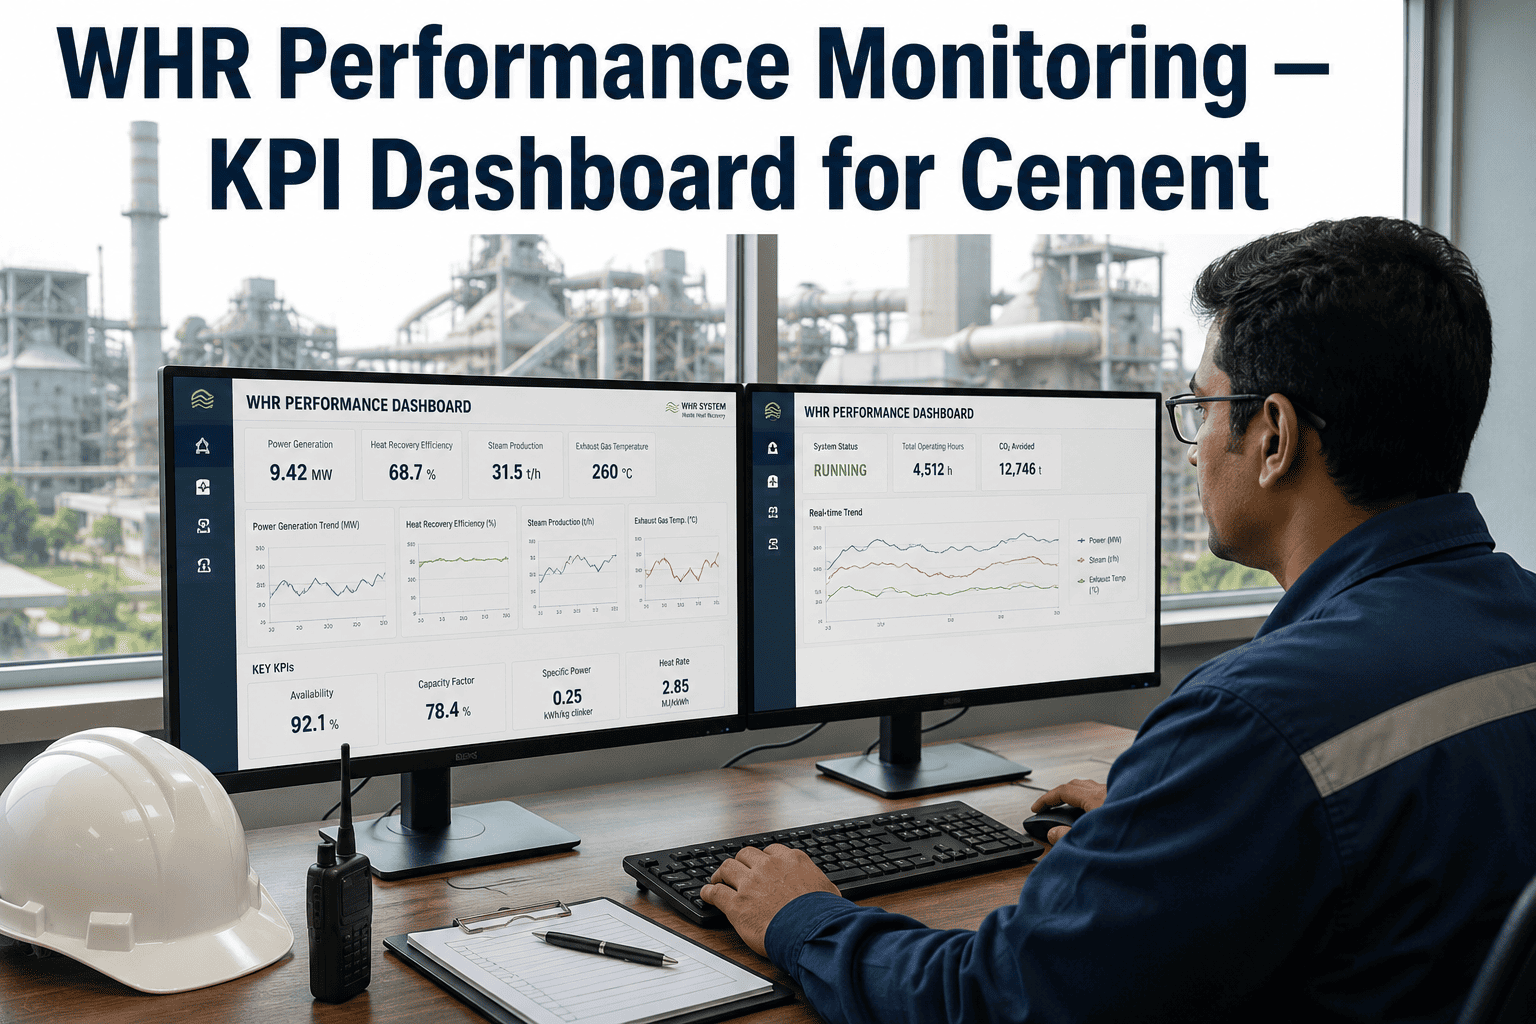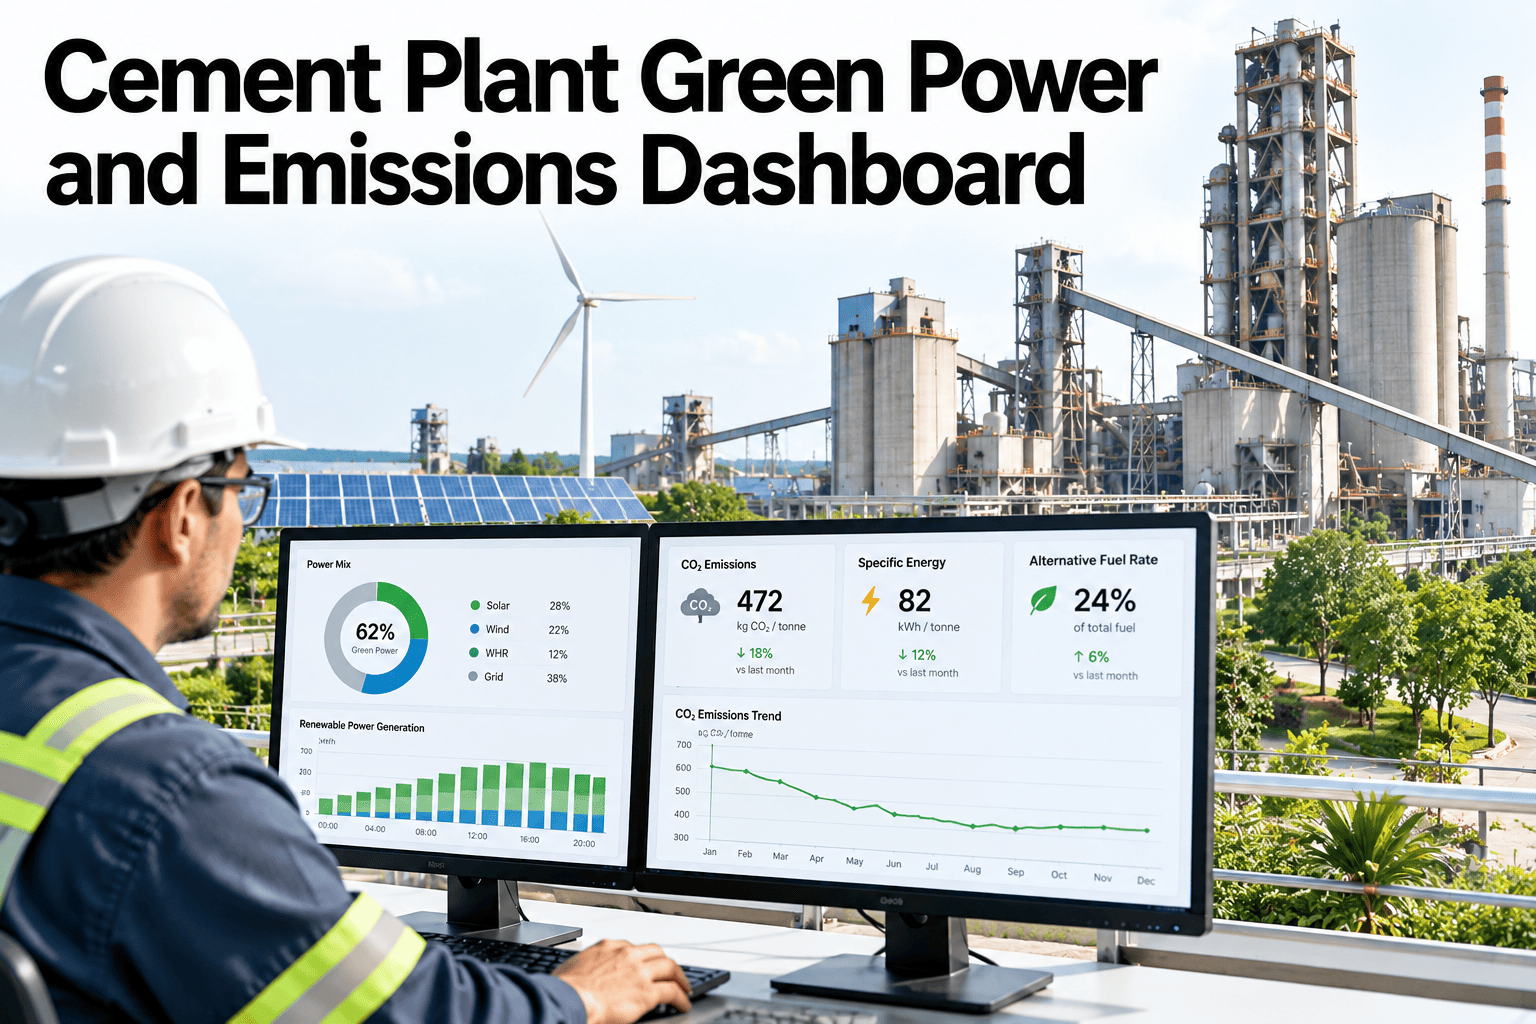
A plant blending renewable power purchases with grid electricity needs its emissions dashboard to reflect that blend accurately, not treat all purchased power as one undifferentiated line item. Renewable power inputs carry a different carbon factor than grid electricity, and getting the split wrong, whether by overstating renewable share or applying the wrong grid factor to the remainder, produces an emissions figure that understates or overstates the plant's actual position. A dashboard built around this distinction, with a clear production denominator and documented carbon factor assumptions behind it, gives the plant a defensible number rather than an optimistic one. Energy and sustainability teams reviewing their current setup can see renewable and grid power split accurately on a live emissions dashboard before the next energy review.
Cement Plant Green Power and Emissions Dashboard
Renewable power and grid electricity split accurately, with a clear denominator and documented carbon factors behind each.
Why Blending Renewable and Grid Power Misleads
Treating all purchased electricity the same way produces a distorted emissions figure in either direction.
Claiming renewable benefit without verified sourcing data overstates the plant's actual position.
Applying a stale or generic grid factor to the non-renewable share skews the result.
Without the split visible over time, it is hard to see whether renewable share is actually growing.
Keeping renewable and grid power visible separately is what makes the dashboard a useful planning tool, not just a reporting output.
Renewable Power Inputs, Grid Electricity
Both sources need their own tracked, verifiable data behind the dashboard figure.
Renewable Power Inputs
PPA volumes, on-site generation or certificates, tracked with their supporting documentation.
Grid Electricity
Remaining purchased power, tracked against utility billing and the applicable grid factor.
See Your Own Power Mix Split Accurately
Book a 30-minute session and bring your power purchase records. iFactory AI will show the renewable and grid split on your own data.
Production Denominator and Carbon Factor Assumptions
These two components turn raw power data into a defensible per-tonne figure.
| Component | What It Does |
|---|---|
| Production denominator | Converts electricity emissions into a per-tonne figure |
| Carbon factor assumptions | Documented, version-controlled factors applied per power source |
Trend Analysis and Report Export
The dashboard should show direction over time, not just a single current snapshot.
Trend Analysis
Renewable share and total emissions intensity tracked over time to show real progress.
Report Export
The split, denominator and factors export together in a format suitable for review or audit.
iFactory AI connects power purchase, grid billing and production data into one accurate dashboard. Scope covers data integration and factor setup.
Expert Review
The plants that get the most scrutiny on their green power claims are the ones that cannot show verified sourcing documentation behind the renewable share they report. A dashboard that keeps the supporting PPA or certificate data linked to the figure avoids that exposure entirely.
Trend analysis is what turns this dashboard from a compliance artifact into something an energy team actually uses. Seeing renewable share move quarter to quarter against total emissions intensity is a much more useful planning signal than a single current-period number.
Frequently Asked Questions
What counts as verified renewable sourcing for this dashboard?
This typically includes power purchase agreement documentation, renewable energy certificates, or metered on-site generation records, kept linked to the reported volume rather than relying on a supplier's general sustainability claim. Discuss what documentation you currently have in a working session.
How is the grid factor determined for the non-renewable share?
The grid factor is typically sourced from the relevant regional or national grid emissions data, updated as that published figure changes, rather than a fixed value applied indefinitely. Ask support about your applicable grid factor source.
Can this dashboard support a renewable energy target tracking program?
Yes, the trend view is commonly used to track progress against an internal renewable sourcing target, showing whether the plant is on pace against a stated goal. Request a target tracking example.
Does this integrate with our utility billing system?
Yes, grid electricity volumes are pulled from existing utility billing data rather than requiring manual re-entry each period. Contact support about your specific utility billing setup.
How long before the dashboard is validated against our own billing history?
Most plants have the dashboard validated against at least one past billing cycle within six to nine weeks, confirming the split and factors reconcile against known figures. Book a session to estimate your own timeline.
Report Green Power Progress You Can Actually Defend
iFactory AI splits renewable and grid power accurately, with documented factors behind every figure. See it on your own plant.