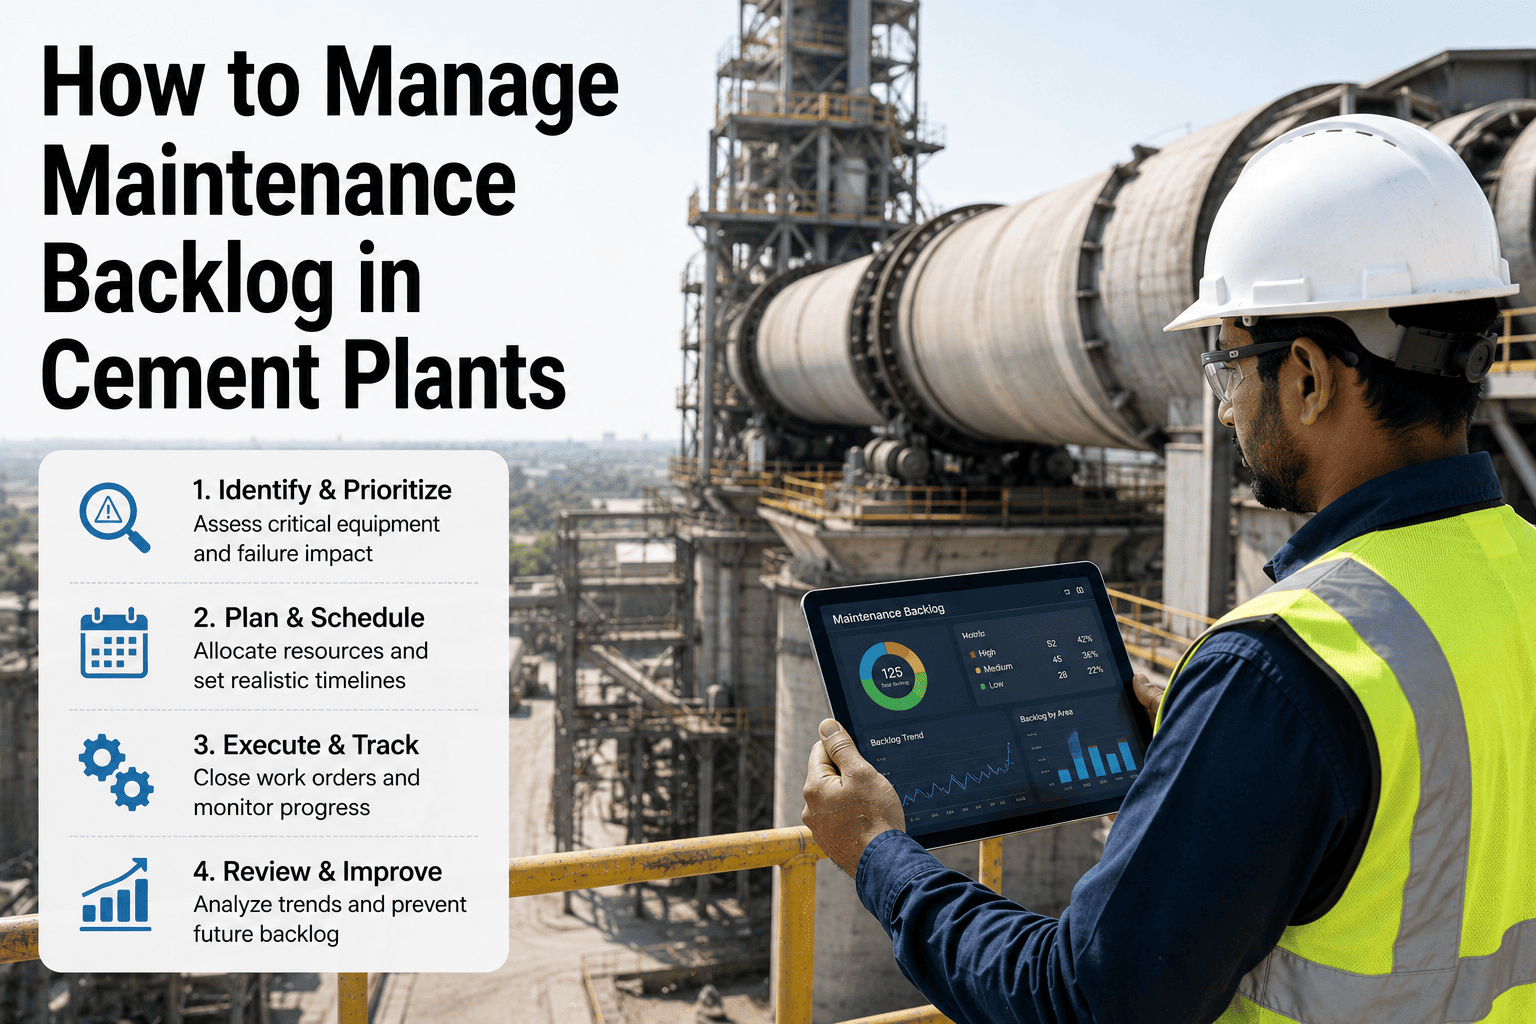
A maintenance backlog in a cement plant is not just a list of deferred work orders. It is a ledger of unmanaged risk that grows silently while production targets are met shift after shift. Kilns keep rotating, mills keep grinding, and the backlog keeps accumulating because the cost of stopping production always seems higher in the moment than the cost of waiting another week. The problem is that waiting compounds. A bearing that could have been replaced during a planned four-hour window eventually fails during peak demand, triggering an emergency shutdown that lasts three days and costs more than every deferred work order combined. iFactory's work order management platform helps cement plants break this cycle by replacing gut-feel prioritization with structured, risk-based backlog optimization.
Your backlog is a risk register, not a to-do list
Cement plants carrying 300 or more open work orders are not suffering from a labor shortage. They are suffering from a prioritization failure. Risk-based scoring, AI-driven recommendations, and automated scheduling convert an unmanageable backlog into a sequenced execution plan that protects production, safety, and equipment life.
What a cement plant maintenance backlog actually contains
Walk into any cement plant maintenance office and you will find a CMMS dashboard showing a backlog number that nobody fully trusts. The figure on the screen says 420 open work orders, but the maintenance manager knows that maybe 80 of those are duplicates, 50 are already completed but never closed, 30 are for equipment that was decommissioned two years ago, and another 40 are recurring low-priority items that have been rescheduled so many times they have become background noise. The real backlog, the set of work orders that represents actual deferred maintenance on active equipment, is probably closer to 220. But nobody has the time to clean the list, so the planner works around it, and the number keeps growing every week.
What makes a cement plant backlog fundamentally different from a discrete manufacturing backlog is the equipment profile. A cement plant runs on a small number of extremely large, extremely capital-intensive assets that operate continuously for months at a time. A rotary kiln, a raw mill, a cement mill, a clinker cooler, a preheater tower, these are not machines you can swap out or bypass. When one of them fails, the entire plant stops. This means the backlog is not a flat list of equal-weight items. It is a deeply skewed distribution where a tiny handful of work orders, maybe 15 to 20 out of hundreds, represent the vast majority of downstream risk. The challenge is finding those 20 items when they are buried in a list of 420.
| Equipment | Annual Failure Rate | Avg Downtime | Daily Revenue at Risk | Risk Tier |
|---|---|---|---|---|
| Rotary Kiln | 2-4 events | 3-7 days | $150K-$300K | Critical |
| Preheater Tower | 1-3 events | 2-5 days | $150K-$300K | Critical |
| Raw Mill (VRM/Ball) | 4-8 events | 1-3 days | $80K-$150K | High |
| Cement Mill (Finish) | 4-8 events | 1-3 days | $75K-$150K | High |
| Crusher (Hammer/Impact) | 6-12 events | 0.5-2 days | $60K-$100K | High |
| Baghouse / ESP | 3-6 events | 1-2 days | $50K-$100K | High |
| Clinker Cooler | 3-5 events | 1-3 days | $80K-$150K | High |
| Conveyor System | 8-15 events | 0.5-1 day | $25K-$50K | Medium |
| Packing and Shipping | 2-4 events | 0.5-1 day | $15K-$30K | Low-Medium |
The table above illustrates why a flat backlog list is dangerous. A work order to replace a conveyor belt roller and a work order to inspect kiln refractory thickness sit side by side in the CMMS queue with equal priority unless someone manually overrides the sort order. Most plants rely on a maintenance planner to perform this triage every morning, which works when the backlog is 80 items and falls apart completely when it crosses 300. The planner becomes a bottleneck, the queue becomes stale, and high-risk items drift deeper into the list every day that passes without resolution.
FIFO and squeaky-wheel methods are designed to fail in cement
The most common prioritization method in cement plants is FIFO, first-in, first-out. Work orders are addressed in the order they were created, which feels fair and traceable but has no relationship to actual risk. A work order generated six months ago to repaint a handrail on the packing plant conveyor will sit ahead of a work order generated yesterday to inspect a kiln roller bearing that is showing a vibration trend. The planner knows this is wrong and will manually bump the bearing inspection up, but that manual override only happens when the planner happens to notice the new work order, which is less reliable than anyone wants to admit.
The second most common method is the squeaky-wheel approach, where whatever the production manager complained about most recently gets moved to the top. This is marginally better than FIFO because it at least captures some signal about current production pressure, but it is purely reactive and entirely dependent on who complains loudest. A noisy compressor on the raw mill side gets fixed while a silent but deteriorating gear drive on the cement mill gets ignored because nobody has noticed it yet. Neither FIFO nor squeaky-wheel accounts for failure probability, consequence severity, or the compounding effect of deferral on equipment condition.
| Dimension | FIFO / Manual Approach | Risk-Based Scoring |
|---|---|---|
| Sort order | Chronological by creation date | Ranked by composite risk score |
| High-risk items | Wait behind older low-risk orders | Automatically surfaced to top of queue |
| Low-risk items | Mixed in with everything else | Batched for planned downtime windows |
| Planner time | 1-2 hours daily manual triage | Minutes reviewing AI-ranked queue |
| Emergency work order rate | 15-25% of all completed orders | Declines to 5-10% within 90 days |
| Backlog trend | Net positive growth every month | Net reduction starting within 60 days |
Risk-based scoring eliminates both problems by assigning every work order a numerical value derived from multiple weighted factors. The score is recalculated every time new data enters the system, which means a work order that was low priority when it was created can automatically escalate if the equipment starts showing vibration anomalies, temperature drift, or increasing cycle times. The planner stops being a daily triage officer and becomes a capacity planner, deciding how many of the top-scored items the team can execute in the next week rather than arguing about what belongs at the top of the list.
Every work order gets a score, not a gut feeling
A practical risk scoring framework for a cement plant backlog needs to balance sophistication with usability. If the scoring model requires twelve data inputs per work order, planners will not use it. If it uses only one input, like equipment criticality, it will miss important nuance. The most effective models for cement plants use four to five weighted dimensions that can be populated from data the plant already collects or can begin collecting with minimal effort. The resulting composite score, typically on a 0-100 scale, gives every work order a single number that can be sorted, filtered, and compared across the entire backlog.
Equipment Criticality
Assesses whether the equipment is single-point failure for the entire plant, has a redundant backup path, or only affects a secondary process. A kiln drive scores maximum points while a redundant dust collector scores lower. This dimension is usually static and set once during an initial criticality assessment.
Failure Probability
Evaluates how likely the equipment is to fail if the work order is deferred. This is where condition monitoring data becomes valuable. A bearing with rising vibration trends scores higher than one with stable readings, even if both have the same criticality rating. AI models can update this score automatically as new sensor data arrives.
Production Impact
Measures the direct revenue consequence if the equipment fails during peak production. A kiln failure during the peak selling season is more costly than the same failure during a maintenance shutdown window. This dimension accounts for both the magnitude of production loss and the timing relative to demand cycles.
Safety and Compliance
Captures whether deferring the work order creates a safety hazard for operators or a compliance exposure with regulators. A worn chain on a bucket elevator carrying hot clinker is a safety risk regardless of production impact. This dimension ensures that items which might score lower on the other three dimensions still surface when personnel safety is at stake.
The weighting of these dimensions should reflect the specific priorities of the plant. A plant that has experienced a recent regulatory citation might increase the safety and compliance weight from 20 to 30 points. A plant running at full capacity with no shutdown window for eight weeks might increase the production impact weight. The framework is not rigid; it is a starting structure that gets calibrated to the plant's actual operating context during the first few weeks of use.
One deferred work order can trigger a chain reaction
The most dangerous aspect of an unmanaged cement plant backlog is not any single work order. It is the compounding interaction between deferred items. A raw mill bearing inspection gets pushed by two weeks. During those two weeks, the bearing degrades from a condition that would have required a four-hour replacement to a condition that requires a full bearing housing overhaul. The overhaul takes 16 hours instead of four, which means the planned weekend maintenance window is no longer sufficient, so the repair gets rescheduled to the next monthly shutdown, which is three weeks away. During those three weeks, the deteriorating bearing causes increasing vibration that accelerates wear on the gearbox, the coupling, and the foundation mounting. What started as a $3,000 bearing replacement is now a $45,000 repair that also required an unplanned 36-hour shutdown.
Initial Deferral
Work order created for raw mill bearing inspection. Scored medium priority because vibration is within acceptable range. Deferred by two weeks due to production schedule pressure.
Condition Degradation
Bearing condition crosses warning threshold. Inspection would have caught this at the scheduled date. Now requires replacement rather than continued monitoring. Repair scope expands from inspection to full replacement.
Window Mismatch
Expanded repair scope no longer fits in the planned weekend window. Rescheduled to next monthly shutdown three weeks away. Equipment continues operating in degraded condition, causing secondary damage to gearbox and coupling.
Unplanned Shutdown
Equipment fails eleven days before the scheduled shutdown. Emergency repair triggered. Additional damage to gearbox and foundation discovered. Parts not in stock. Shutdown extends from planned 16 hours to actual 36 hours.
Cascading Production Loss
36-hour shutdown during peak season costs $180,000 in lost production. Total repair cost reaches $45,000 versus the original $3,000 bearing replacement. Two additional work orders created for the gearbox and foundation, adding to the backlog that caused the problem.
This cascade is not hypothetical. It is a pattern that repeats across cement plants worldwide, varying only in the specific equipment involved and the dollar amounts at each step. The root cause in every case is the same: a work order was deferred based on production pressure without any structured assessment of what deferral would actually cost if the condition worsened. Risk-based scoring prevents this by making the cost of deferral visible at the moment the prioritization decision is made, not after the failure has already occurred.
Most cement plants discover that 40 to 60 percent of their backlog consists of low-risk items that have been sitting alongside high-risk ones for months, creating the illusion that the entire backlog is equally urgent. Book a demo and we will run a free backlog risk assessment on your current work order data to show you exactly where the hidden risk is concentrated.
How machine learning changes the prioritization equation
A static risk scoring framework is a massive improvement over FIFO, but it has a limitation: the scores only change when someone manually updates the inputs. If a vibration sensor on the cement mill starts showing an upward trend on Tuesday, the work order score does not reflect that change until someone notices the trend and manually adjusts the failure probability input. In a plant with hundreds of sensors and dozens of work orders, that manual update cycle is too slow to be useful for the items that matter most.
AI-driven backlog optimization closes this gap by continuously ingesting condition monitoring data, production schedules, and work order history to recalculate risk scores in near real-time. The model learns from the plant's own failure patterns, which means it gets better at predicting which deferred items are most likely to cause problems. A cement mill that has historically shown a pattern of bearing failures six to eight weeks after vibration enters the warning zone will have its related work orders automatically escalated when that pattern starts to recur, even if the planner has not yet reviewed the sensor data.
Data Ingestion
CMMS history, sensor readings, and production schedules flow into the model continuously.
Pattern Recognition
Machine learning identifies failure precursors specific to each piece of equipment in the plant.
Risk Scoring
Every open work order receives an updated composite risk score based on the latest available data.
Queue Ranking
The full backlog is re-ranked so planners always see the current highest-risk items at the top.
Schedule Output
Top-ranked items are matched to available maintenance windows and crew capacity automatically.
The practical impact of this continuous scoring is that the planner's morning review changes from a manual triage exercise to a validation exercise. Instead of spending an hour sorting through 50 new and updated work orders to figure out what changed overnight, the planner opens a pre-ranked queue and spends fifteen minutes confirming that the top items make sense given what they know about current production priorities and crew availability. The AI handles the data processing; the planner handles the judgment calls that require human context, like knowing that the kiln operator is on vacation next week and certain work should be timed around that.
AI also solves a problem that static scoring cannot: it identifies work orders that should be deprioritized. A static model might score a work order at 65 when it is created, and it stays at 65 forever unless someone changes it. An AI model can lower that score to 35 if subsequent data shows the equipment condition has stabilized, freeing up capacity for items that have genuinely escalated. This bidirectional scoring, both up and down, is what allows a backlog to actually shrink rather than just being reorganized.
From overloaded backlog to sequenced execution in eight weeks
One of the reasons cement plants tolerate bloated backlogs for years is that the problem feels too large to solve without a major project that requires capital approval, consultant engagement, and six months of timeline. Risk-based backlog optimization does not require any of that. It requires a structured eight-week process that starts with the data the plant already has and builds toward automated scoring without disrupting current maintenance operations. The parallel-run approach means the existing workflow continues uninterrupted while the new system is calibrated and validated against real outcomes.
Backlog audit and data cleanup
Every open work order is reviewed for accuracy. Duplicates are merged, completed orders are closed, decommissioned equipment references are removed, and the remaining valid backlog is categorized by equipment type and current status. This step alone typically reduces the reported backlog by 20 to 30 percent without any maintenance work being performed.
Criticality assessment and scoring model build
Equipment criticality ratings are assigned based on a structured assessment that the maintenance and operations teams complete together. The risk scoring dimensions and weights are calibrated to the plant's specific context, and the initial scoring model is built using historical work order and failure data.
Parallel run and model validation
The AI-ranked queue runs alongside the existing manual prioritization process. Planners compare the AI rankings to their own judgment, discrepancies are reviewed, and the model is adjusted. This parallel period builds trust in the system and catches any scoring logic that does not fit the plant's reality.
Go-live and continuous optimization
The AI-ranked queue becomes the primary prioritization tool. Planner triage time drops immediately. The model continues to learn from new data, and the next phase of integration, connecting condition monitoring sensors for real-time score updates, begins.
The eight-week timeline is realistic because it does not depend on installing new sensors, replacing the CMMS, or retraining the maintenance team on a new workflow. It depends on applying a better sorting logic to work orders that already exist in the system. The data cleanup in weeks one and two is the most labor-intensive step, but even that is a one-time effort that pays for itself within the first month of improved prioritization.
What cement plants report after optimizing their backlog
The metrics that matter most in cement plant maintenance are not theoretical. They are the numbers that show up on the plant manager's monthly report and the numbers that determine whether the maintenance team is seen as a cost center or a value driver. Backlog optimization, when implemented with risk-based scoring and AI-driven ranking, produces measurable improvements across every one of these metrics within the first 90 days, with compounding benefits in the months that follow as the model accumulates more training data.
Beyond these direct metrics, plants also report indirect benefits that are harder to quantify but equally real. Maintenance planners who spent their days buried in queue triage start contributing to reliability engineering projects. Operators notice that the equipment issues they report get addressed in a more predictable sequence, which builds trust in the maintenance process and improves the quality of the inspection data they submit. Production schedulers gain confidence in maintenance windows because the work scheduled for those windows is genuinely the highest-priority work, not just the oldest work.
The financial impact varies by plant size and backlog severity, but the pattern is consistent. A mid-size cement plant with a 400-order backlog that implements risk-based scoring typically recovers $200,000 to $500,000 annually through reduced emergency repairs, shorter unplanned shutdowns, and more efficient use of maintenance labor. For a large integrated cement plant with multiple production lines, the recovery figure is often in the millions.
Cement backlog optimization, explained plainly
Stop managing your backlog. Start executing it.
iFactory helps cement plants convert raw backlog data into a risk-ranked execution plan that reduces emergency work orders, shortens unplanned shutdowns, and frees planner capacity for reliability improvement.