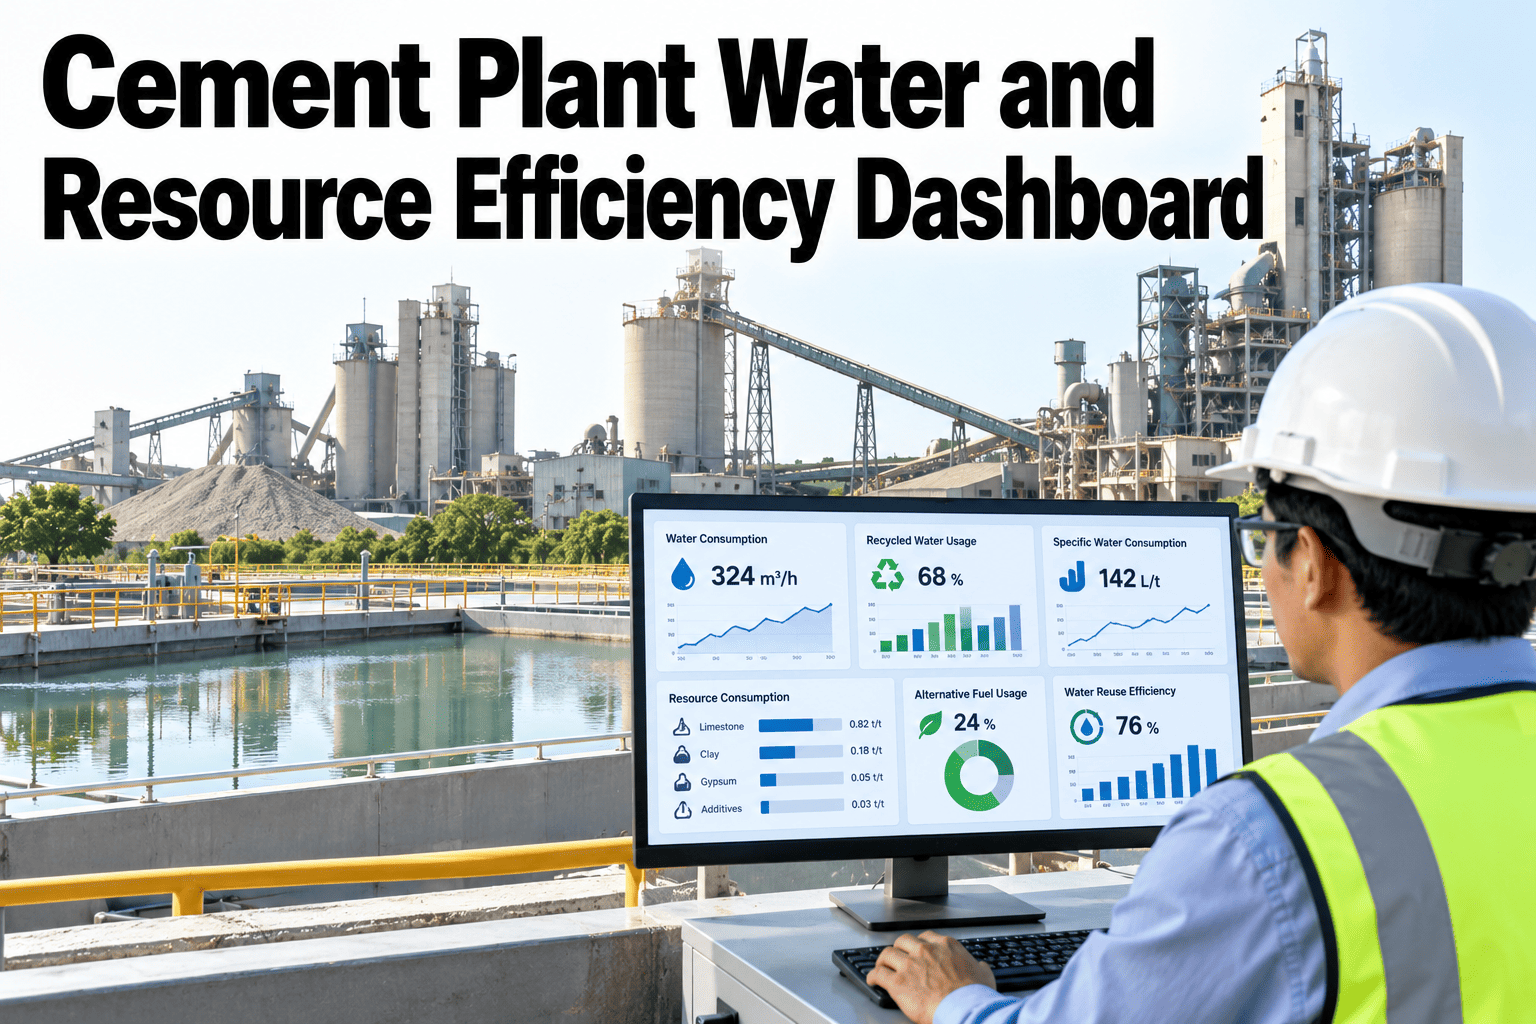
Water use at a cement plant rarely gets the same attention as energy, even though it's tracked in meters across raw milling, kiln cooling, finish milling and dust suppression, and the readings alone don't say much without context. A raw water meter total means little until it's normalized against production volume and allocated across process areas, because a spike that looks concerning in absolute terms might be entirely explained by a production increase. Building a dashboard around meter inputs, normalization and process-area allocation turns a pile of readings into something a plant team can actually use to find efficiency opportunities. Plant teams can review their own water data against this structure in a short session.
Water Use Means Nothing Without Production Context
iFactory normalizes water meter data against production and allocates it by process area, turning readings into an efficiency view.
Water Meter Inputs
Most plants already have water meters at intake and at key process points. The integration work is bringing those readings into one consistent timeline rather than reading each meter separately on its own schedule.
| Input | What It Measures | Why It Matters |
|---|---|---|
| Intake meters | Total water drawn into the plant | The baseline figure for any efficiency comparison |
| Process-area sub-meters | Water use by raw mill, kiln cooling, finish mill and other areas | Shows where water is actually being consumed |
| Recycled or reused water | Water reused within the process rather than freshly drawn | A key lever for reducing net water consumption |
Production Normalization
Water use per tonne of production is the figure that actually supports comparison, whether month to month or against an efficiency target, because it removes the effect of production volume changes.
Per-Tonne Normalization
Water use is divided against clinker or cement output, producing a figure comparable across periods of different production volume.
Process-Area Allocation
Sub-meter readings are allocated to specific process areas, showing which part of the plant is driving overall water use.
Exception Flagging
A reading that deviates significantly from its expected pattern, given production, is flagged for review rather than buried in a routine report.
See Your Own Water Use Normalized and Allocated
Book a 30-minute session and iFactory will build a sample normalized water efficiency view from your own meter data.
Exceptions and Trend Review
A good dashboard surfaces the exception worth investigating and supports a routine trend review, rather than requiring someone to scan raw numbers looking for a problem.
Data Limitations
A water efficiency dashboard is only as good as its underlying meter coverage. Being clear about what isn't metered, rather than implying precision the data doesn't support, keeps the dashboard trustworthy.
Where iFactory Fits
iFactory connects water meter data, normalizes it against production, and allocates it across process areas into one efficiency dashboard.
Unified Meter Integration
Intake and sub-meter readings are brought into one consistent timeline from your existing metering infrastructure.
Production-Normalized Reporting
Water use per tonne is calculated automatically, giving a comparable figure across periods.
Process-Area Allocation
Water use is broken down by process area, showing where consumption is actually occurring.
Exception and Trend Dashboards
Deviations from expected patterns are flagged automatically, alongside routine trend views for ongoing review.
Reviewed by iFactory's Cement Solutions team for alignment with general water and resource efficiency reporting practice. Specific feature capabilities should be validated against current product functionality and your own plant's metering coverage before being relied upon for efficiency targets.
Frequently Asked Questions
What if we don't have sub-meters on every process area?
The dashboard can still work with what metering exists, with unmetered areas estimated or grouped, and sub-metering gaps identified as a future improvement opportunity rather than blocking the initial rollout. Support can assess your current metering coverage.
How is production normalization calculated?
Water use is typically divided by clinker or cement output for the same period, producing a per-tonne figure, though the specific normalization basis can be configured to match how your plant already tracks production.
Can this support a water reduction target or sustainability goal?
Yes, a normalized, process-area-allocated baseline is exactly the kind of data needed to set and track progress against a water reduction target. Discuss your plant data and use case to see how this supports your specific goals.
How does recycled water factor into the efficiency calculation?
Recycled or reused water is tracked separately from fresh intake, so the dashboard can show both total consumption and the share being met through reuse, supporting a clearer efficiency picture.
Does this integrate with our existing sustainability reporting?
Water efficiency data can feed into broader sustainability or ESG reporting where that's already in place, rather than existing as a separate, disconnected report. Ask support how this connects to your current reporting.
Turn Water Meter Readings Into an Efficiency View
iFactory normalizes and allocates your water data by process area. Discuss your plant data and use case.