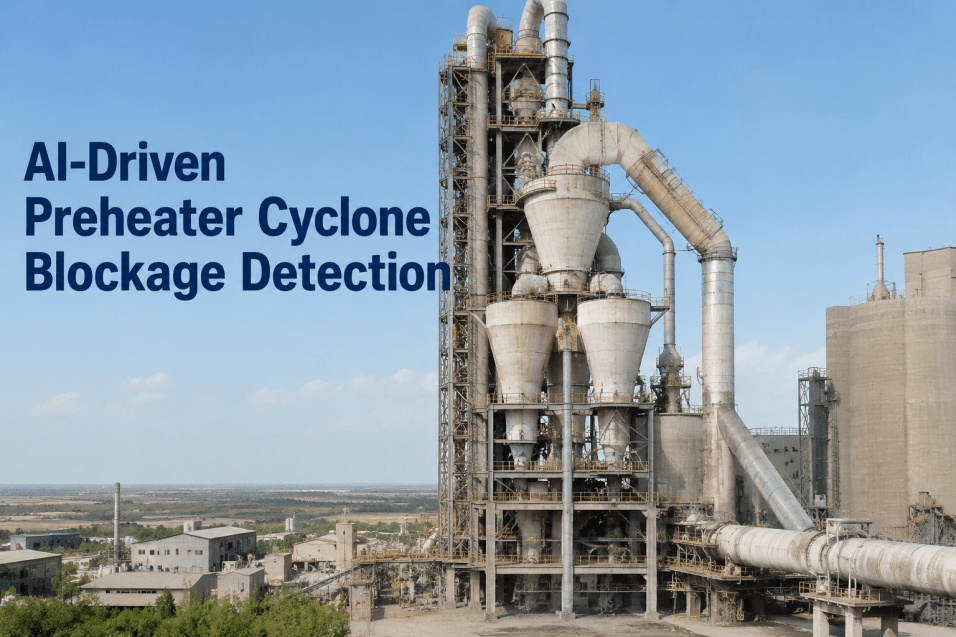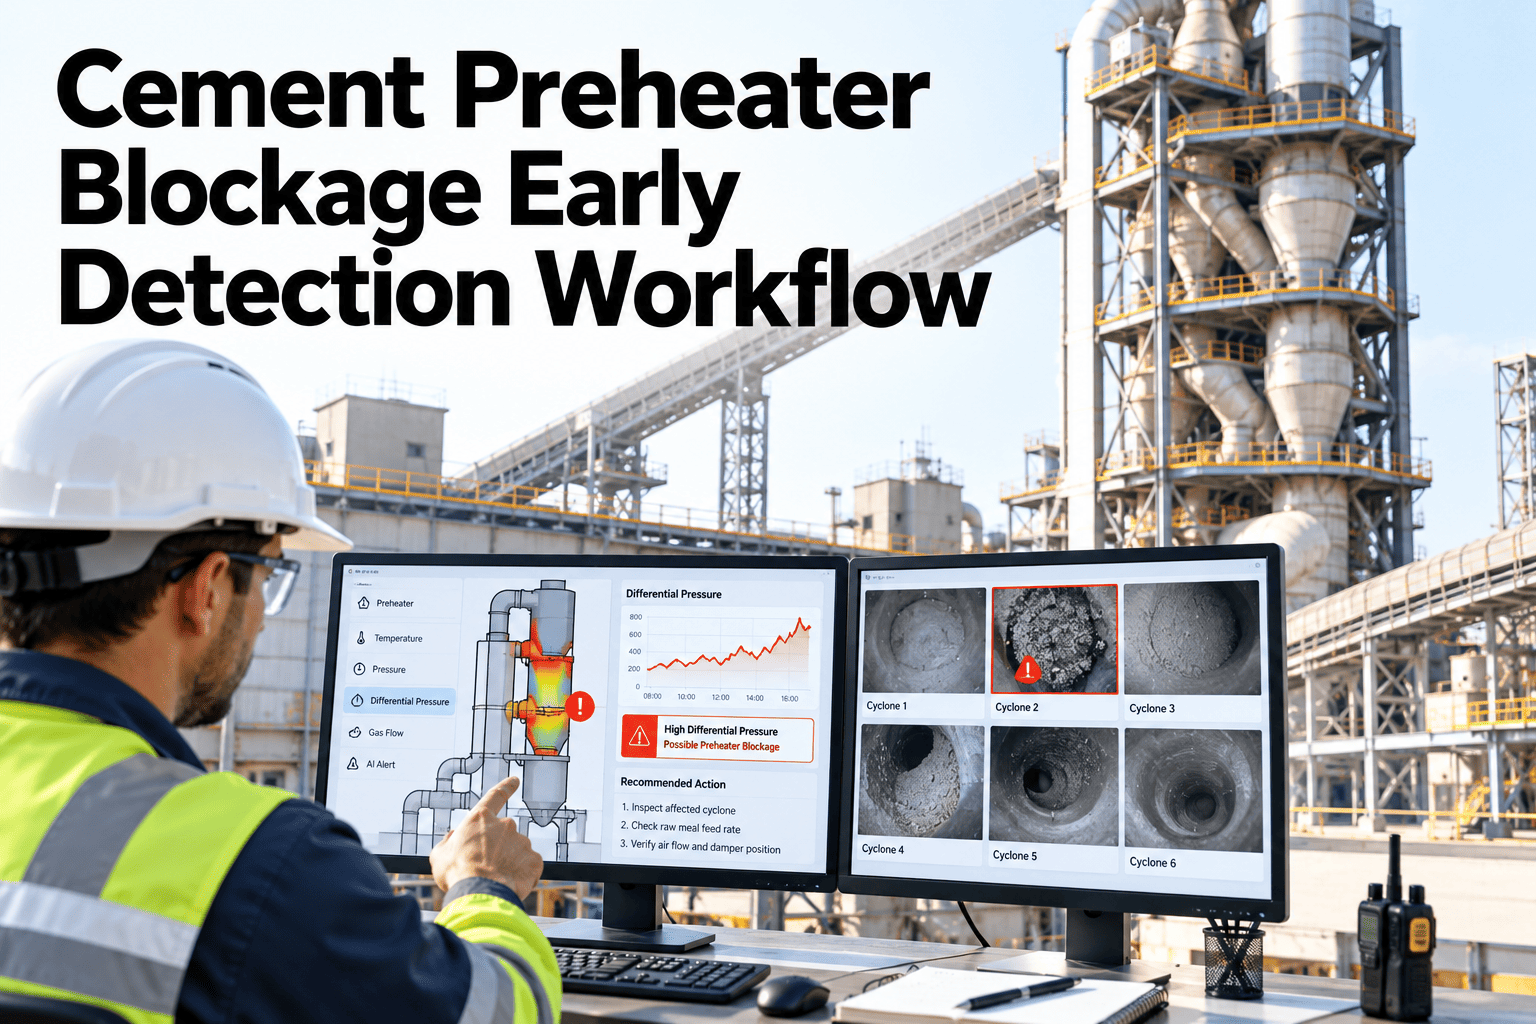
A preheater cyclone building a blockage does not announce itself with a single dramatic signal. It tends to show up first as a gradual differential pressure climb, a slight temperature shift one stage down, maybe a comment from an operator about something that looked slightly off during a walk-through, none of it individually alarming enough to stop the kiln. By the time the blockage forces an unplanned shutdown, the plant has usually had hours or even days of early indicators sitting in different places, never reviewed together. Reliability and process teams can discuss their own preheater data and use case with iFactory AI before the next buildup forces a stop.
The Warning Signs Were There. They Just Weren't Together.
iFactory AI connects differential pressure trends, temperature changes and operator observations so preheater risk is visible before it forces a shutdown.
Why Preheater Blockage Catches Plants by Surprise
The problem is rarely a lack of data. Most plants already have differential pressure, temperature trends and operator notes somewhere in their systems. The problem is that none of it gets reviewed together until the blockage has already become severe enough to force action.
A blockage develops over hours or days, not in a single dramatic jump.
Pressure, temperature and operator notes live in different systems or logs.
Each early indicator alone rarely looks severe enough to act on.
Action typically starts once the blockage is already forcing a rate reduction.
The Indicators Worth Watching Together
| Indicator | What a Shift Can Suggest |
|---|---|
| Cyclone differential pressure | A gradual rise often reflects material accumulation starting to restrict flow |
| Stage temperature profile | An unusual shift at one stage can point to where buildup is occurring |
| Feed rate vs draft response | A mismatch can suggest airflow is being restricted somewhere in the string |
| Operator walk-through notes | Visual or audible observations that sensors alone may not capture |
Review Your Own Preheater Indicators Together
Bring a recent blockage event to a 30-minute working session.
From Early Signal to Escalation
Differential pressure and temperature are tracked against their normal range.
A gradual, sustained shift is distinguished from normal process noise.
Operator observations and maintenance history are reviewed alongside the trend.
A planned intervention is scheduled before the blockage forces an unplanned one.
Why Pressure Alone Is Not Always Enough
Differential pressure is often the first variable teams watch, but pressure alone does not always rise cleanly or predictably as a blockage forms, which is part of why relying on a single indicator can delay recognition of a genuine pattern.
Adding temperature and draft response as corroborating signals gives a more reliable picture, since a pressure shift confirmed by a matching temperature change at the same stage is a stronger signal than either reading alone, and reduces the chance of either missing a real trend or reacting to normal noise.
A Scenario: The Blockage Nobody Connected in Time
Picture a Stage 4 cyclone where differential pressure has been climbing gradually over three shifts, each shift logging the number without flagging it as unusual since no single reading crossed an alarm threshold.
Meanwhile, an operator mentioned during a walk-through that something sounded slightly different near that cyclone, a note that went into a shift log but never got connected to the pressure trend building nearby. By the time the blockage forced a feed rate cut, the pattern had been visible in the data for the better part of three days, just never assembled into one view anyone was actively watching. Connecting the trend and the observation earlier would have turned a forced stop into a planned, lower-cost intervention.
Reactive Response vs Early Detection
What Changes for Maintenance Planning Once Detection Is Earlier
An earlier signal does more than avoid an unplanned stop in the moment, it changes the entire posture of how a maintenance team plans around the preheater. Interventions shift from being squeezed into whatever window a forced shutdown creates to being scheduled around production needs.
That shift also makes it easier to combine a planned cleaning with other scheduled work already on the calendar, rather than treating each blockage response as its own isolated, disruptive event competing for resources with everything else happening in the plant that week.
What Makes a Trend Worth Escalating
How Alternative Fuel Use Changes Blockage Risk
Alternative fuels can introduce ash and volatile characteristics different from traditional fuel sources, and those differences sometimes change the blockage risk profile for a given preheater string compared to what the plant historically experienced.
A detection approach built only on historical patterns from a traditional fuel mix may miss a new risk pattern introduced as alternative fuel rates increase, which is another reason the fuel data discussed elsewhere in a plant's monitoring program connects back to preheater reliability as well.
Why Early Intervention Costs Less Than It Seems
A planned cleaning or minor adjustment scheduled around a developing trend is a fraction of the cost of an unplanned shutdown, both in direct downtime and in the knock-on effects of starting the kiln back up afterward.
The hesitation to act on an early, subtle signal is understandable, since no single reading looks severe enough to justify disrupting production on its own. That hesitation is exactly why seeing the full pattern together matters, because the case for early action becomes much clearer once the indicators are assembled rather than reviewed one at a time.
Where Blockages Tend to Originate in the Preheater String
Not every cyclone stage carries equal blockage risk, and knowing where buildup is more likely to start helps a team prioritize which indicators to watch most closely rather than treating every stage identically.
Often more prone to buildup from sticky material at higher temperatures.
Changes in flow direction create natural spots for material to accumulate.
Narrower passages are more sensitive to even modest material buildup.
Risk shifts with raw meal chemistry and alternative fuel ash characteristics.
Building a Habit Around Routine Trend Review
A detection approach only works if someone is actually looking at the trends on a regular basis, not just when an alarm already demands attention. Building that review into a routine, rather than treating it as optional, is what makes early detection real rather than theoretical.
Where iFactory AI Fits
Tracks pressure and temperature
Watches differential pressure and stage temperature trends together.
Flags sustained patterns
Distinguishes a gradual, real trend from normal process noise.
Connects operator notes
Brings walk-through observations into the same review as the data.
Supports planned action
Gives the team time to schedule an intervention, not react to one.
Expert Review
A cement reliability engineering perspective, reviewed for accuracy before publication: preheater blockages are one of the clearer cases where the data to predict an event already exists at most plants, the gap is almost always in connecting scattered indicators rather than in sensor coverage itself. Teams that build a habit of reviewing pressure, temperature and operator notes together catch the pattern days earlier than teams waiting for an alarm to fire. Reviewing a past blockage against your own available data usually shows how early the pattern was actually visible. Confirm specific feature capabilities against your plant's systems before relying on any workflow.
Frequently Asked Questions
How early can a blockage realistically be detected?
It varies by cyclone and buildup rate, but many plants find the pressure trend begins shifting well before it reaches an alarm threshold, often giving a window of hours to a few days for a planned response. Discuss a realistic detection window for your preheater.
Does this require new sensors on the preheater?
Most plants already have the differential pressure and temperature sensors needed, the gap is typically in connecting that existing data rather than adding new instrumentation. Ask about working with your existing preheater sensors.
How are operator notes captured alongside sensor data?
Walk-through observations logged during a shift can be tied to the relevant time window and asset, so they sit alongside the trend data rather than in a separate paper or digital log. Explore how operator observations fit into your review.
What if the trend turns out to be a false alarm?
A cleared trend is still useful information, since reviewing why it did not develop into a blockage helps refine what a genuine early pattern looks like for that specific cyclone going forward. Talk through how cleared trends get reviewed over time.
Can this connect to maintenance scheduling directly?
Yes, an escalated trend can feed into a planned work order, so the team has a documented basis for scheduling the intervention rather than acting on an informal observation alone. See how this connects to your maintenance workflow.
Catch the Pattern Before It Forces a Shutdown
iFactory AI connects your pressure, temperature and operator data so preheater risk is visible early. Discuss your own plant data and use case.