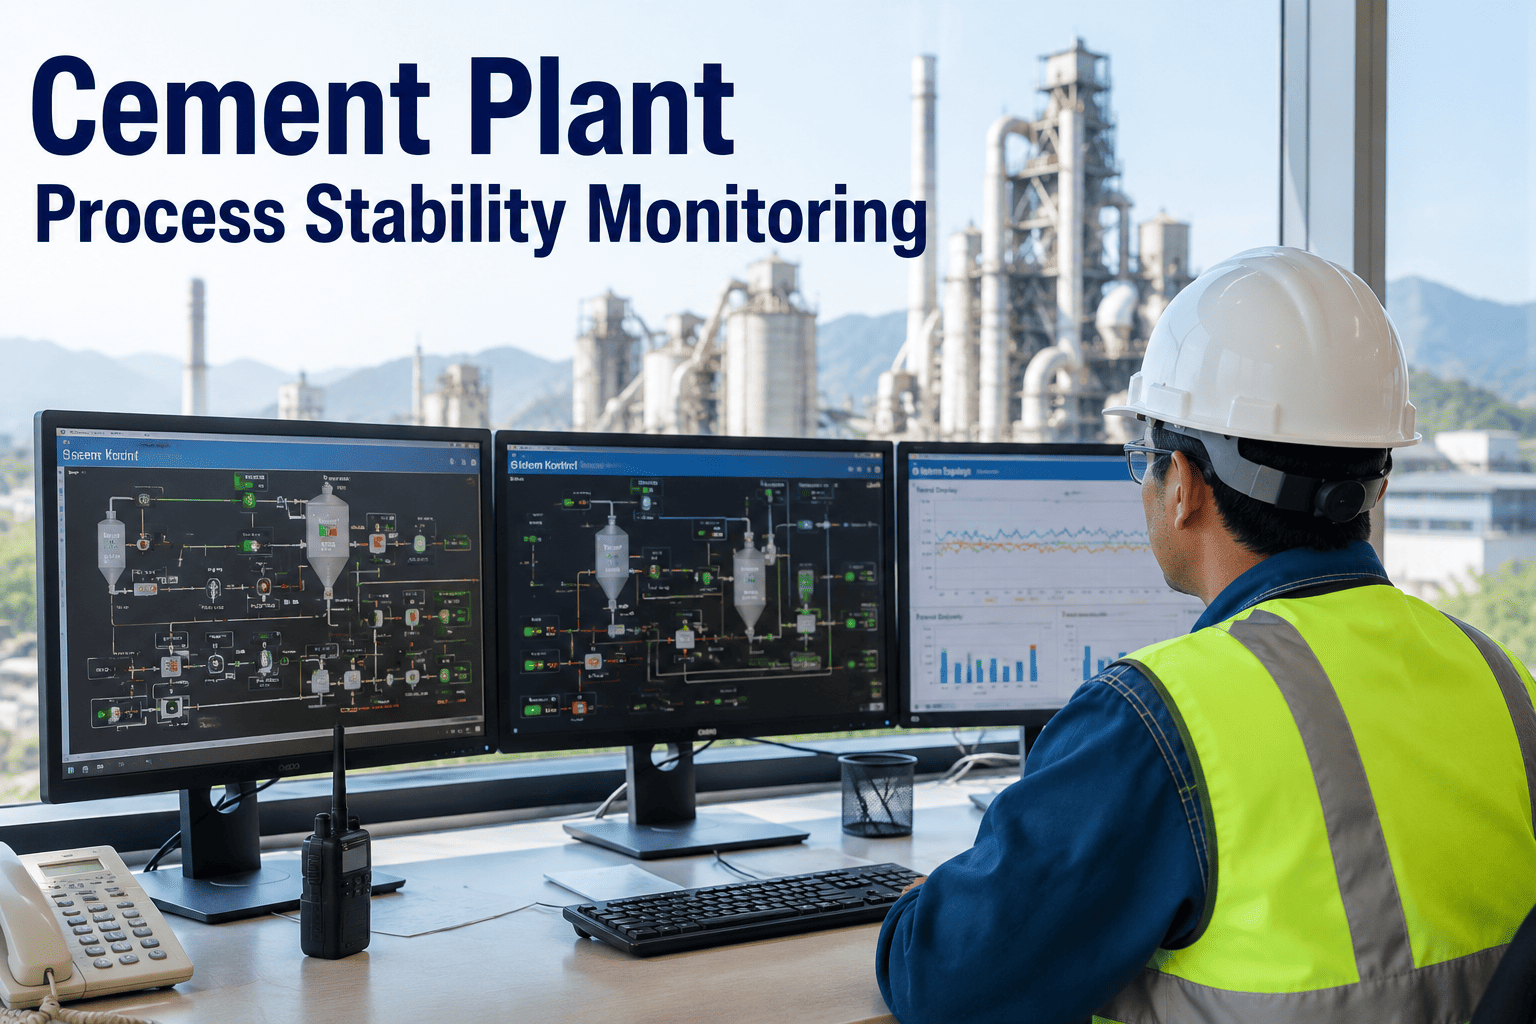
A cement kiln that runs steadily for 72 hours and then destabilizes for six hours is not operating at 92 percent stability. It is operating at a level that quietly wastes fuel, produces off-spec clinker, and accelerates refractory wear in ways that only show up weeks or months later when the full cost is tallied. Process stability in a cement plant is not a binary state where the kiln is either running well or not. It is a continuous spectrum where small, invisible deviations in temperature profiles, draft pressures, and material flow compound into the kind of upset that forces operators into manual intervention, emergency fuel adjustments, and sometimes a full kiln stop. The challenge is that these deviations begin long before any single parameter crosses an alarm threshold, which means traditional monitoring systems, designed to alert on individual parameter violations, are structurally incapable of catching the instability early enough to prevent it. iFactory's AI process analytics platform monitors the multi-variable relationships that define stable operation, detecting the early patterns of drift that single-parameter alarms cannot see.
The instability starts long before the alarm fires
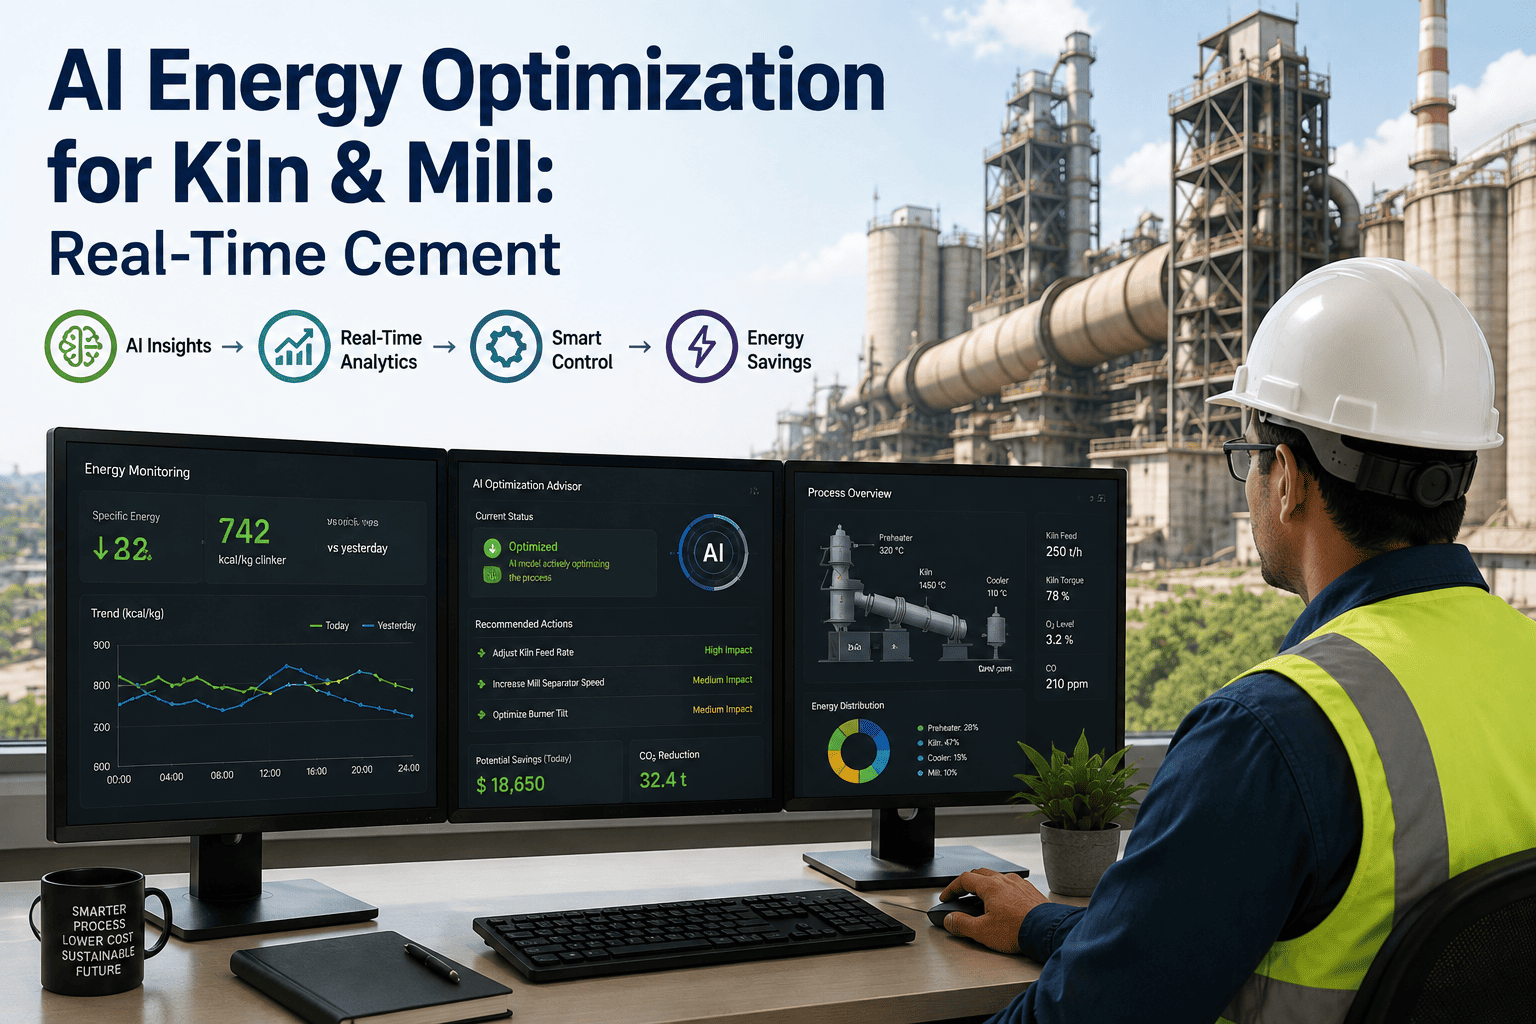
AI-driven process stability monitoring reads the relationships between kiln, mill, and quality parameters in real time, detecting multi-variable drift 15 to 60 minutes before traditional alarms, typically reducing process upsets by 20 to 35 percent and cutting specific heat consumption by 2 to 4 percent.
Why your control room is drowning in data but starving for insight
A modern cement plant control room monitors between 2,000 and 5,000 individual parameters across the kiln, preheater, cooler, raw mill, cement mill, and auxiliary systems. During stable operation, most of these parameters sit within their normal ranges and the operator's attention is focused on a handful of key indicators like kiln torque, burning zone temperature, and free lime results. But during an instability event, the behavior of these parameters changes dramatically. A single upset in the burning zone can cascade through the preheater, the cooler, the raw mill feed system, and the fuel delivery system within minutes, generating hundreds of parameter deviations simultaneously.
This cascade produces what control room operators call an alarm flood. A study of cement plant alarm logs typically reveals that 70 to 80 percent of all alarms occur during just 5 to 10 percent of operating time, the periods when the process is destabilizing. During these floods, operators receive more alarms per minute than they can possibly read, acknowledge, and act on. The result is a well-documented human response: operators start acknowledging alarms without reading them, prioritizing by familiarity rather than severity, and sometimes missing the one or two alarms that actually point to the root cause of the upset while they are busy responding to the dozens of downstream symptoms.
The deeper problem is that the alarm system is looking at each parameter in isolation. The kiln inlet temperature alarm has no awareness of what the oxygen sensor at the preheater outlet is doing, what the kiln torque trend looks like, or whether the cooler undergrate pressure has started to fluctuate. Each alarm is a single-variable verdict on a multi-variable situation, and by the time enough individual alarms have fired to paint a complete picture of what is happening, the process has already moved past the point where a gentle correction would have been sufficient. The operator is now in recovery mode, making large corrective moves that often overshoot and create oscillations that prolong the instability.
Stability is not the absence of alarms, it is the coherence of the process
Process engineers who have spent decades running cement kilns develop an intuitive sense of stability that has nothing to do with whether any alarms are active. They can look at a trend screen and feel that something is not right even though every parameter is within its configured limits. What they are sensing, usually without being able to articulate it precisely, is a loss of coherence in the relationships between parameters. The burning zone temperature might be within range, but it is fluctuating in a pattern that does not correlate normally with the fuel feed rate. The preheater draft might be within range, but its response to induced draft fan speed changes has become sluggish compared to its normal behavior. These relationship changes are the earliest detectable signals of approaching instability, and they are entirely invisible to a monitoring system that evaluates each parameter against a fixed setpoint.
AI process stability monitoring operationalizes this intuitive sense by learning the normal multi-variable relationships from historical operating data and then continuously comparing current parameter relationships against that learned baseline. The model does not care whether the kiln inlet temperature is 1050 degrees or 1080 degrees. It cares whether the relationship between kiln inlet temperature, oxygen level, kiln torque, and cooler secondary air temperature is consistent with the relationships it has learned from months of stable operation data. When those relationships start to deviate, even if every individual parameter is still within its alarm limits, the model flags a stability drift that gives the operator 15 to 60 minutes of advance warning before the drift becomes a full upset.
The stability envelope concept is important because it reframes what monitoring is supposed to do. Traditional monitoring asks "Is any single parameter outside its limits?" AI stability monitoring asks "Are the relationships between parameters consistent with stable operation?" These are fundamentally different questions that produce fundamentally different answers at exactly the moment when early detection matters most, the transition period between stable operation and an upset event where the cost of intervention is still low and the probability of success is still high.
Why human operators cannot monitor what AI can
The human brain can simultaneously track about four to seven variables in a meaningful way. A cement kiln during normal operation requires meaningful tracking of at least 15 to 20 interdependent variables to detect the early patterns of instability, and during transitional periods like raw material changes, fuel switches, or load adjustments, the number of relevant variables increases further. This is not a limitation of operator skill or experience. It is a structural mismatch between the cognitive bandwidth of a human being and the dimensional complexity of a continuous cement manufacturing process.
The multi-variable challenge becomes concrete when you look at the specific parameter relationships that define kiln stability. Consider the relationship between burning zone temperature, kiln torque, oxygen at the kiln inlet, and cooler secondary air temperature. During stable operation, these four parameters move together in a learned pattern. When the raw meal chemistry shifts slightly, causing the burning zone to become more or less thermally demanding, the response pattern of these four parameters changes in a predictable way that an experienced operator might subconsciously recognize. But when the shift is subtle, or when it coincides with a minor change in fuel quality, or when the operator is simultaneously dealing with a question from the lab about a clinker sample, that subconscious recognition does not happen, and the drift goes undetected.
The correlation grid above shows a simplified view of the interdependencies between six critical kiln parameters. Each cell represents the strength of the relationship between the parameter in that row and the parameter in that column. A monitoring system that watches each parameter individually sees six independent variables. The reality is a tightly coupled system where a disturbance in any one parameter propagates through multiple correlation paths simultaneously. AI process monitoring watches the entire grid in real time, detecting when the pattern of correlations across all these relationships starts to deviate from the learned stable baseline, even if no single parameter has crossed a threshold.
What 30 minutes of advance warning is actually worth
When an instability event reaches the point where traditional alarms fire, the operator typically has a window of zero to ten minutes to make the right correction before the event escalates to a level that requires load reduction or kiln stop. In that zero to ten minute window, the operator must correctly diagnose the root cause from a flood of alarms, select the right corrective action from multiple possible interventions, execute that action, and wait long enough to see whether it is working, all while the process is continuing to deteriorate. The success rate of interventions under these conditions is well below 50 percent in most cement plants, not because operators lack skill, but because the time and information available are insufficient for reliable decision-making.
AI stability monitoring that detects the drift 15 to 60 minutes before alarms fire completely changes this equation. In a 30-minute warning window, the operator has time to review the AI's assessment of which parameter relationships are deviating, consider the context, such as a recent raw material change or fuel switch that might explain the drift, and make a small, measured correction, such as a minor fuel rate adjustment or a subtle change in induced draft fan speed, that nudges the process back toward stable operation before it crosses any alarm threshold. The correction required in the drift zone is typically an order of magnitude smaller than the correction required in the alarm zone, which means less risk of overcorrection and oscillation.
The dollar value of that 30-minute advantage depends on the severity of the event that was prevented. For a minor upset that would have required 30 minutes of suboptimal operation, the savings are modest, perhaps $2,000 to $5,000 in avoided fuel waste and quality deviation. For a major upset that would have required a kiln slowdown lasting several hours, the savings can exceed $50,000. A mid-size cement plant that experiences two to four preventable major upsets per month and ten to twenty minor ones can realistically expect $200,000 to $600,000 in annual savings from the detection advantage alone, before accounting for the secondary benefits of reduced refractory wear and lower emissions that result from more stable operation.
There is also a human factor that does not show up in any cost calculation but is immediately visible to anyone who spends time in a cement plant control room. Operators who work with AI stability monitoring report significantly lower stress levels during shifts because they are no longer constantly waiting for the next alarm flood. When the process does start to drift, they receive a clear, contextualized assessment rather than a wall of unprioritized alarms, and they have time to respond thoughtfully rather than frantically. This reduction in cognitive load translates to better decisions across all aspects of their job, not just during instability events, and it is one of the most frequently cited reasons that operators become advocates for the technology after initial skepticism.
See how AI reads your kiln's stability signals
iFactory connects to your existing SCADA and historian data to build a multi-variable stability model for your kiln and mill, showing you the drift patterns that your current alarms cannot detect.
Mill stability and the quality feedback loop
While the kiln receives the most attention because it is the highest-value asset in the plant, process instability in the raw mill and cement mill creates its own cascade of costs that is often underestimated. A vertical roller mill that starts to oscillate due to changing raw material grindability will produce inconsistent fineness, which feeds variability into the kiln raw meal composition, which forces kiln operators to make more frequent corrections, which increases kiln instability. The mill problem and the kiln problem are connected through the material stream, but traditional monitoring treats them as separate systems with separate alarm sets, so the connection between the mill oscillation and the kiln instability is visible only in hindsight during a post-event review.
AI process monitoring that spans both the mill and the kiln can detect this type of cross-system propagation in real time. When the raw mill starts showing early signs of grindability-related oscillation, the system can flag that kiln stability may be impacted within the next one to two hours, giving kiln operators advance notice to prepare for potential feed variability. Similarly, when the cement mill starts producing off-spec fineness, the system can trace the root cause back through the separator efficiency trend, the feed rate variability, and the clinker quality coming from the kiln, presenting the operator with a diagnostic path rather than a single alarm that says "cement mill fineness out of range."
Raw Mill Stability
Monitoring differential pressure, vibration, feed rate consistency, and product fineness together to detect grindability changes, dam ring wear, and separator efficiency drift before they cause kiln feed variability. Early detection of raw mill oscillation prevents the downstream quality issues that force kiln corrections.
Kiln System Stability
Monitoring the full suite of kiln, preheater, and cooler parameters as an interconnected system to detect coating instabilities, ring formation precursors, and thermal profile shifts. The kiln model is the highest-value application because the cost of instability is greatest here.
Cement Mill Stability
Monitoring mill vibration, separator speed, product temperature, and blaine fineness together to detect grinding media wear, diaphragm condition changes, and feed clinker hardness variations. Stable cement mill operation directly impacts energy consumption per ton of finished cement.
Cross-System Correlation
Linking mill and kiln stability models to detect when variability in one system is propagating to another. This is where AI delivers value that no single-system monitor can provide, by tracing the root cause of instability across the entire production chain.
The quality feedback loop is particularly important for cement plants that produce multiple product types or that frequently adjust their clinker composition to accommodate different market requirements. Each product change or composition adjustment creates a transient period where the process relationships are different from the learned baseline, and traditional alarms set for the standard operating point may be either too sensitive or not sensitive enough during the transition. AI models that learn multiple operating regimes can switch between stability baselines as the operating context changes, maintaining detection sensitivity through transitions that would otherwise blind a single-baseline monitoring system.
From historian data to live stability monitoring in six weeks
Deploying AI process stability monitoring does not require new sensors, new control systems, or changes to the existing DCS configuration. The data required, process parameter trends at one-minute to five-minute intervals, already exists in the plant's historian system. The implementation process is primarily a data science and model training exercise that runs in parallel with normal operations, with no disruption to the control room workflow until the model is validated and the operators have been trained on how to interpret and respond to the stability alerts.
Data extraction and baseline learning
Six to twelve months of historian data is extracted for the target equipment, typically starting with the kiln system. The AI model ingests this data and learns the multi-variable relationship patterns that characterize stable operation, including normal variations for different operating regimes, product types, and seasonal conditions. The output of this phase is a trained baseline model specific to the plant.
Historical event validation
The trained model is run against historical data containing known instability events to verify that it would have detected the drift before the event occurred. This validation step quantifies the detection advantage in minutes for the specific plant and builds confidence in the model's accuracy before it is connected to live data.
Live data connection and shadow mode
The model is connected to the live historian data stream and runs in shadow mode, generating stability assessments in real time without displaying them to operators. The implementation team monitors the model's output alongside actual plant behavior to verify that the live assessments are accurate and to tune any sensitivity thresholds.
Operator training and go-live
Control room operators are trained on how to interpret stability alerts, what corrective actions to consider when drift is detected, and how to provide feedback to the model when an alert was useful or when it was a false positive. The stability dashboard goes live in the control room, initially as a secondary information source alongside the existing alarm system.
The six-week timeline reflects the reality that the data infrastructure in most cement plants is already sufficient to support AI process monitoring. The historian systems installed in cement plants over the past 15 to 20 years were designed to store exactly the kind of high-frequency time-series data that AI models need. The barrier has not been data availability but data utilization, the historian has been functioning as a storage device for post-event analysis rather than as a feed for real-time analytics. AI process monitoring unlocks the real-time value that was always latent in that data but was inaccessible to traditional monitoring tools that could only evaluate one parameter at a time.
What cement plants measure after deploying AI stability monitoring
The metrics that define success for AI process stability monitoring span three categories: process performance, energy efficiency, and equipment life. Process performance metrics measure the direct reduction in instability events and the resulting improvement in operating consistency. Energy efficiency metrics capture the fuel and power savings that result from operating closer to the optimal point more of the time. Equipment life metrics track the reduction in thermal and mechanical stress on refractory, grinding elements, and other consumables that degrade faster under unstable conditions. Together, these three categories provide a comprehensive view of the value that stability monitoring delivers.
The financial aggregation of these metrics varies by plant, but a conservative calculation for a mid-size cement plant producing 5,000 tons of clinker per day typically yields an annual benefit of $400,000 to $900,000. The largest single component is usually the specific heat consumption reduction, because fuel cost represents 30 to 40 percent of total cement production cost, and even a 2 to 3 percent improvement in thermal efficiency on a plant spending $30 million per year on fuel is a six-figure savings. The refractory life extension is the most underrated component because the savings are realized in avoided shutdown costs rather than reduced operating expenses, but a single avoided unplanned kiln shutdown for refractory repair can save $200,000 to $500,000 in lost production alone.
Process stability monitoring, explained plainly
Your historian already has the data. Let AI turn it into early warnings.
iFactory connects to your existing SCADA and historian infrastructure, builds plant-specific stability models, and delivers real-time drift detection that reduces upsets, saves fuel, and extends refractory life.