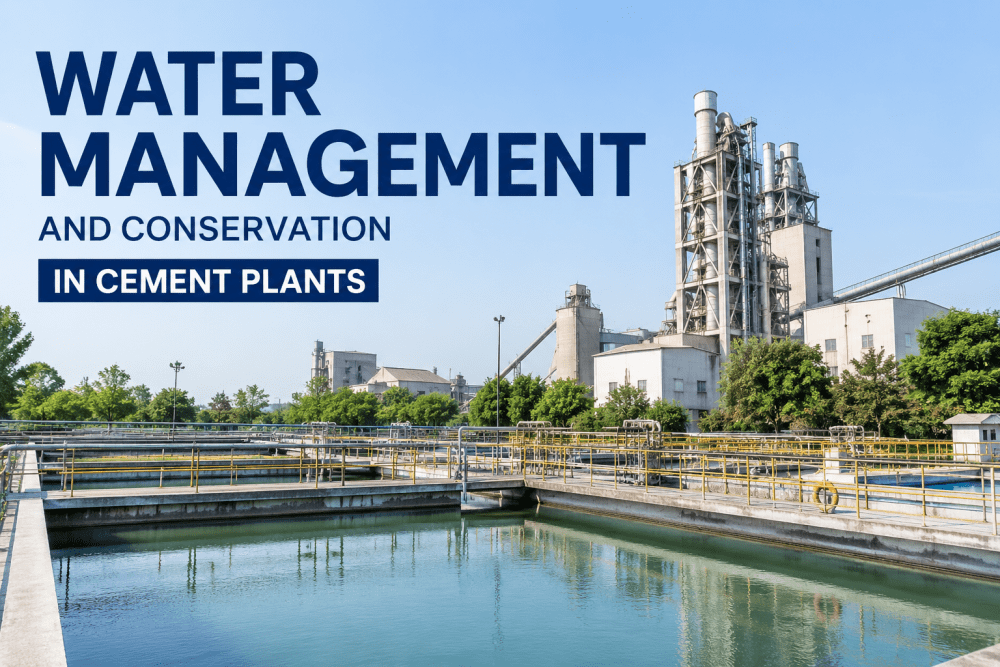
Water rarely gets the same scrutiny as fuel or electricity on a cement plant's utility bill, yet cooling towers, raw mill spray systems, dust suppression, and slag granulation together can pull through volumes large enough to matter both financially and for a plant's environmental reporting. A slow leak in an underground line or a cooling tower running past its optimal cycles of concentration can run for months without anyone noticing, because most plants still meter water at the site boundary rather than by process area. iFactory applies AI-powered analytics to submetered water data so leaks, inefficiencies, and consumption trends surface while they are still small, and our team can show you where your own plant's water use is heading before the next utility bill confirms it.
iFactory breaks down water use by process area, flags abnormal consumption patterns as they develop, and connects usage data directly to your sustainability and ESG reporting.
Where Water Actually Goes in a Cement Plant
Water consumption in cement manufacturing is spread across several distinct systems, each with a different consumption pattern and a different failure mode when something goes wrong. Understanding the typical breakdown is the first step toward knowing which submeters actually matter for your plant.
Note: Actual distribution varies by plant configuration, climate, and whether wet or dry process lines are in use — iFactory's initial assessment profiles your specific plant rather than assuming a generic breakdown.
The Three Layers of Water Analytics iFactory Deploys
Effective water management is not a single dashboard — it is a layered detection system where each layer catches a different category of waste, from a sudden pipe failure down to a cooling tower that has slowly drifted out of its efficient operating range over several months.
Boundary Metering vs Submetered AI Analytics: A Direct Comparison
Most plants already track water use at some level — the real question is whether that tracking happens early enough and with enough granularity to act on. The comparison below shows what changes when a single site meter is replaced with process-level submetering and continuous analysis.
| Monitoring Capability | Site Boundary Metering Only | iFactory Submetered AI Analytics |
|---|---|---|
| Leak Detection Speed | Discovered only when a monthly or quarterly utility bill shows an unexplained increase | Flagged within hours by comparing live submeter data against expected baselines |
| Process Area Attribution | A single combined total offers no way to identify which system is responsible for a change | Consumption is broken down by cooling, process, dust suppression, and other systems individually |
| Efficiency Drift Visibility | Gradual increases blend into normal seasonal variation and are rarely investigated | Long-term trending isolates gradual drift from normal seasonal and production-volume variation |
| ESG and Sustainability Reporting | Requires manual compilation from utility invoices with limited process-level detail | Consumption per ton of output is generated automatically in report-ready format |
| Response to Detected Waste | Investigation starts from scratch with no data pointing to a likely source area | Alert already identifies the affected process area, narrowing the investigation immediately |
iFactory can run an initial assessment against your existing metering and utility data to show where your plant's water consumption actually breaks down before any submetering hardware is installed.
Expert Perspective: What Submetering Revealed That the Utility Bill Never Showed
We assumed our water use was reasonably efficient because the total on the utility bill had been flat for a couple of years, but flat at the site level was hiding a cooling tower that had drifted well below its target cycles of concentration and a dust suppression line that was running almost continuously overnight for no operational reason. Neither of those would have shown up as an alarm on their own — they were both slow, boring trends rather than dramatic spikes. Once we had consumption broken out by process area, the cooling tower issue alone accounted for a meaningful chunk of avoidable water and chemical treatment cost once we fixed the makeup water control. The bigger shift was cultural — our operations team now treats water the way they already treated energy, checking a dashboard instead of assuming the bill will tell them if something is wrong.
Common Root Causes Behind Cement Plant Water Waste
Water loss at a cement plant rarely comes from one dramatic event. It tends to accumulate from a handful of recurring root causes that are individually minor but collectively add up to a meaningful share of avoidable consumption once submetering makes them visible.
Why Water Waste Costs More Than the Water Itself
The direct utility charge for wasted water is often the smallest part of the actual cost, particularly for cooling tower systems where every gallon of makeup water carries a chemical treatment cost alongside it. Understanding the full cost stack makes the case for water analytics considerably stronger than the utility bill alone.
Frequently Asked Questions
iFactory turns submetered water data into continuous leak detection, efficiency trending, and report-ready sustainability metrics so waste gets caught while it is still small.