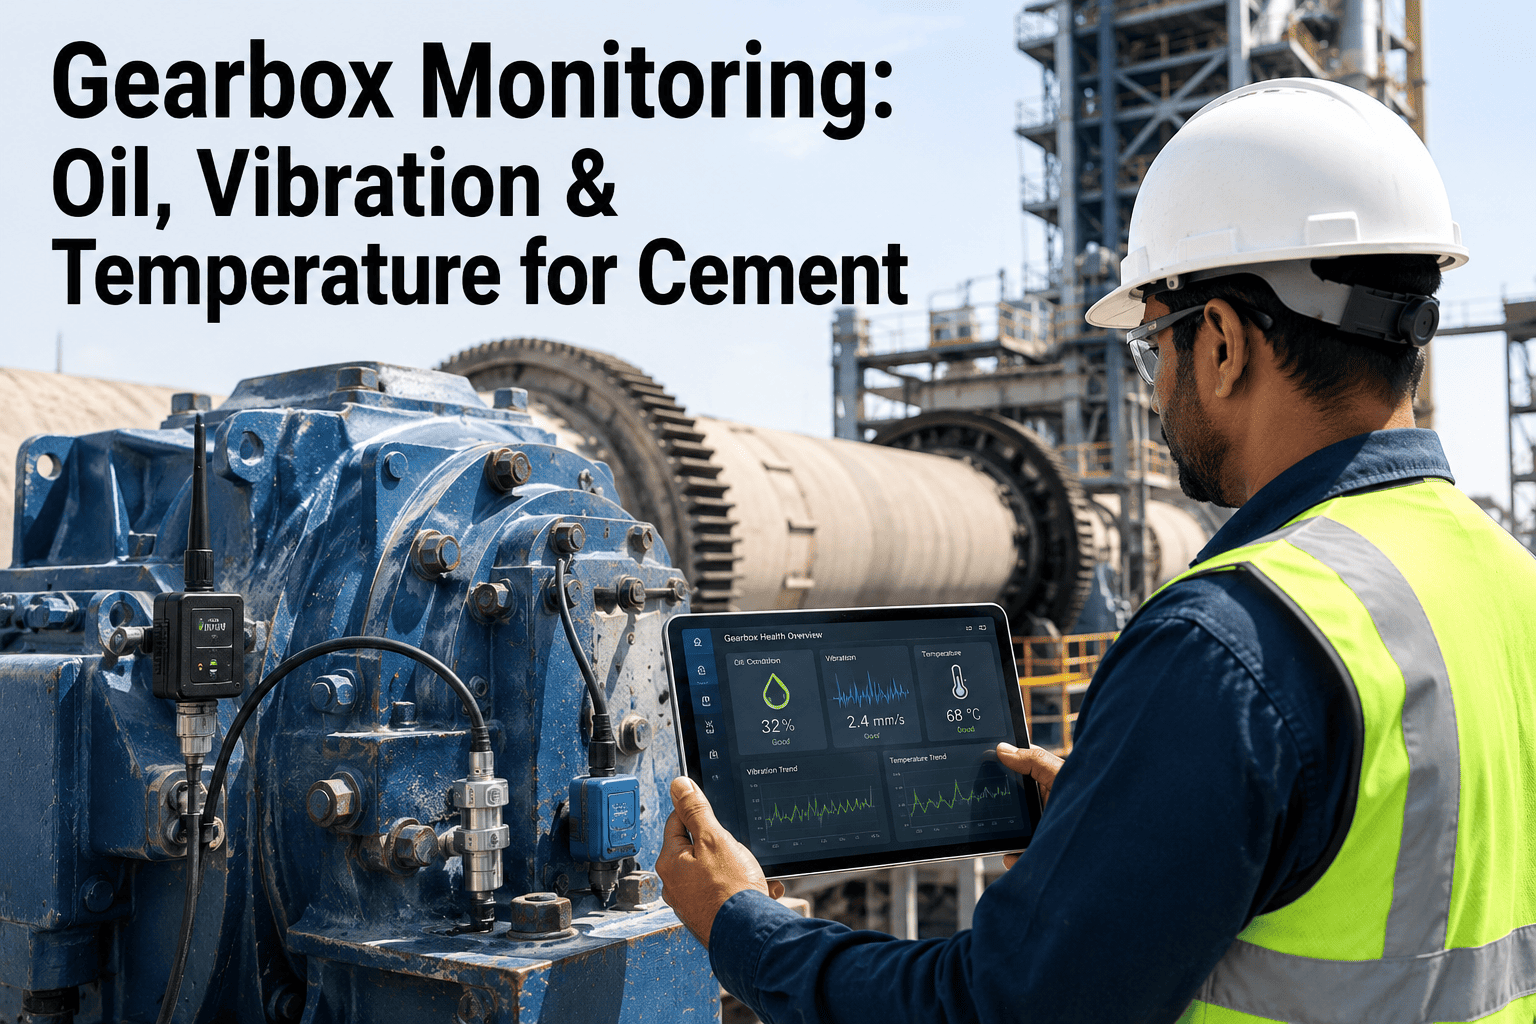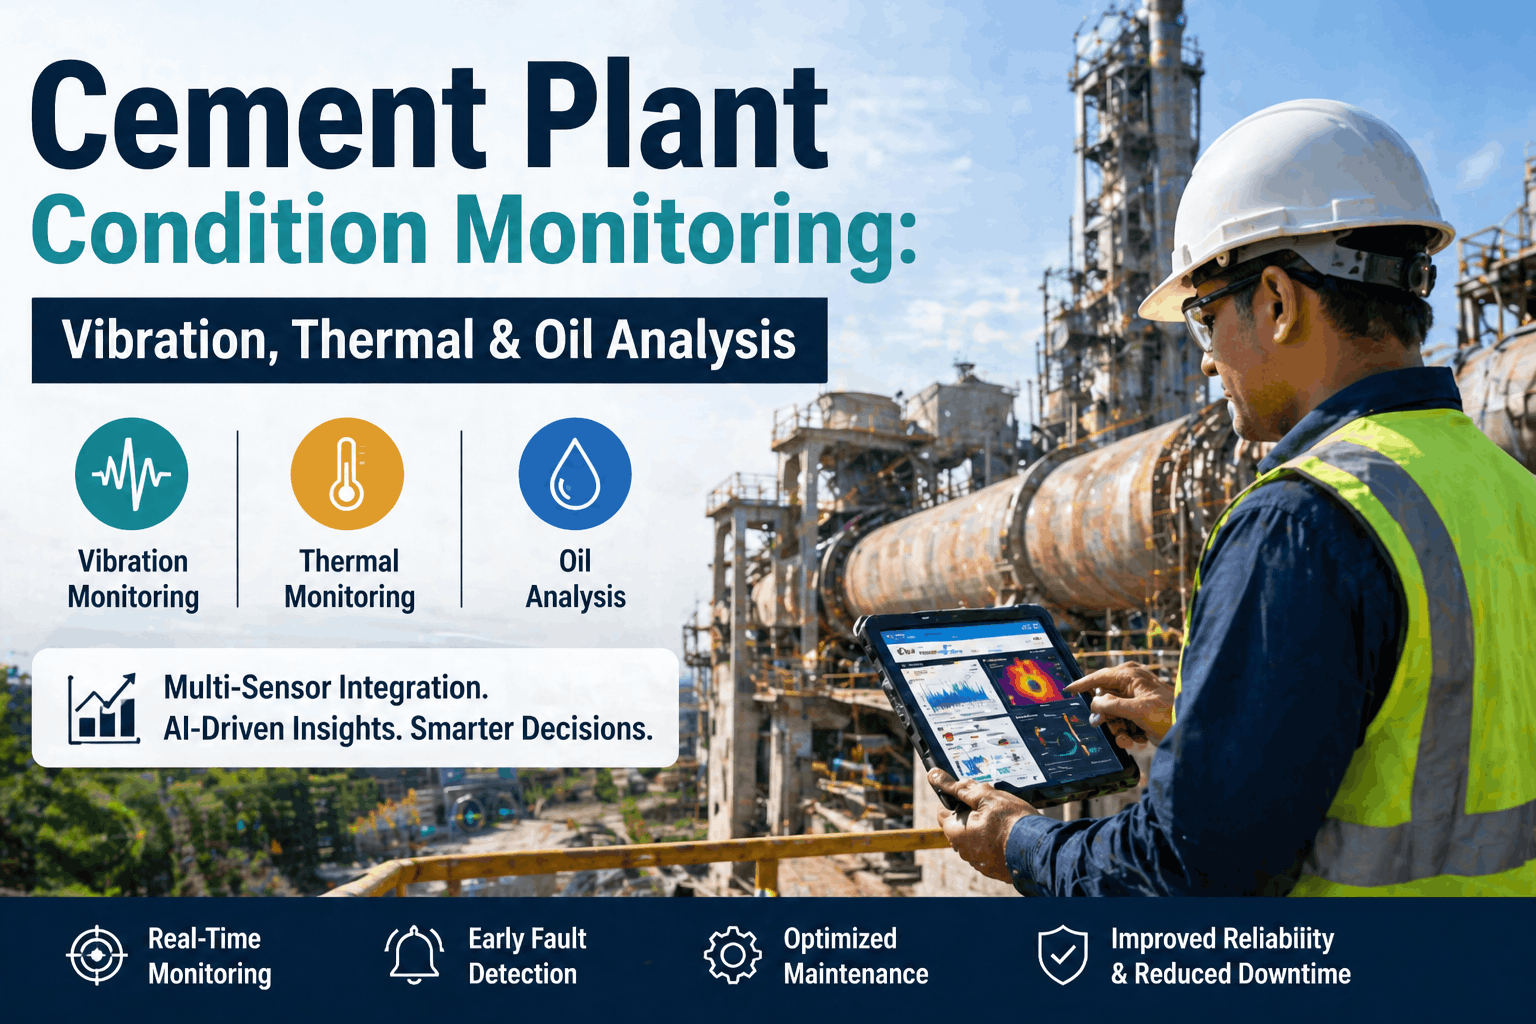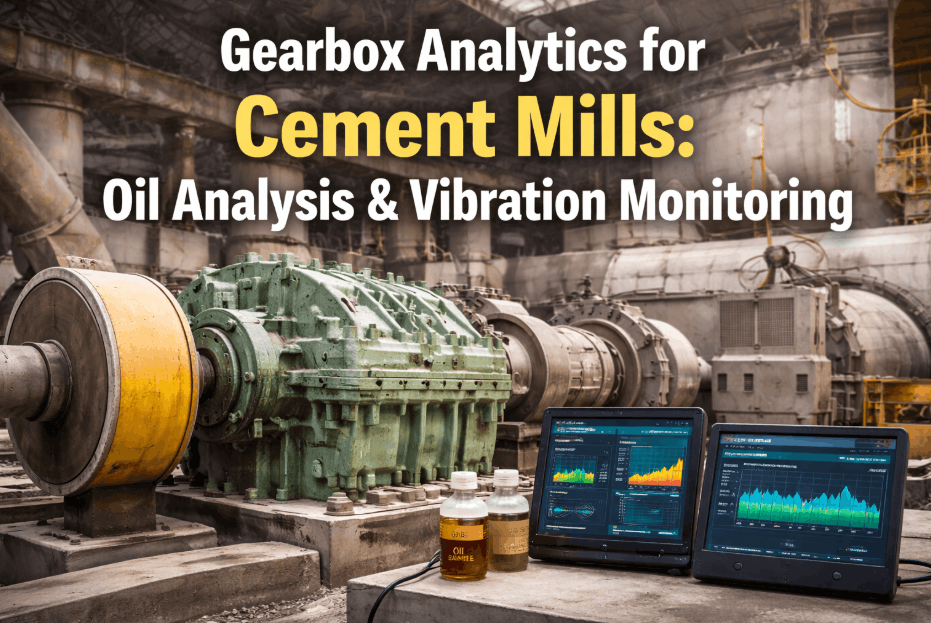
The lubricant circulating through a cement mill gearbox, a hydraulic power unit, or a gear reducer carries a constant record of what is happening inside that equipment, from microscopic metal wear particles to moisture ingress to additive breakdown. Most plants pull a sample on a fixed calendar interval, send it to a lab, and get results back days or weeks later, by which point a fast-developing wear condition may have already progressed well past an early warning stage. A structured oil analysis program built around the right sampling frequency and the right tests for each equipment type turns that lubricant into an early detection tool instead of a routine paperwork exercise. See how iFactory tracks oil analysis trends automatically across every gearbox and hydraulic system with a Book a Demo.
Let The Oil Tell You What The Gearbox Cannot Say Out Loud
Mill gearboxes, hydraulic systems, and gear reducers all fail differently, and each one leaves a different signature in its lubricant long before the fault shows up as noise, heat, or downtime. iFactory turns lab results and trend data into early alerts your maintenance team can act on before a wear condition becomes a breakdown.
Fixed Intervals Miss The Faults That Develop Fastest
A quarterly or semi-annual sampling schedule works reasonably well for slow, predictable degradation, but cement equipment does not always degrade on a predictable timeline. Contamination events, seal failures, and sudden load changes can push a lubricant from healthy to critical in a fraction of the time a fixed calendar interval assumes, and the four issues below are where that gap shows up most often.
What The Oil Is Actually Telling You In Each System
Mill gearboxes, hydraulic power units, and gear reducers carry different loads, run at different temperatures, and fail through different mechanisms, which changes what a sample from each one is worth watching for.
Mill Gearbox — Wear Metals And Particle Count
High-load gear mesh under constant grinding torque generates ferrous wear particles as tooth surfaces fatigue, and a rising particle count combined with elevated iron or copper readings is typically the earliest sign of developing gear or bearing wear.
Hydraulic System — Cleanliness Code And Water Content
Hydraulic systems are more sensitive to contamination than almost any other lubricated system on the plant, so ISO cleanliness code and water content trends matter as much as wear metal readings, since even moderate contamination accelerates pump and valve wear rapidly.
Gear Reducer — Viscosity Stability And Additive Depletion
Reducers running at steady load over long duty cycles tend to show additive package depletion before they show significant wear metal increases, making viscosity stability and additive trend analysis the earlier warning indicator for this equipment type.
Every Gearbox And Hydraulic Unit, Trended In One Place
Instead of waiting on a lab report to land in an inbox, iFactory pulls oil analysis results into the same trend view as vibration and temperature data for the same asset.
How Often To Sample And What To Test For Each System
Sampling frequency and test panel should be matched to how critical the asset is and how fast its typical failure modes develop. The table below outlines a starting point that most cement plants adjust based on their own equipment history.
| System | Typical Sampling Interval | Core Tests | Primary Alert Trigger |
|---|---|---|---|
| Mill Gearbox | Monthly to bi-monthly | Particle count, wear metals, viscosity | Rising iron or copper trend |
| Hydraulic System | Monthly | ISO cleanliness code, water content, viscosity | Cleanliness code exceeding target range |
| Gear Reducer | Quarterly | Additive depletion, viscosity, oxidation | Additive level dropping below baseline |
Critical assets with a history of contamination issues or long repair lead times often justify a shorter interval than the ones listed here, while stable, low-criticality reducers can sometimes move to a longer interval once a reliable baseline trend is established.
How A Wear Metal Trend Becomes A Scheduled Gearbox Repair
The value of continuous oil analysis trending is catching a developing wear condition early enough that the response is a planned intervention rather than a reactive teardown after a failure.
Where Oil Analysis Programs Lose Their Value
A well-designed sampling schedule can still fail to deliver useful early warnings if a few common mistakes creep into how the program is run day to day.
Inconsistent Sample Point And Technique
Pulling a sample from a different port, at a different point in the duty cycle, or with inconsistent flushing technique each time introduces noise into the trend that can mask or mimic a real developing fault.
Results Filed Instead Of Trended
When lab reports are filed as individual PDFs rather than compared against prior results automatically, a slow-developing trend across several samples is easy to miss even when each individual report looked acceptable on its own.
Generic Limits Instead Of Asset-Specific Baselines
Applying a single industry-standard wear metal limit across every gearbox on site ignores the fact that a heavily loaded mill gearbox naturally runs a higher baseline than a lightly loaded reducer, which can hide a genuine problem on the lighter-duty asset.
No Root Cause Follow-Up After A Flagged Result
Topping off or changing the oil after a flagged sample without investigating why contamination or wear occurred in the first place often means the same condition returns within a few months.
We were sampling on a fixed quarterly schedule and treating each lab report as a standalone check, so a slow rise in iron on one of our mill gearboxes went unnoticed for almost two quarters before it showed up as gear noise. Once we started trending every sample against the asset's own history instead of a generic limit, we caught the same kind of wear pattern on a different gearbox nearly three months earlier and scheduled the repair without losing production time.
What Plants Typically See After Moving To Trended Oil Analysis
Results depend on baseline data quality and how consistently samples are pulled, but the ranges below reflect what cement plants commonly report after moving from standalone lab reports to continuous trend-based oil analysis.
Practical Habits That Keep Trend Data Reliable
A handful of consistent habits determine whether an oil analysis program produces a clean, trustworthy trend or a noisy dataset that is hard to act on with confidence.
Sample From The Same Point Every Time
Using a dedicated sample port at a consistent location in the circulation path, rather than an ad hoc drain point, keeps successive samples comparable to each other.
Sample Under Similar Operating Conditions
Pulling samples while the equipment is running under a similar load and temperature each time avoids introducing variation into the trend that has nothing to do with equipment condition.
Label And Log Every Sample Consistently
Accurate labeling of the asset, date, and running hours at the time of sampling is what makes it possible to build a reliable trend rather than a set of disconnected data points.
Review Trends On A Schedule, Not Just On Flags
Reviewing trend charts periodically, even when no individual result has crossed an alarm threshold, helps catch a slow gradual drift that a single-sample alert system might not flag on its own.
What Ferrous And Non-Ferrous Particles Actually Tell You
Not all wear metal readings mean the same thing, and knowing which component a given metal typically comes from helps narrow down where a developing fault is likely located before a physical inspection ever happens.
Iron — Gear Teeth And Bearing Races
Elevated iron is the most common early indicator of gear tooth wear or bearing race fatigue in a mill gearbox, and a steady upward trend usually points to a mechanical wear process rather than a one-time contamination event.
Copper And Bronze — Bushings And Thrust Washers
A rise in copper or bronze particles often traces back to a bushing or thrust washer wearing under load, which is a common early signature in a reducer or a hydraulic pump bearing before iron levels move significantly.
Silicon — External Contamination
A spike in silicon almost always points to dust or dirt ingress rather than internal component wear, making it one of the clearest signals of a failed seal or a breather that needs attention before it accelerates wear elsewhere in the system.
Bottle Sampling Versus Inline Sensors
The method used to pull a sample affects both how often data is available and how consistent it is over time, and the right choice often depends on how critical the asset is and how fast its typical faults develop.
Bottle Sampling And Lab Analysis
The standard approach for most cement equipment, offering a full test panel including wear metals, additive levels, and contamination indicators, at the cost of a sampling interval measured in weeks rather than continuous coverage.
Inline Particle Counters
Permanently mounted sensors that continuously track particle count and sometimes moisture, giving near real-time visibility on the highest-criticality hydraulic systems where a contamination event can cause rapid damage between scheduled samples.
Combining Both Methods
Many plants pair periodic full-panel lab sampling on all assets with continuous inline sensors on their most critical hydraulic systems, getting broad coverage from the lab program and fast contamination detection where it matters most.
Frequently Asked Questions
Q: How is a hydraulic system's oil analysis different from a gearbox's?
Hydraulic systems are especially sensitive to particulate and water contamination because tight tolerances in pumps and valves wear quickly when cleanliness drops, so ISO cleanliness code and water content are usually the leading indicators to watch. Gearboxes, by comparison, are more tolerant of minor contamination but generate wear metal particles directly from gear and bearing surfaces under load, making iron, copper, and other wear metal trends the more informative signal. Matching the test panel to the equipment type avoids spending lab budget on tests that are not the most sensitive early indicator for that system.
Q: Can oil analysis data be combined with vibration data for the same asset?
Yes, and combining the two often gives a clearer picture than either one alone, since a gearbox showing both a rising wear metal trend and a corresponding increase in high-frequency vibration energy is a stronger and more urgent signal than either indicator by itself. Viewing both data streams against the same asset record makes it easier to confirm whether a flagged oil sample reflects a genuine mechanical fault or an isolated contamination event. A Book a Demo session can show how combined trending works for your specific equipment.
Q: What is a reasonable starting sampling frequency for a new oil analysis program?
Most cement plants starting a new program begin with a monthly interval on their highest-criticality assets, such as mill gearboxes and hydraulic power units, and a quarterly interval on lower-criticality reducers, then adjust based on how much variation shows up in the first several months of results. Assets with a history of contamination issues or long spare parts lead times generally justify staying on the shorter interval even after a baseline is established.
Q: How quickly should a flagged wear metal trend actually be investigated?
The right response time depends on the rate of change and the criticality of the asset rather than a single fixed rule, but a wear metal trend that is accelerating across consecutive samples on a high-criticality gearbox generally warrants inspection within days rather than waiting for the next scheduled sample. A slower, more gradual trend on a lower-criticality reducer can often be scheduled into the next routine maintenance window without urgency. Reach out through Support Contact if you want help setting response thresholds for your specific assets.
Q: Does moving to condition-based oil changes reduce lubricant costs?
In many cases yes, because a fixed calendar-based oil change interval often replaces oil well before it has actually degraded, while condition-based scheduling extends the interval on stable assets and shortens it only where the trend data actually shows a need. The net effect for most plants is a reduction in total oil purchased and disposed of, alongside the earlier fault detection benefit, though the exact savings depend on how conservative the original fixed interval was.
Turn Lab Reports Into An Early Warning System
iFactory trends oil analysis results automatically against each asset's own baseline, so a developing wear condition on a gearbox or hydraulic system gets flagged weeks before it becomes a breakdown.