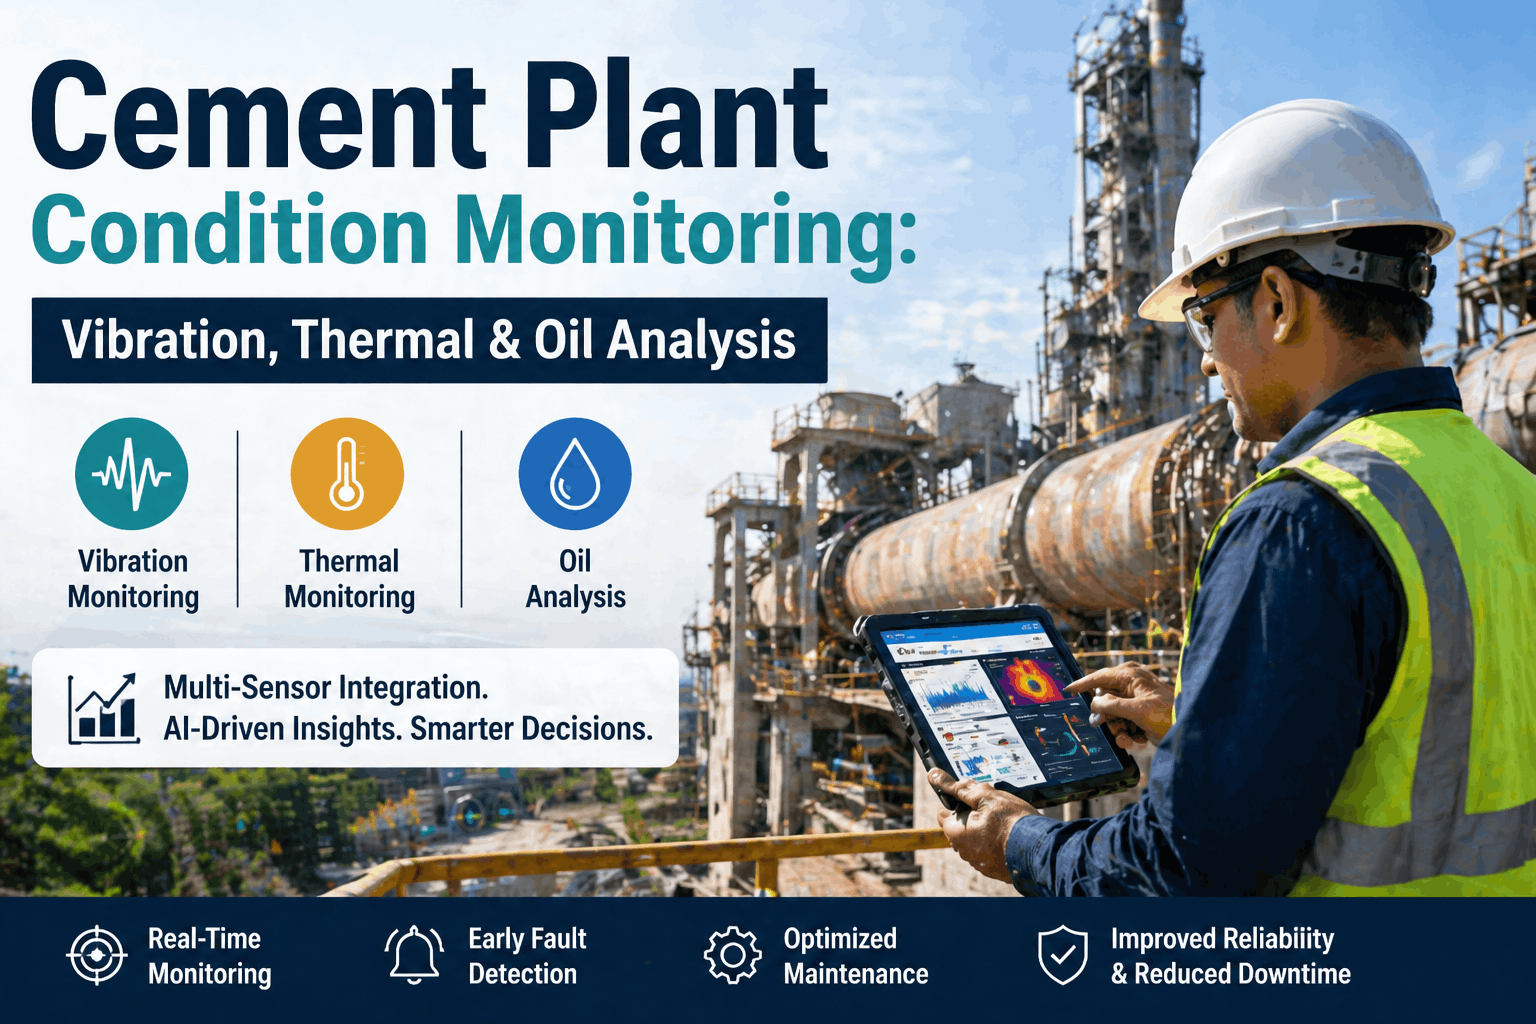
Cement plant gearboxes and hydraulic systems operate under extreme loads, abrasive dust, and continuous heat that make lubrication failure one of the top causes of unplanned downtime. A single kiln drive gearbox failure can halt production for 3-7 days, costing upwards of $150,000 per hour in lost clinker output. Oil analysis provides early warning of wear, contamination, and degradation — giving maintenance teams a 2-6 month lead time to plan repairs instead of reacting to catastrophic failures. Book a demo to see how iFactory automates oil analysis tracking.
Cement Lubrication Intelligence
70% of Cement Gearbox Failures Are Lubrication-Related — And Almost All Are Preventable
Oil analysis programs for gearboxes, reducers, and hydraulic systems catch degradation months before failure — turning a $200K emergency into a scheduled $15K repair.
70%
Gearbox failures linked to lubrication issues
$150K
Per hour cost of kiln production downtime
2-6 Mo
Early warning window from oil analysis
Sources: Noria Corporation, SKF Cement Industry Report, Mobil Industrial Lubricants Study
The Failure Cascade: How a $50 Oil Sample Prevents a $200,000 Disaster
Most cement plants discover gearbox problems only when vibration spikes, temperatures climb, or metal shavings appear in the oil drain. By that point, the damage is irreversible and the repair bill is enormous. Oil analysis intercepts this cascade at the earliest stage — when corrective action is still inexpensive and fast.
The Degradation Pathway in Cement Gearboxes
01
Contamination Ingress
Cement dust, silica particles, and moisture enter through worn seals, breathers, and inspection covers during operation
02
Oil Degradation
Viscosity shifts, oxidation accelerates, additive packages deplete faster than expected under load
03
Accelerated Wear
Abrasive particles score gear surfaces, bearing races begin pitting and spalling under load
04
Component Failure
Gear tooth fracture, bearing seizure, shaft misalignment — entire system shuts down
Oil analysis catches it here
$15-50 per sample
If missed, cost escalates to
$150K-500K+ per event
5 Critical Systems That Demand Oil Analysis in Cement Plants
Not all lubricated systems carry the same risk. Cement plants have dozens of gearboxes and hydraulic units, but five system categories account for over 85% of lubrication-related production losses. Each has unique operating conditions that require specific analysis parameters and sampling strategies.
01
Kiln Drive Gearbox
Highest Criticality
Slow-speed, extreme torque, continuous 24/7 operation. These gearboxes cost $500K-$2M and take 3-7 days to replace. Oil analysis here is non-negotiable — even minor wear trends indicate months of remaining life for planning.
02
Raw Mill Reducer
High Shock Loads
Subject to heavy shock loads from grinding media and variable ore hardness. Dual-stage planetary reducers run at high temperatures with large oil volumes — making contamination detection critical before particles circulate through multiple bearing sets.
03
Cement Mill Gearbox
Continuous Vibration
Operates in a high-vibration environment with constant grinding forces. Oil must simultaneously lubricate gears, bearings, and sometimes cooling systems. Wear metal trends here correlate directly with product quality and mill throughput.
04
Hydraulic Systems
Contamination Sensitive
Crushers, stackers, reclaimers, and roller press hydraulic systems run at 200-350 bar. Particle contamination is the number one killer — clearances are 1-25 microns and cement dust is everywhere. Particle count trending is essential.
05
Vertical Roller Mill
High Temperature
Combines gear reduction with high-pressure hydraulic tensioning. Oil operates at elevated temperatures with large circulation volumes. Oxidation stability and viscosity retention are the primary analysis focus areas for extended drain intervals.
Oil Analysis Parameters: What to Measure and Why
Effective oil analysis is not about running every available test — it is about selecting the right parameters for each system type and setting actionable limits. The table below covers the core parameters every cement plant oil analysis program should include, with threshold values calibrated for heavy industrial gearboxes and hydraulic systems.
| Parameter |
Test Method |
Healthy Range |
Warning |
Critical |
What It Detects |
| Viscosity @40C |
ASTM D445 |
+/- 10% of new |
+/- 15% of new |
+/- 20% of new |
Oil thickening or thinning from contamination, shear, or thermal breakdown |
| Water Content |
ASTM D6304 |
Less than 0.1% |
0.1% - 0.2% |
Greater than 0.2% |
Seal failure, condensation buildup, or coolant leak into oil system |
| Particle Count |
ISO 4406 |
18/16/13 |
20/18/15 |
22/20/17 |
Dust ingress, filter bypass, or active wear particle generation |
| Iron (Fe) |
ASTM D5185 |
Less than 50 ppm |
50 - 100 ppm |
Greater than 100 ppm |
Gear tooth wear, bearing race spalling, shaft scoring |
| Copper (Cu) |
ASTM D5185 |
Less than 15 ppm |
15 - 30 ppm |
Greater than 30 ppm |
Bronze bushing wear, bearing cage degradation, worm gear wear |
| Lead (Pb) |
ASTM D5185 |
Less than 10 ppm |
10 - 20 ppm |
Greater than 20 ppm |
Babbitt bearing overlay failure, sleeve bearing deterioration |
| Silicon (Si) |
ASTM D5185 |
Less than 15 ppm |
15 - 30 ppm |
Greater than 30 ppm |
External dust and silica contamination from cement process |
| TAN |
ASTM D664 |
Less than 1.0 |
1.0 - 2.0 |
Greater than 2.0 |
Oil oxidation level and acidic degradation product accumulation |
| Oxidation |
FTIR |
Less than 10 |
10 - 20 |
Greater than 20 |
Thermal and oxidative oil breakdown measured in absorbance units |
| Ferrous Density |
PQ Index |
Less than 25 |
25 - 50 |
Greater than 50 |
Large ferrous particles from severe wear that spectroscopy cannot detect |
Wear Metal Trending: Reading the Metal Signature of Your Gearbox
Individual oil analysis snapshots tell you the current condition. Wear metal trending tells you the trajectory — and that is where the real predictive power lives. Each metal in your oil carries a signature that points directly to the component that is wearing. Understanding these signatures transforms oil analysis from a reporting tool into a diagnostic engine.
Contamination Control: The 3-Stage Defense System
Cement plants are inherently dusty environments. No amount of sealing can keep all contamination out — the goal is a layered defense that minimizes ingress, removes what enters, and monitors what remains. Oil analysis is the third and most critical layer because it is the only one that tells you whether the first two are actually working.
Stage 1
Exclusion — Keep Contamination Out
Desiccant breathers on all gearboxes and reservoirs
Seal upgrades from lip seals to labyrinth or magnetic types
Filtered fill ports and transfer equipment
Enclosed oil storage with positive pressure
Stage 2
Removal — Filter What Gets In
Online filtration upgrades to target ISO 16/14/11 or better
Offline kidney loop filtration for critical gearboxes
Water separation filters for systems prone to moisture
Magnetic plugs and strainers for ferrous particle capture
Stage 3
Monitoring — Verify Defense Effectiveness
Scheduled oil sampling with particle count trending
Silicon tracking to measure dust ingress rate over time
Water content monitoring to validate seal and breather performance
Automated alerts when contamination exceeds defense capacity
Oil Life Optimization: From Reactive to Predictive
Most cement plants change oil on a fixed schedule — every 12 months or 8,000 operating hours, regardless of actual condition. This means some oil is changed too early, wasting money, while other oil is changed too late, after degradation has already damaged components. Condition-based oil change decisions, driven by analysis data, typically extend oil life by 2-3x while improving equipment protection.
Month 1
Baseline Sampling All Systems
Collect representative oil samples from every gearbox, reducer, and hydraulic system. Document current oil condition, establish reference values for each parameter, and identify any systems already in warning or critical state that need immediate attention.
Month 2-3
Establish Trends and Set Alarms
With 2-3 data points per system, begin plotting wear metal trends and contamination levels. Set system-specific alarm limits based on baseline data, OEM guidelines, and industry standards. Flag any systems showing upward wear trajectories for increased sampling frequency.
Month 4-6
Optimize Change Intervals
Compare oil condition at scheduled drain points against specification limits. Systems where oil remains within healthy range can safely extend drain intervals. Systems degrading faster than expected get root cause analysis and contamination control upgrades.
Month 7-12
Predictive Mode and ROI Realization
Full trend data enables predictive maintenance scheduling. Oil changes shift entirely to condition-based triggers. Wear metal trending feeds into maintenance planning for gearboxes and bearings. Documented savings from extended oil life, avoided failures, and reduced downtime typically exceed program costs by 5-10x.
Is Your Oil Analysis Program Catching Problems — Or Just Generating Reports?
iFactory connects oil analysis data to your maintenance workflow — trending wear metals, triggering work orders when limits are exceeded, and correlating oil condition with equipment health across your entire cement plant.
Documented Savings from Oil Analysis Programs in Cement
The financial impact of a well-run oil analysis program extends far beyond avoided breakdowns. When oil condition data drives maintenance decisions, the savings compound across lubricant procurement, waste disposal, energy consumption, and equipment lifespan. Here is what leading cement plants have documented from mature oil analysis programs.
Condition-based oil changes
Replacing fixed-interval drains with analysis-driven decisions extends oil life by 3-5x on average. For a cement plant with 50 gearboxes using 20,000 liters of gear oil annually, this alone can save $80,000-$120,000 per year in lubricant costs and waste disposal.
40-60%
Fewer Lube Failures
Reduction in lubrication-related breakdowns
Plants with systematic oil analysis programs report 40-60% fewer lubrication-related equipment failures within the first two years. Each avoided gearbox failure saves $50,000-$500,000 in repair costs plus $150,000+ per day in avoided production losses.
From avoided gearbox replacements alone
A mid-size cement plant typically replaces 2-4 major gearboxes per year due to lubrication failure. Oil analysis-driven predictive maintenance reduces this to 0-1 replacements, saving $200,000-$800,000 annually in capital equipment costs and installation labor.
90%
Fewer Emergency Changes
Reduction in unplanned oil changes
Emergency oil changes cause production delays, require overtime labor, and generate unplanned waste. Oil analysis programs reduce emergency changes by up to 90% by identifying degradation early enough to schedule oil changes during planned maintenance windows.
Frequently Asked Questions
How often should cement plant gearboxes be sampled for oil analysis?
Critical systems like kiln drive gearboxes and raw mill reducers should be sampled monthly during the first year to establish baseline trends. Once stable trends are confirmed, sampling can typically shift to quarterly for normal systems and monthly for critical ones. Hydraulic systems on crushers and roller presses should be sampled monthly due to their sensitivity to particle contamination. Any system showing an upward wear trend should immediately move to monthly or even bi-weekly sampling until the trend is understood and resolved.
What are the most critical oil analysis parameters for hydraulic systems in cement plants?
Particle count (ISO 4406) is the single most important parameter for cement plant hydraulic systems because clearances in hydraulic valves and pumps range from 1-25 microns — smaller than most cement dust particles. Water content is the second priority because water accelerates oil oxidation and causes rust in precision components. Viscosity is third because hydraulic systems are extremely sensitive to viscosity changes that affect pump efficiency and valve response.
Contact our support team for help setting up hydraulic oil analysis parameters.
Can oil analysis detect gearbox problems before vibration monitoring catches them?
Yes — oil analysis typically provides 2-6 months of early warning before vibration monitoring detects the same problem. This is because wear particles enter the oil immediately when surface degradation begins, while vibration only becomes measurable once enough material has been removed to create measurable dynamic imbalance or clearance changes. Oil analysis is especially superior for slow-speed gearboxes like kiln drives where vibration signals are weak and masked by process noise.
Book a demo to see how iFactory correlates oil and vibration data.
How do we set oil analysis alarm limits for cement plant equipment?
Alarm limits should be set using a combination of three approaches: OEM recommended limits from the gearbox or component manufacturer, industry standards such as ISO 4406 for particle counts and ASTM guidelines for wear metals, and most importantly, your own baseline data from 3-6 months of regular sampling. The most effective approach is to set initial alarms based on OEM and industry values, then refine them based on actual operating data. A sudden increase of 20-30% above established baseline for any wear metal should trigger an investigation, even if the absolute value is still below the published warning limit.
What is the ROI of implementing an oil analysis program in a cement plant?
A well-implemented oil analysis program typically delivers 5-10x return on investment within the first 12-18 months. For a mid-size cement plant, the program cost — including sampling supplies, lab analysis, and program management — runs $30,000-$60,000 annually. The documented savings come from three sources: extended oil drain intervals saving $80,000-$120,000 in lubricant costs, avoided gearbox failures saving $200,000-$800,000 in capital and downtime, and reduced energy consumption from properly lubricated systems saving another $20,000-$50,000. The payback period is typically 3-6 months.
Every Month Without Oil Analysis Trending Is a Month of Blind Risk
iFactory automates oil sample tracking, wear metal trending, alarm management, and work order generation — so your team acts on data instead of chasing emergencies. Deploy in weeks, not months.