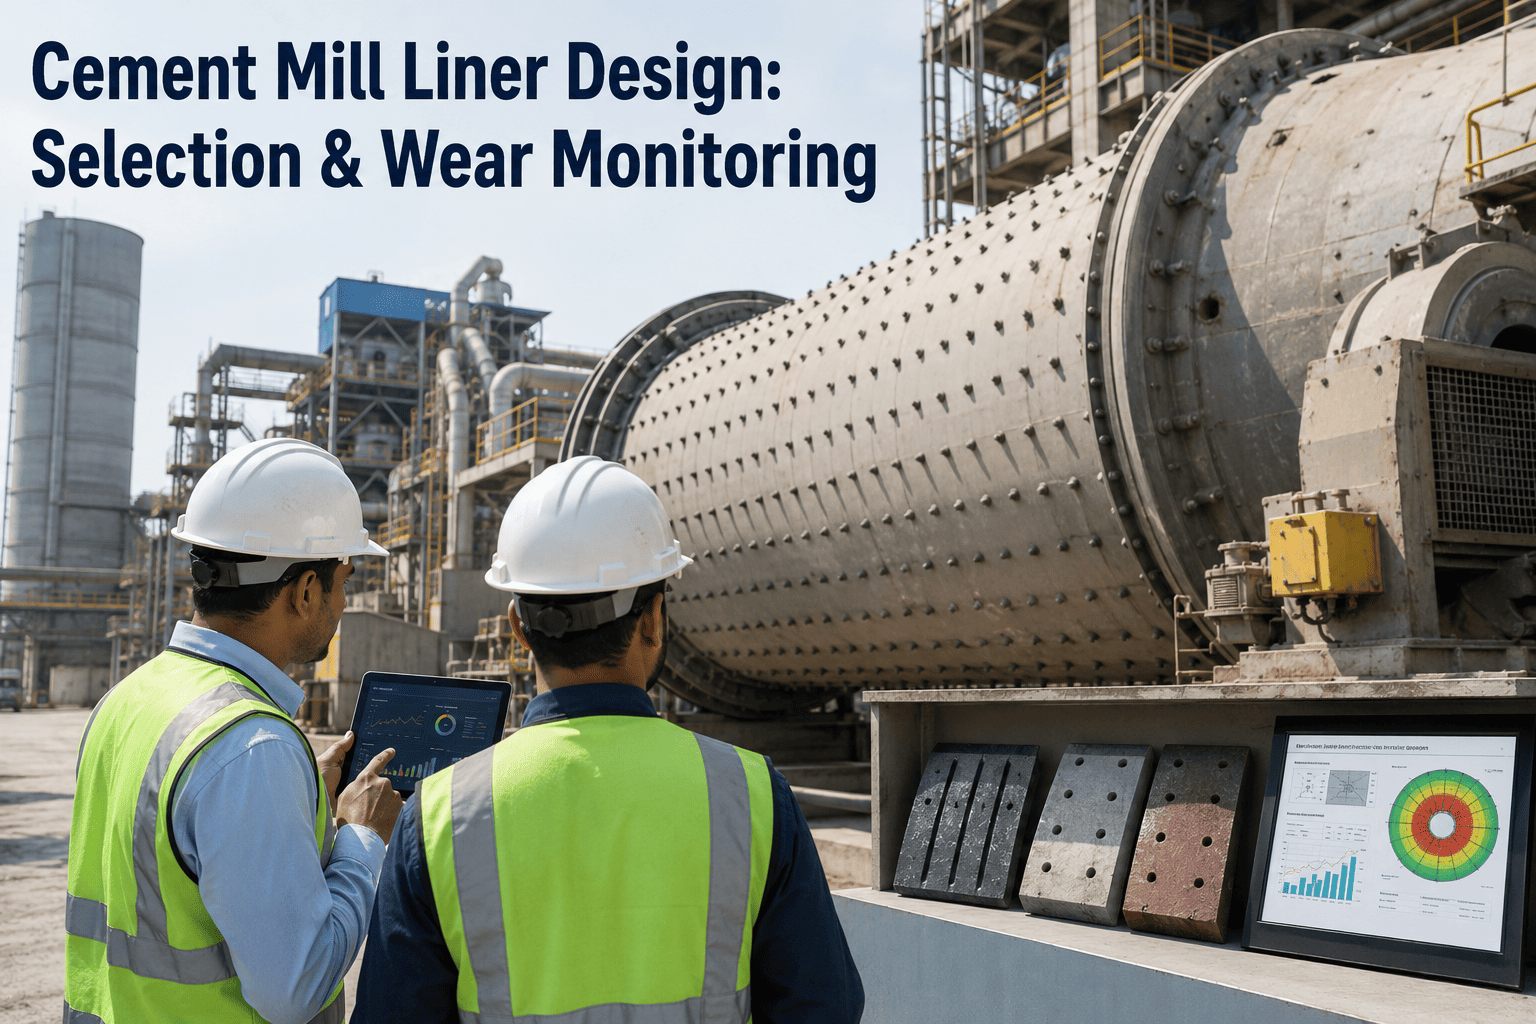
Cement Mill Liner Design: Selection & Wear Monitoring

By Johnson on August 12, 2026

cement-mill-liner-design-selection-wear-monitoring

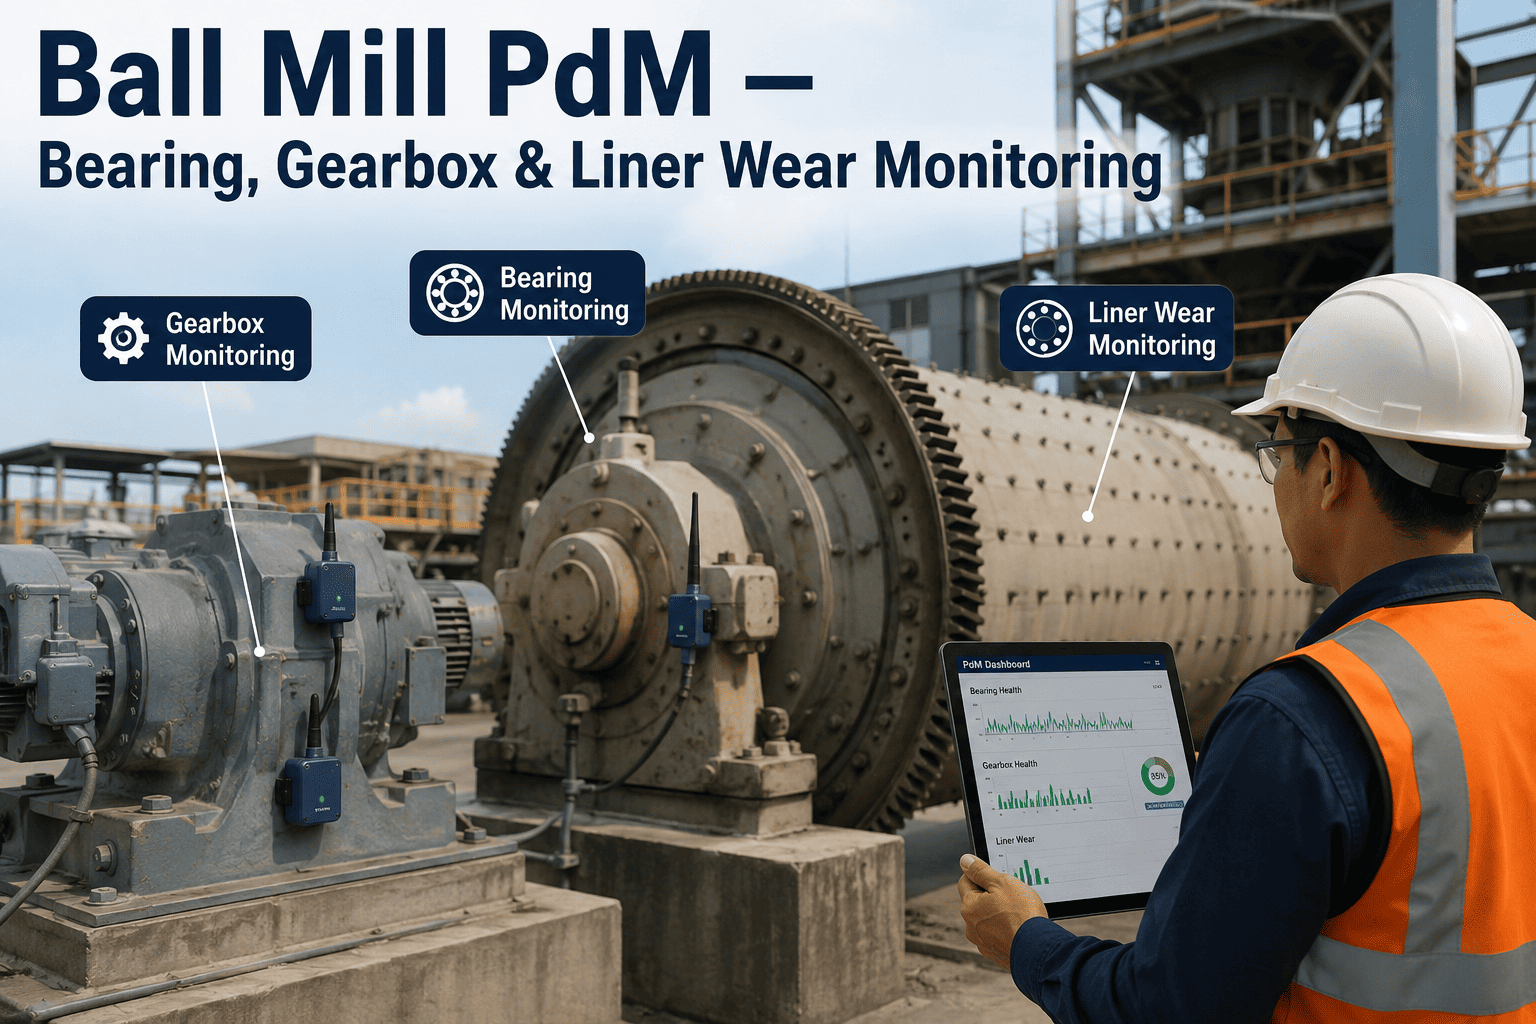
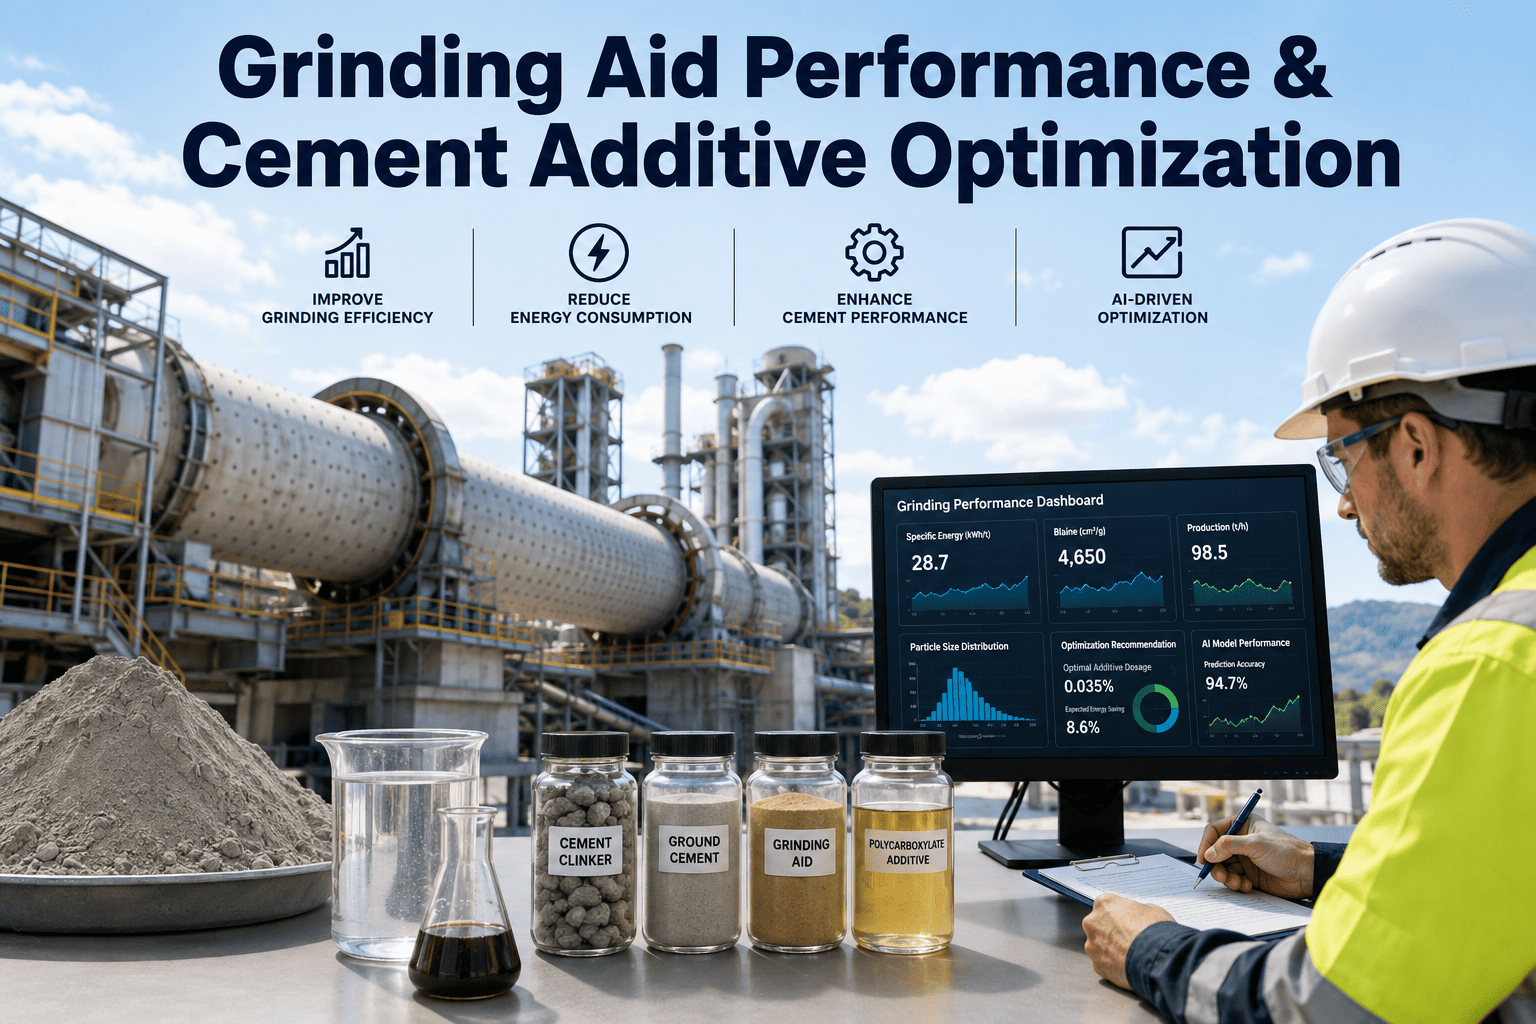
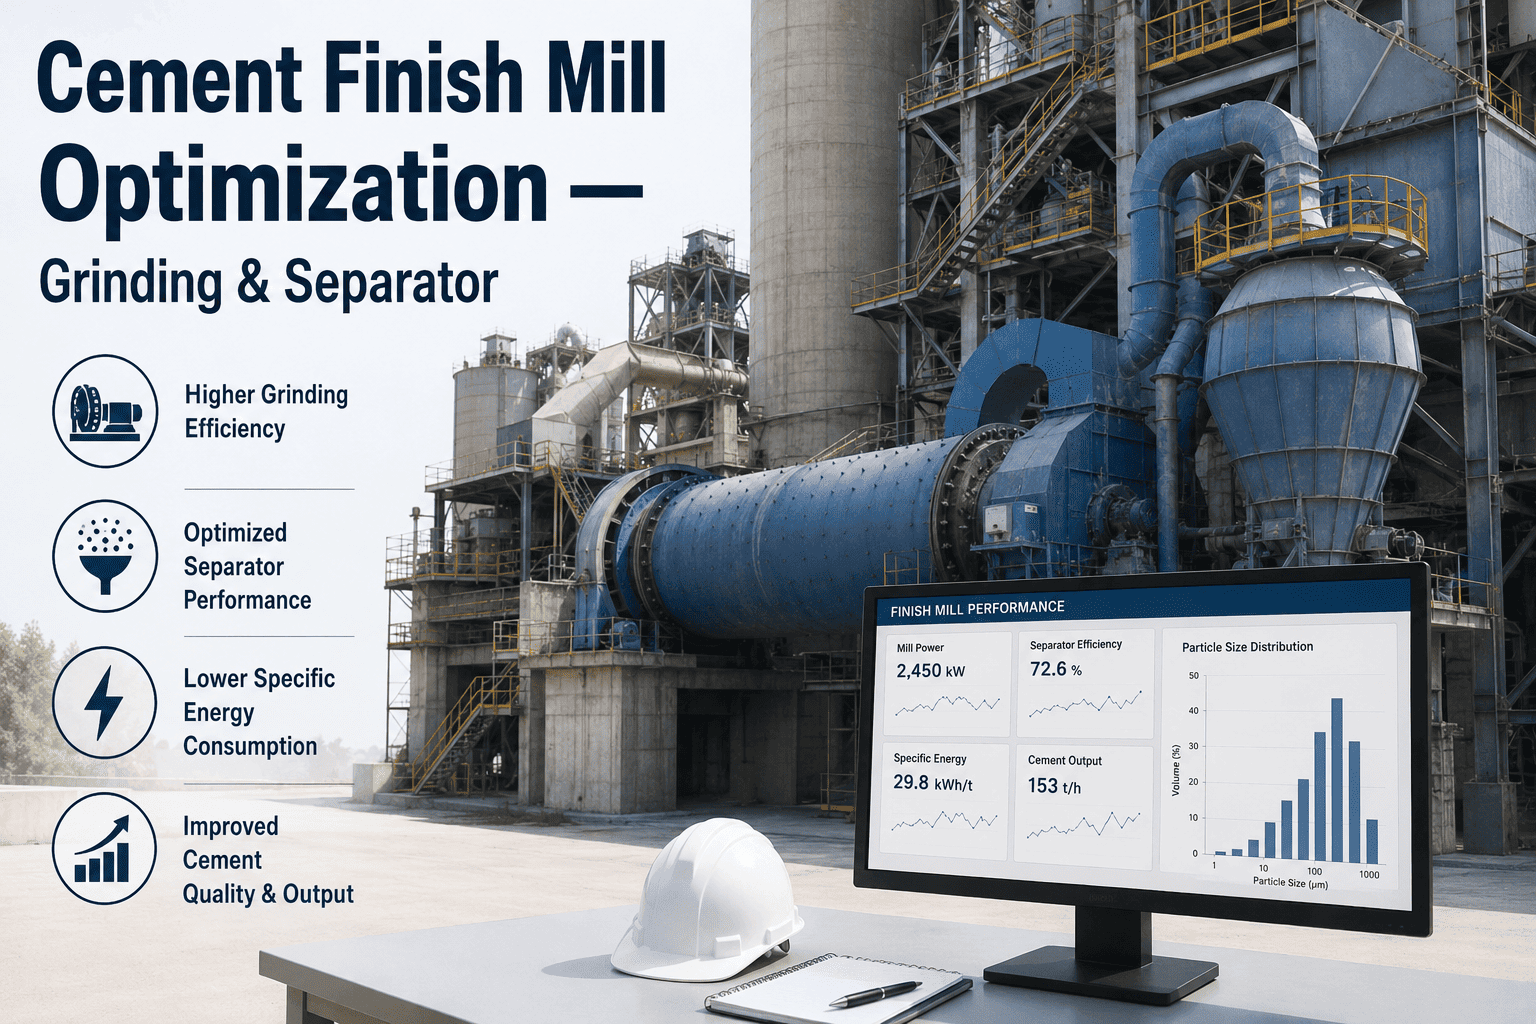
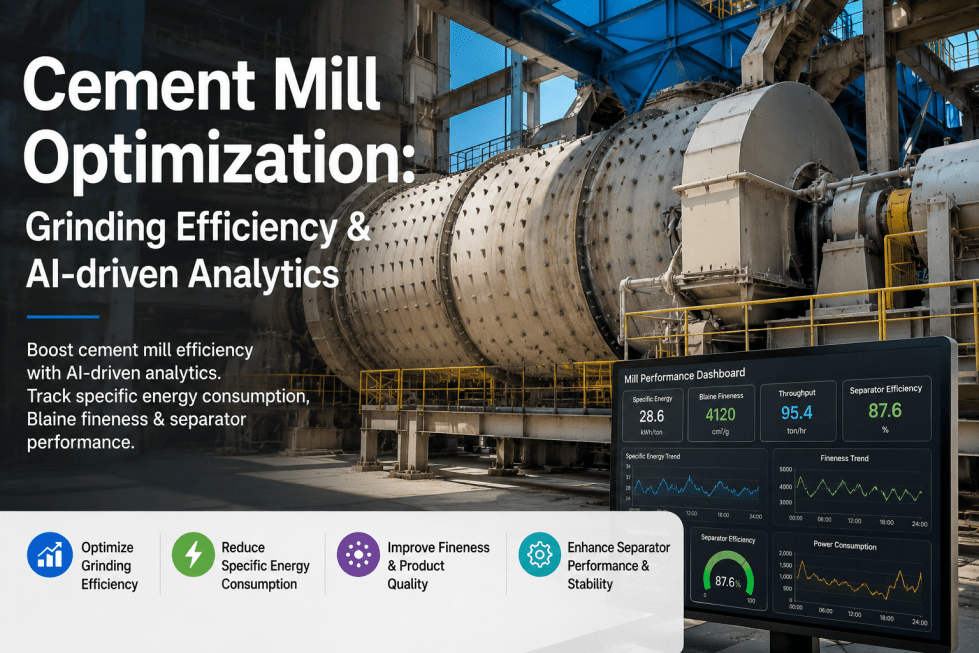
A cement mill liner is one of the cheapest components in the grinding circuit and one of the most decisive in setting what every tonne of cement costs to produce. Lifter height, face angle and classifying profile govern how the ball charge cataracts, how impact energy transfers into the clinker bed, and how media segregates along the chamber — and all three drift continuously from the moment a new set goes in. Most plants discover the drift only when specific power has already climbed three to five percent and throughput has quietly slipped, because liners are inspected once a year during a planned outage and never measured in between. Liner selection and structured wear monitoring together remain the highest-return, lowest-capital lever available to a grinding department. See how cement teams are structuring liner data with the iFactory platform team.

Cement Grinding Intelligence

Your Mill Liner Is Wearing. Your Specific Power Is Climbing. Nobody Is Watching Both.

Profile selection, material specification and hour-based wear trending in one system — so relining happens on data, not on a calendar guess.

33-40
kWh/t typical closed-circuit finish grind
3-5%
SPC rise once lifters drop below 60% height
4-7%
Grinding efficiency lost to rounded classifying edges
50%+
Liner life gain recorded from correct material change

What The Liner Is Actually Doing Inside The Chamber

Ask most maintenance planners what a mill liner does and the answer is protection — it keeps the ball charge from grinding a hole through the shell. That is true and it is the least interesting half of the job. The liner is also the only mechanical interface that decides where the charge lands. Lifter bars pick up the media on the rising side of the shell, carry it to a release angle, and throw it across the chamber. Where that charge lands determines whether the mill is grinding clinker or grinding itself.

When the trajectory is correct, media strikes the toe of the charge and every joule goes into particle breakage. When lifters are too tall or the mill is running fast, media cataracts past the toe and strikes the liner directly on the far side, which destroys the liner, hammers the shell bolts, and converts grinding energy into noise and heat. When lifters have worn short and the face angle has rounded off, the charge stops being lifted at all — it slips and cascades in a slow roll that produces attrition without impact. The mill still draws power, still spins, still reports throughput, and grinds noticeably worse.

Shell & Backing
The outer band is the shell the liner exists to protect. Once a lifter wears through to the shell plate, repair moves from a consumable replacement to a structural weld job during an extended outage.
Lifter Bars
Height and face angle set the release point. A 17 degree face angle is a common optimum for a 4.2 m diameter mill; wear that flattens the leading edge shifts release earlier and collapses impact energy.
Charge Trajectory
The dashed arc is the design flight path. Correct trajectory lands media on the toe of the charge; over-throw lands it on bare liner, which is where rapid failure and shell damage begin.
Toe Of Charge
The shaded mass is where breakage should happen. Everything in liner design is an argument about hitting this zone consistently as the profile wears from day one to relining day.

The Cost Chain Nobody Traces Back To The Liner

Grinding is where the electricity goes in a cement plant. Roughly two-thirds of a plant's electrical energy is consumed reducing particle size, and traditional ball mills in closed circuit sit in a band of 33 to 40 kWh per tonne for finish grinding while vertical roller mills achieve 20 to 23 kWh/t for comparable fineness. Against those numbers, a few percentage points of grinding efficiency is not a rounding error. A 100 tph mill running at 38 kWh/t carries a power bill measured in millions annually, and a four kWh/t improvement through liner, media and separator work reclaims a substantial fraction of it without touching clinker factor or product quality.

What makes liner-driven loss so hard to catch is that it never announces itself. There is no alarm, no trip, no work order. The symptom appears in the control room as a slightly lower feed rate to hold Blaine, or in the lab as a wider residue at the same separator speed, or in the monthly energy report as a specific power number that crept up and stayed. The chain below is how a mechanical condition becomes a financial one, and why the diagnosis so often stops at the wrong link.

Lifter height drops below 60% of nominal
Charge slips instead of cataracting; impact energy falls
Specific power climbs 3-5% at constant Blaine
Classifying liner leading edge rounds off
Coarse media drifts toward discharge, fine media forward
Grinding efficiency drops 4-7% in chamber two
Bolt holes elongate and liners loosen
Movement under load, fretting, and cracked backing plates
Emergency shutdown risk and extended reline window
Wrong material for the abrasion and impact mix
Premature cracking or accelerated abrasion in weeks not months
Unbudgeted liner spend and out-of-cycle downtime
No wear record between annual inspections
Reline scheduled by calendar, not by measured remaining life
Liner scrapped early or run to failure — both expensive

Liner Profiles And What Each One Is Built To Do

Profile selection is the first real decision and it is usually inherited rather than chosen. A plant runs the profile the mill was supplied with, replaces like for like, and never revisits whether the geometry still suits a clinker that has changed in grindability, a separator that has been upgraded, or a target fineness that has moved. Profile is not decoration — it is the mechanical program the mill executes several million times a day.

The six geometries below cover the overwhelming majority of cement grinding installations. In a two-chamber ball mill, the first chamber needs lift and impact while the second needs classification and attrition, which is why a single profile down the full mill length is almost always a compromise. Mixing profiles arbitrarily within one chamber, however, disrupts material flow and produces uneven wear that is worse than either profile alone.

Step Liner
Sharp shoulder gives high, predictable lift for coarse first-chamber grinding. Strong impact transfer, but the step edge is the first geometry to round off under abrasive clinker.
Wave Liner
Rolling crests give moderate lift with smoother charge motion and lower shell shock. Widely used where impact must be softened to protect bolts and backing in older shells.
Classifying Liner
Graded pocket depth sorts media by size along the chamber, holding large balls at the inlet and small balls at discharge. Its whole value lives in a sharp leading edge.
Lifter Bar & Shell Plate
Two-part system separating the wear duties. Bars can be replaced on a shorter cycle than plates, which balances lifter life against shell plate life instead of scrapping both together.
Corrugated Liner
Close-pitch ridges favour attrition over impact, suited to fine-grinding duty in the second chamber where the objective is surface development rather than particle fracture.
High-Low Wave
Alternating crest heights extend usable life by staggering the wear front, so lift is retained deeper into the campaign instead of collapsing once a uniform crest rounds over.

Material Selection: The Decision That Sets Wear Life

Material is where liner economics are won or lost, and it is routinely decided on landed cost per tonne of casting rather than cost per tonne of cement ground. The two are not the same number. A cheaper alloy that survives eight months in a duty where the correct specification would have run fourteen has not saved money — it has bought an extra shutdown, an extra crew mobilisation, and several weeks of degraded grinding on a rounded profile before anyone noticed.

The core trade-off is abrasion resistance against impact toughness, and no material maximises both. High-chromium white iron carries hardness above 600 BHN and outstanding abrasion resistance, but it is brittle and unforgiving of tramp metal or heavy impact. Austenitic manganese steel work-hardens under repeated blows and absorbs impact superbly, but it deforms in service — and a manganese liner that has grown dimensionally can seize in the shell and turn a planned relining shutdown into an unplanned overrun. Chrome-moly alloy steel gives up some peak hardness in exchange for dimensional stability, which makes it the operationally safer choice wherever the relining window is tight.

Material Typical Hardness Best Fit Duty Primary Strength Main Limitation
High-Chromium White Iron 600+ BHN Fine grinding, second chamber, highly abrasive clinker Highest abrasion resistance per unit cost Brittle; poor tolerance of tramp metal and heavy impact
Chrome-Moly Alloy Steel 350-400 BHN First chamber, mixed impact and abrasion duty Dimensional stability; predictable relining Lower peak hardness than white irons
Cr-Mo White Iron 550-650 BHN Large-diameter mills, high-low wave configurations Documented service life gains above 50% on switch Higher casting cost and longer lead time
Austenitic Manganese Steel 200 BHN rising in service High-impact zones, inlet heads, coarse feed Work-hardens under blows; very high toughness Deforms and can seize in the shell; abrasion resistance limited
Rubber & Rubber-Steel Composite Elastomeric Fine grinding chambers, noise-sensitive installations 4-8 hour change-out against 16-24 hours for steel Temperature and impact limits restrict cement duty
Ceramic Composite Embedded ceramic in alloy matrix Extreme-abrasion duty where downtime cost dominates Service life extensions reported well beyond conventional alloys Premium capital cost; requires disciplined installation

Notice what the change-out column implies. A rubber or composite set that installs in four to eight hours against sixteen to twenty-four for steel is not just a wear decision, it is a shutdown-duration decision — and in an operation where every idle hour carries a heavy cost, installation time can outweigh a modest difference in wear rate. The right way to compare candidates is total cost per tonne ground across a full campaign, including crew hours, lifting equipment, and lost production, not the price of the castings. If you want that comparison built against your own mill records, book a demo and bring your last three liner invoices.

Chamber One And Chamber Two Are Two Different Machines

Treating a two-chamber mill as a single asset is one of the most common structural mistakes in liner management. The chambers do different work, wear at different rates, fail in different ways, and justify different materials. A liner strategy that specifies one alloy and one profile for the whole mill is optimising for procurement simplicity, not for grinding.

Chamber One — Coarse Grinding
MechanismImpact-dominant fracture of coarse clinker
MediaLarge balls, typically 90 to 60 mm range
Filling TargetAround 28-32% — impact collapses below 24%
Liner DutyMaximum reliable lift and trajectory control
Profile FitStep, lifter bar, or high-low wave
Failure ModeCracking, bolt elongation, lifter height loss
Material BiasToughness over peak hardness
Chamber Two — Fine Grinding
MechanismAttrition-dominant surface development
MediaGraded small balls, roughly 25 to 12 mm
Filling TargetAround 24-28% — dead load rises above 34%
Liner DutyMedia classification and gentle cascading
Profile FitClassifying, corrugated, or reverse-spiral
Failure ModeEdge rounding, lost classification effect
Material BiasAbrasion resistance over impact toughness

The practical consequence is that the two chambers rarely reach end of life together, and forcing them onto the same replacement date wastes remaining life in one or runs the other past its useful profile. Tracking them as separate wear records — separate measurement points, separate hour counters, separate remaining-life projections — is the change that lets a planner decide to reline chamber two at the next short stop and leave chamber one for the annual outage.

How Liner Wear Gets Measured — And How Accurate Each Method Really Is

Wear monitoring is the discipline that turns liner management from a purchasing exercise into an engineering one. The value is not the measurement itself but the trend: a series of readings against operating hours and tonnes ground, from which remaining life can be projected with enough confidence to plan a shutdown around it rather than guessing. Wear rate varies considerably with liner quality, clinker abrasiveness and how the mill has actually been operated, so a fixed calendar schedule is almost always either premature or late.

Each method below trades accuracy against effort. Most plants should be running at least two — one cheap and frequent, one precise and periodic — so the frequent method flags a change and the precise method quantifies it.

Manual Depth Gauge
Every entry · Low cost · Fixed reference points required
A depth gauge against marked reference points on selected lifters. Cheap, fast, and dependent entirely on measuring the same points the same way every time — which is precisely where undocumented manual programmes fall apart after two or three crew changes.
Ultrasonic Thickness Testing
Periodic · Moderate cost · Works on shell plates
Ultrasonic readings quantify remaining plate thickness where a gauge cannot reach the wear face. Effective for shell plate life and for confirming that a plate genuinely has another campaign left in it rather than assuming it does.
3D Laser Scanning
Each major outage · Higher cost · Full profile capture
Laser scanning captures the entire profile geometry rather than a handful of points, showing exactly how the face angle has migrated and where the wear front sits along the chamber. It is the only method that reveals uneven axial wear reliably.
Liner Weight Loss Tracking
At replacement · Very low cost · Retrospective only
Weighing removed liners against new casting weight gives a hard wear figure per campaign and a defensible benchmark for comparing suppliers and alloys. Retrospective by nature, so it informs the next order rather than the current one.
Power & Acoustic Signature
Continuous · Sensor-based · Indirect indicator
Mill sound and motor draw shift measurably as the charge stops cataracting and starts slipping. Continuous and requires no entry, but it indicates that something changed rather than by how much a specific lifter has worn.
Embedded Wear Sensors
Continuous · Capital investment · Selected liners only
Instrumented plugs mounted flush with the wear face erode at the same rate as the liner, giving continuous remaining-thickness data without opening the mill. Covers only the instrumented positions, so placement selection matters enormously.

Wear Trend Against Specific Power: The Chart That Justifies The Reline

The single most useful artefact a grinding department can produce is a chart with two lines on it: measured lifter height falling over operating hours, and specific power consumption rising over the same hours. Individually, each line is arguable. Together, they convert a maintenance request into a financial case, because they show the exact point where the liner stopped being a wear part and started being an energy cost.

Lifter Height Loss Against Specific Power Drift — Illustrative Campaign
100% 50% 0 hrs 3,000 6,000 9,000 Operating hours since relining Loss zone
Measured lifter height as percentage of nominal
Specific power consumption index at constant Blaine
Crossover point — profile degradation starts costing more than the liner set

The crossover point is the decision. Before it, the liner has useful life and relining early throws away paid-for metal. After it, every additional week of running is buying degraded grinding at full power cost — and the amount being lost usually exceeds the value of the remaining liner thickness well before the liner is mechanically finished. Plants that have this chart reline at the crossover. Plants that do not reline when the shutdown was already on the calendar, which is a coin flip against the true optimum.

Built For Cement Grinding Teams

See Your Own Liner Wear Curve Before You Commit To Anything

Bring your last two campaigns of measurement records and mill power data. We will build the wear trend, project remaining life on your current set, and show you where the crossover point sits on your mill — in a working session, not a slide deck.

Replacement Timing: Three Zones, Two Of Them Expensive

Every relining decision lands in one of three zones, and only one of them is where the money is. The zones are not defined by liner thickness alone — they are defined by the relationship between remaining thickness, measured wear rate, grinding performance and the outage calendar. A liner with thirty percent thickness remaining is fine if the wear rate is slow and the next planned stop is six weeks out, and it is a serious risk if the wear rate has accelerated and the next stop is four months away.

Zone A · Too Early
Usable Metal Scrapped
Liner removed with 25-40% of usable profile remaining
Full casting cost incurred for partial service life
Extra shutdown that grinding performance did not require
Crew hours and lifting equipment spent without a return
Zone B · Optimum Window
Reline On Evidence
Profile at or approaching the measured crossover point
Replacement aligned to an already-planned outage
Castings ordered against projected date, not emergency lead time
Specific power held inside target band throughout campaign
Zone C · Too Late
Grinding Paid For In Power
Weeks or months of elevated kWh per tonne at full output
Shell damage risk once metal is worn through locally
Emergency reline at premium lead time and overtime rates
Unplanned outage that displaces other maintenance work

Zone C also carries a failure risk that has nothing to do with efficiency. Rising mill noise, unusual vibration, and metal fragments appearing in the product are all late-stage indicators, and by the time they are visible the liner is often close to compromising the shell. Once a shell plate is damaged, the job stops being a liner replacement and becomes structural repair work with an outage length nobody planned for.

What A Liner Management System Actually Puts On The Screen

The reason liner data lives in spreadsheets at most plants is that no single system owned it. Wear readings sat with the mechanical crew, power data sat in the control system, casting invoices sat with procurement, and remaining-life judgement sat in one experienced person's head. A liner management layer pulls those into one asset record so the projection is calculated rather than recalled.

Mill 2 · Liner Asset Record
Campaign hours 6,240
Ch.1 Lifter Height
58%
of nominal — below threshold
Ch.2 Classifying Edge
71%
of nominal — within band
Projected Reline
11 wks
at current measured wear rate
SPC vs Baseline
+4.1%
at matched Blaine and feed
Wear rate trend

Accelerating
Casting lead time cover

Order now
Bolt torque compliance

Complete
Measurement point coverage

28 of 36 points

The operational value is not the dashboard, it is what the dashboard forces. A projected reline date eleven weeks out with casting lead time not yet covered is a procurement action today, not a discussion at the next planning meeting. A chamber one profile at 58 percent with accelerating wear and a specific power figure four percent above baseline is a costed argument for pulling the reline forward rather than a mechanical opinion. That is the difference between liner data and liner management.

Building The Wear Record: A Practical Starting Point

Plants that have never run structured liner monitoring often assume the first step is capital equipment. It is not. The first step is a repeatable measurement discipline that produces comparable numbers across crews and campaigns. Scanning technology improves precision, but precision on an inconsistent measurement grid produces a confident wrong answer.

01Mark permanent reference positions on selected lifters in both chambers
02Record new-condition baseline height and thickness at every marked point
03Log the operating hour and tonnage counter at each measurement event
04Photograph the leading edge of classifying liners at the same points each time
05Capture specific power at matched Blaine and feed rate alongside each reading
06Weigh removed liners at every reline against original casting weight
07Record alloy grade, supplier and heat number for every position installed
08Track bolt torque checks and any position showing movement under load
09Project remaining life after each reading and compare it to the outage calendar
10Review projected date against casting lead time before every planning cycle

Ten disciplined records against operating hours will tell a grinding department more about its liners than any single scan ever will, because wear rate is a slope and a slope needs points. Once the slope exists, every later decision — alloy change, profile change, reline timing, supplier comparison — has evidence behind it instead of recollection. Teams that want this structure set up against their existing mill hierarchy can reach the implementation team to scope it.

Where The Savings Actually Come From

It is worth being specific about the mechanism, because liner monitoring is often sold on avoided catastrophic failure and that is the smallest of the three returns. Catastrophic liner failure is rare in a well-run cement mill. The recurring money sits in three places, and each one compounds across every campaign rather than appearing once.

01
Energy
Grinding Held Inside Its Effective Band
Holding the profile inside its effective band instead of letting it degrade through the last third of every campaign protects several percentage points of specific power across thousands of operating hours. On a mill grinding at 38 kWh per tonne, a sustained few percent is a large annual number — and unlike a one-off project saving, it repeats every single campaign.

Recurs every campaign · Largest of the three returns
02
Liner Spend
Metal Bought Is Metal Used
Relining on measured remaining life instead of calendar convenience recovers the metal that early replacement throws away. A proper wear record also makes material trials measurable, which is the mechanism behind service life improvements above fifty percent when a mill moves from an unsuitable specification to a correct one. Without weight-loss and hour data, those trials cannot be judged and the plant simply reorders what it bought last time.

Compounds with every alloy and profile trial
03
Shutdowns
Reactive Jobs Become Scheduled Ones
A projected reline date known eleven weeks out converts an emergency into a plan — castings ordered at standard lead time rather than premium, crew and lifting equipment booked in advance, and the reline nested inside an outage that was already happening. The saving is not one invoice, it is the overtime, the expedited freight and the displaced maintenance work that never get incurred.

Removes premium lead time and unplanned outage cost
What The Wider Market Is Already Doing
22%
Operational cost reduction associated with digital monitoring and predictive wear analysis

18%
Share of facilities that have already adopted digital wear monitoring programmes

$3.29B
Projected metal mill liner market size by 2035 on smarter liner systems

4.8%
Forecast market CAGR through 2035 as predictive maintenance adoption widens
Plants building a liner wear record now are moving with a market trend, not ahead of one — and the ones without a record are the ones still relining on a calendar. Book a demo to see the record built on your own mill data.

Frequently Asked Questions

How often should cement mill liners actually be measured?
At minimum, at every mill entry — which in most cement plants means every planned stop where the chamber is opened for media top-up or diaphragm inspection, typically every four to eight weeks. Annual measurement is far too infrequent to build a usable wear slope, because a single point per year gives you an average across the whole campaign and hides any acceleration. The measurement itself takes a crew under an hour once permanent reference points are marked, so the constraint is discipline rather than time. Plants running two-chamber mills should measure both chambers independently, since they wear at genuinely different rates. To structure this against your own stop schedule, book a demo with our cement team.
Can we mix liner profiles or materials inside the same chamber?
Generally no, and it is a common source of avoidable trouble. Mixing profiles within one chamber disrupts the material flow and grinding action, producing uneven wear that shortens the life of the whole set rather than just the mismatched positions. Different chambers are a different question entirely — specifying a lift-focused profile and tougher alloy in chamber one alongside a classifying profile and harder alloy in chamber two is normal good practice, not mixing. Mixed materials at position level can occasionally be justified in specific high-wear zones such as inlet heads, but it should be a deliberate engineered decision with a wear record behind it. Our support team can review your current configuration against your duty.
Is high-chromium white iron always the better choice over manganese steel?
No — the answer depends on the impact and abrasion mix in that specific position and on your relining constraints. High-chromium white iron delivers superior abrasion resistance at hardness above 600 BHN, but it is brittle and vulnerable to tramp metal or heavy impact loading. Austenitic manganese steel work-hardens under repeated blows and handles impact far better, but it deforms dimensionally in service, and in a large mill a grown liner that will not release can extend a relining shutdown unpredictably. Chrome-moly alloy steel is frequently the operationally safer middle ground where the relining window is tight, because it holds its dimensions. Book a walkthrough to compare candidates against your wear history.
What are the earliest signs a liner is degrading grinding performance?
The earliest signal is almost always process rather than mechanical: specific power consumption drifting upward at constant Blaine and constant feed, or the feed rate quietly being trimmed to hold product fineness. Mill sound changes as the charge stops cataracting and begins to slip, which experienced operators often notice before any instrument flags it. Later-stage indicators include noticeable vibration, elevated noise, and metal fragments appearing in the product, and by that point the liner is often close to compromising the shell. The practical point is that the process signal appears months before the mechanical one, which is why power data and wear readings belong in the same record. Talk to support about connecting both streams.
Do we need laser scanning, or is manual measurement enough to start?
Manual measurement is enough to start, and starting matters more than precision. A depth gauge against permanently marked reference points, logged against operating hours and tonnage, will produce a usable wear slope and a defensible remaining-life projection within two or three readings. Laser scanning adds real value later by capturing full profile geometry and revealing uneven axial wear that point measurements miss, which becomes important once you are running material or profile trials. The failure mode to avoid is buying precision technology while leaving the measurement grid and record-keeping inconsistent, because a precise reading on a moving reference point is worse than a rough reading on a fixed one. Book a demo to see how the record is structured.
Cement Plant Grinding Intelligence

Stop Relining On The Calendar. Start Relining On The Curve.

iFactory builds your mill liner asset record — profile specification, measurement points, wear trending against operating hours, and remaining-life projection tied to your outage calendar and casting lead times. Configured against your existing mill hierarchy, with your data, in a working session.
Share This Story, Choose Your Platform!