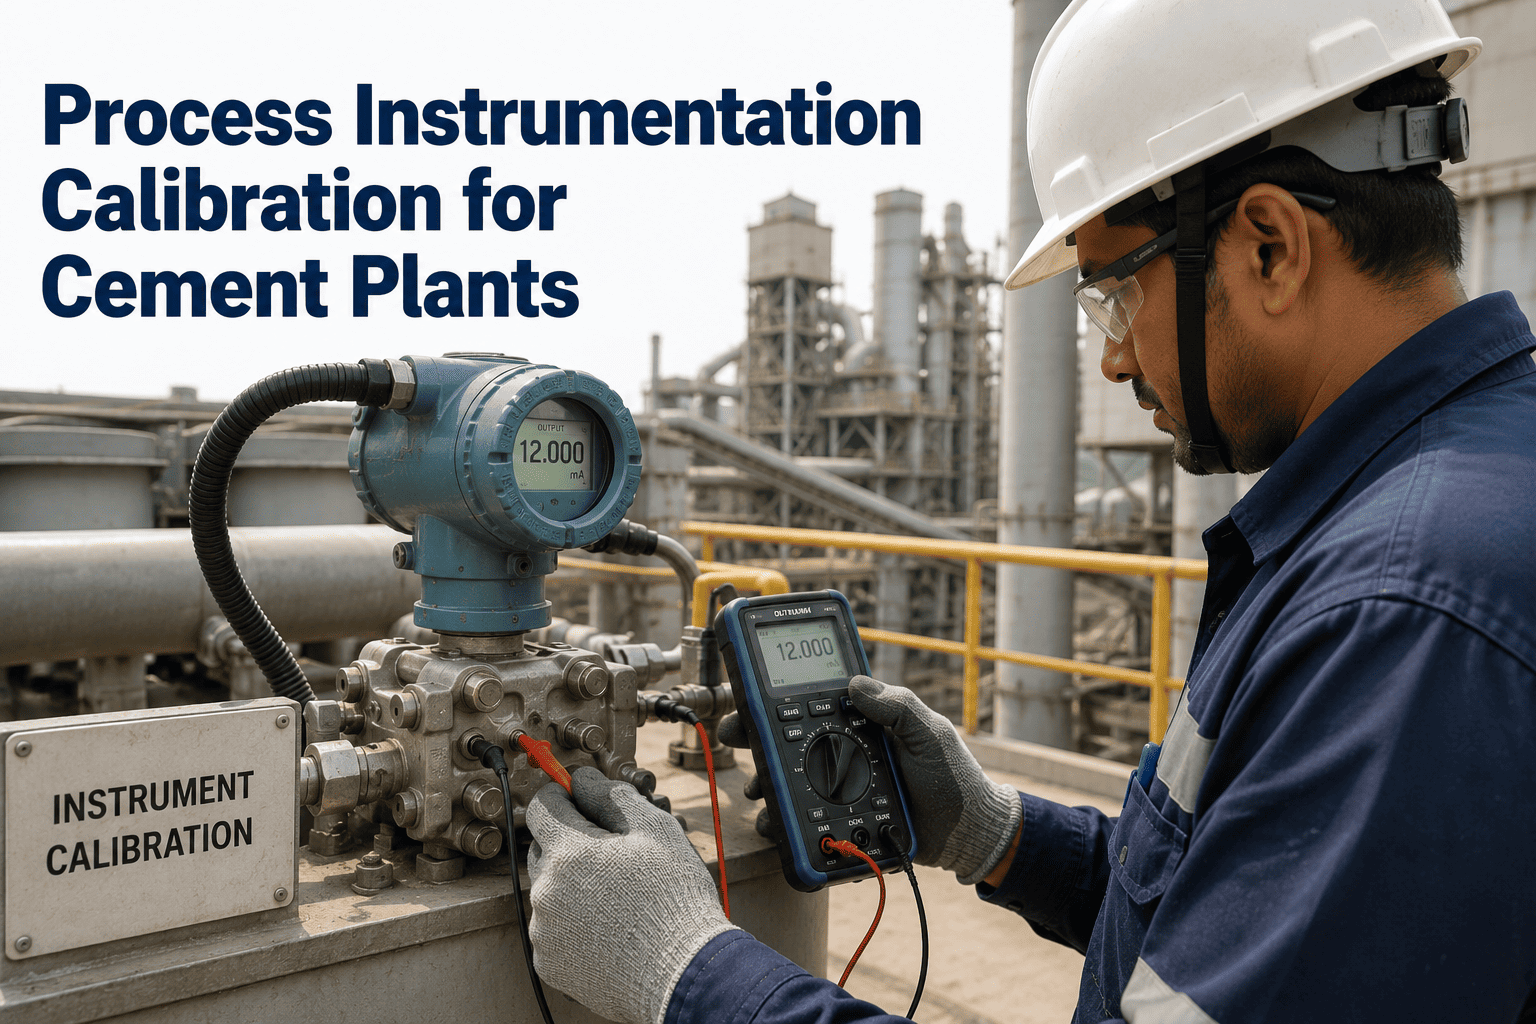
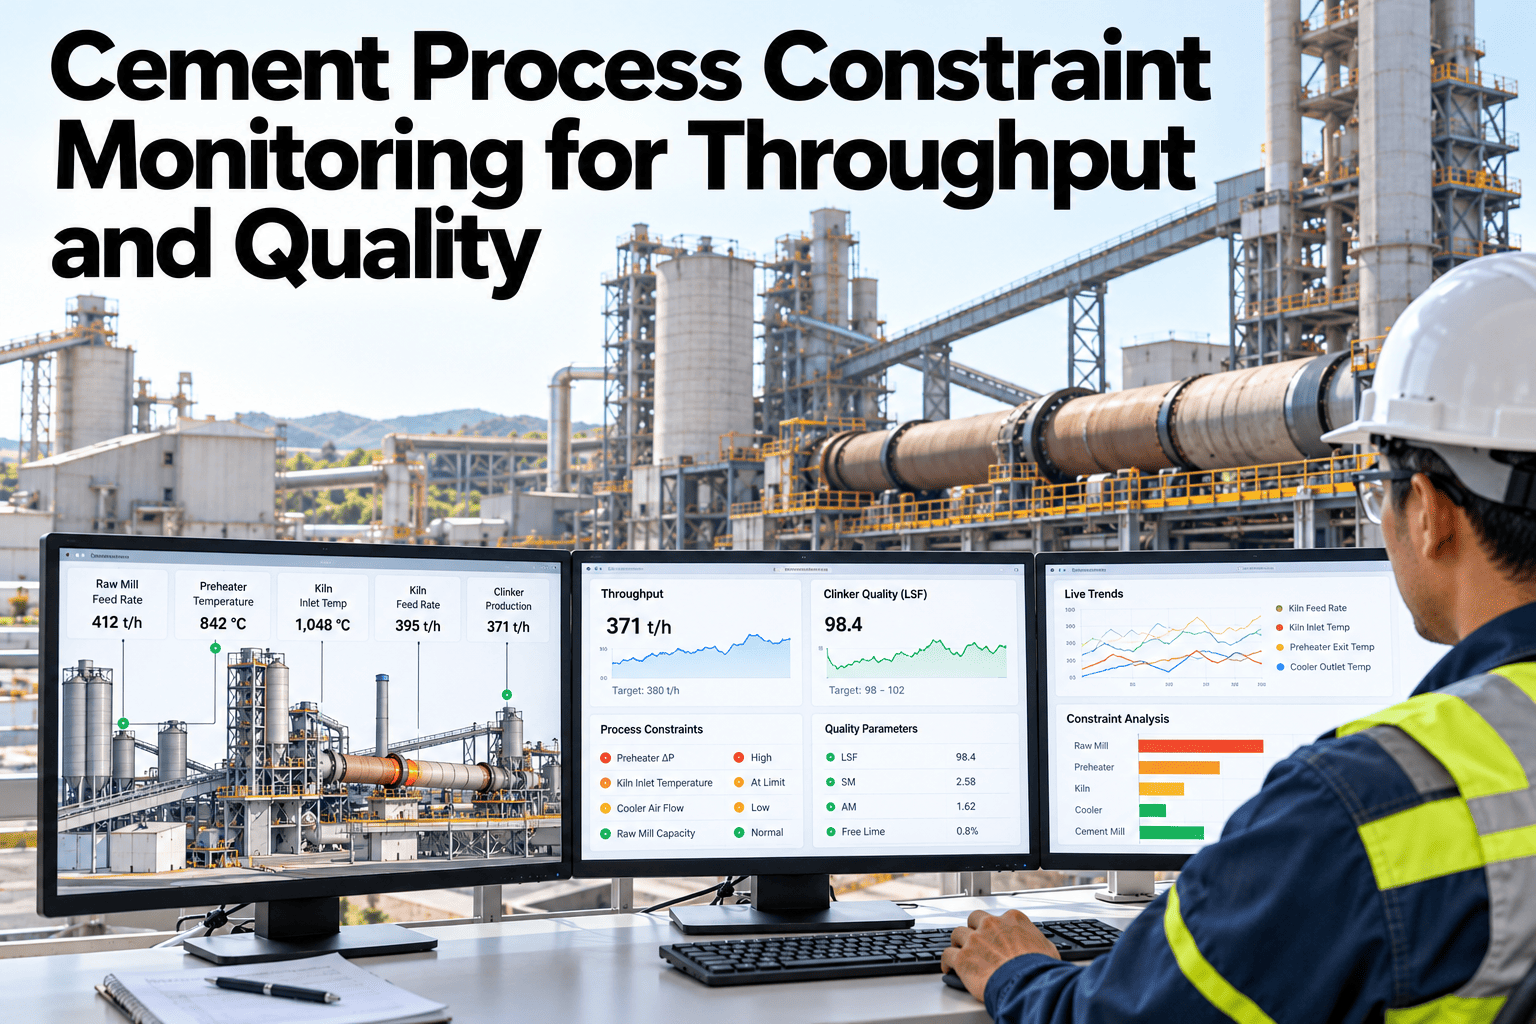
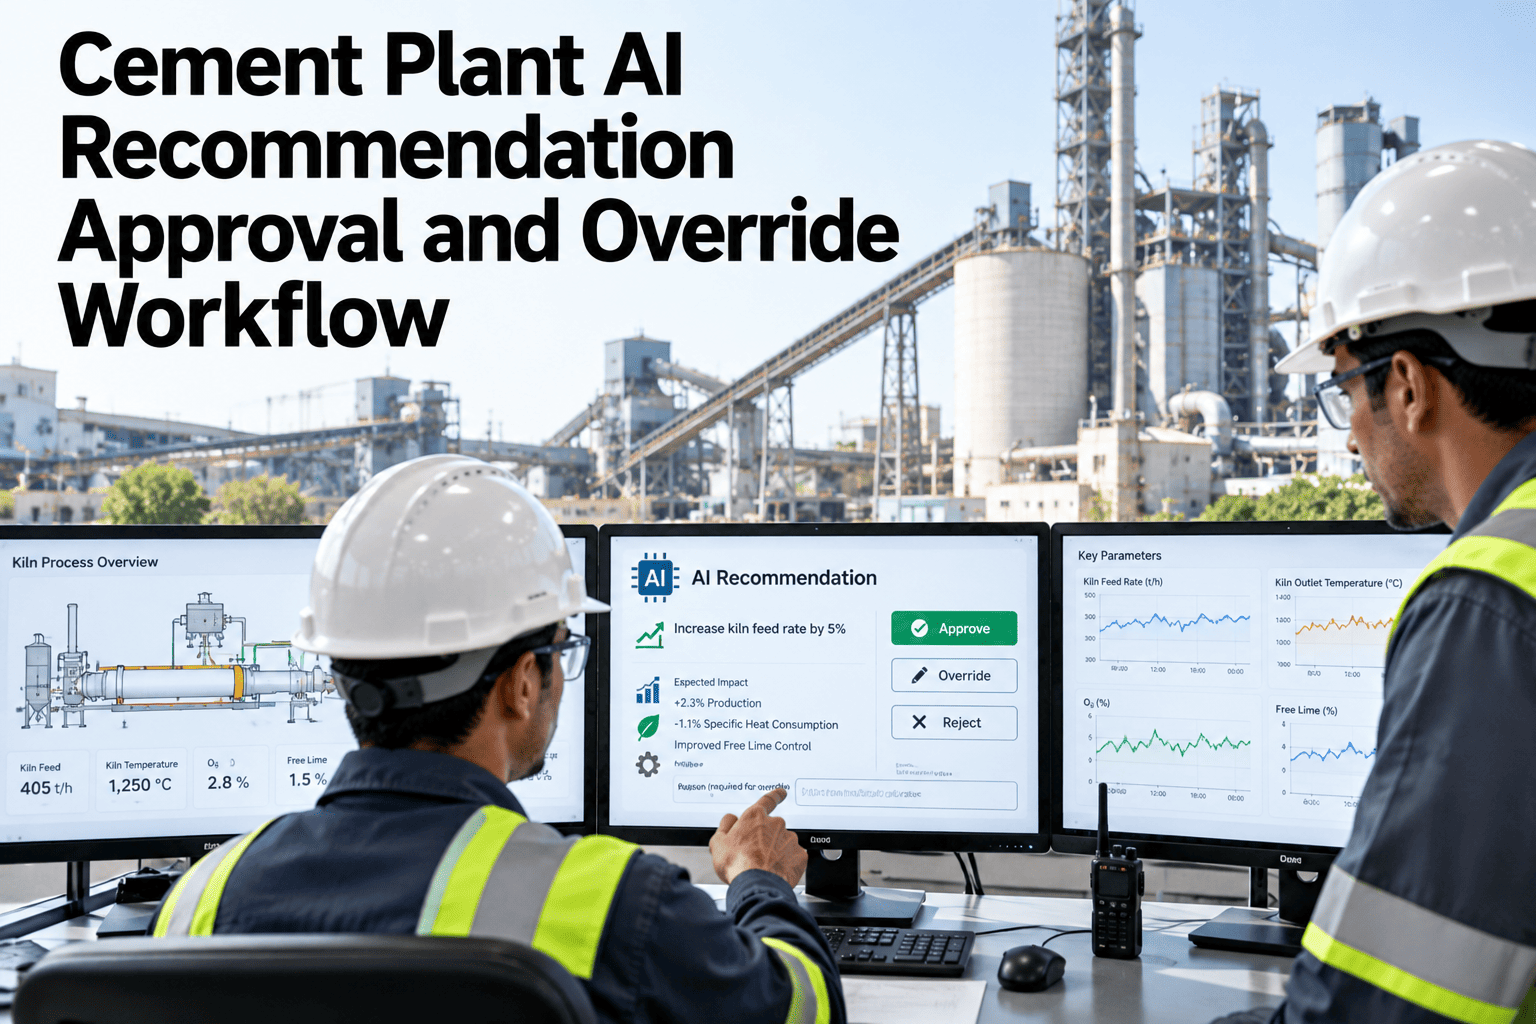
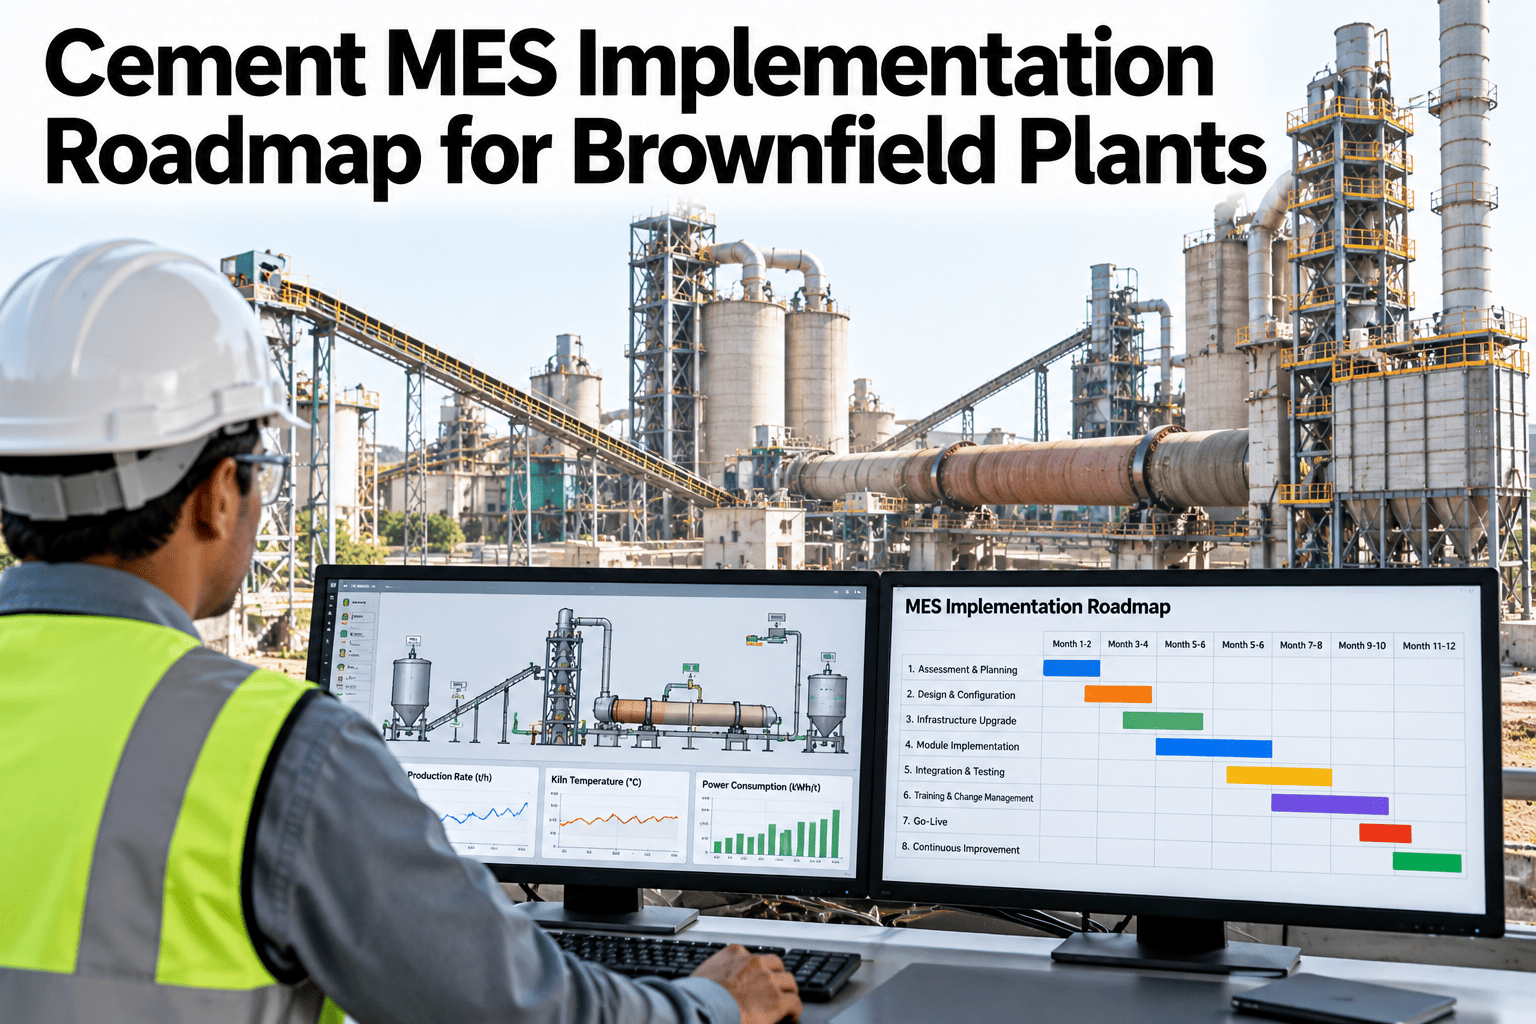
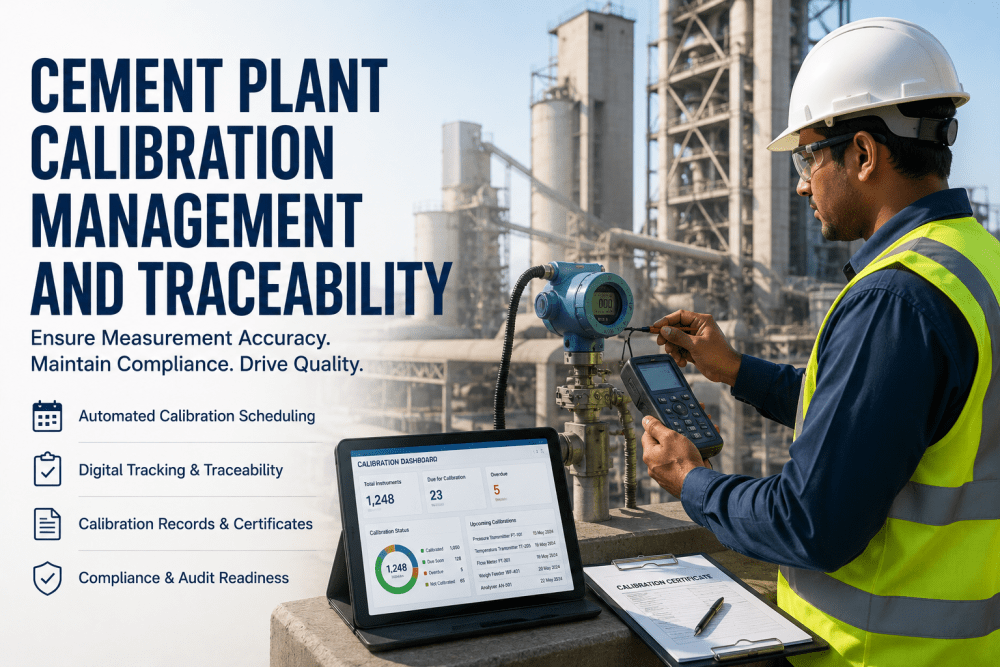
A cement plant runs on numbers it never sees directly — kiln inlet temperature, preheater draft pressure, raw meal flow, clinker cooler bed depth — every one of them arriving through a transmitter that quietly drifts a little further from true with each passing month. A typical production line carries several hundred field instruments across pressure, temperature, flow, level, and gas analysis, and at any given time a meaningful share of them are reading outside their calibrated tolerance without anyone knowing it, because drift produces no alarm of its own. The plant keeps running, the control loops keep adjusting, and the deviation stays invisible until a quality excursion, an emissions exceedance, or a failed audit traces the root cause back to a transmitter that should have been recalibrated months earlier. See how iFactory turns your calibration records into a live, risk-ranked schedule instead of a static spreadsheet nobody checks.
PROCESS INSTRUMENTATION · CEMENT · CALIBRATION MANAGEMENT
Process Instrumentation Calibration — Find the 15–25% of Instruments Already Out of Tolerance
iFactory tracks calibration due dates, historical drift, and instrument criticality across every pressure, temperature, flow, level, and analytical device in the plant, replacing fixed calendar intervals with a schedule built around what each instrument has actually done.
300–500
field instruments per production line
15–25%
typically outside calibration tolerance at any time
4
criticality tiers used to prioritize calibration frequency
THE DRIFT PROBLEM
Why Calibration Drift Is the Quietest Risk in the Plant
Instrument drift is a fact of physics, not a sign of poor equipment. Vibration, thermal cycling, process fluid abrasion, and the simple passage of time all pull a transmitter's output gradually away from the true process value, and the gap grows without producing any alarm of its own because the control system has no independent way of knowing the reading is wrong. A pressure transmitter reading two percent high on a kiln draft loop does not trip a fault code — it just causes the control loop to hold a slightly different operating point than the operator believes it is holding, day after day, until either a scheduled calibration catches it or a downstream consequence forces the investigation. The instruments carrying the highest consequence when this happens are not evenly distributed across the plant, which is exactly why a single fixed calibration interval applied to every device, regardless of its role, wastes effort on low-risk instruments while under-serving the ones that actually drive safety, quality, and compliance outcomes.
15–25%
of field instruments at a typical cement plant are outside calibration tolerance at any given time, most going undetected until an upset investigation.
300–500
field instruments per production line — pressure, temperature, flow, level, gas analysis, and weigh feeders — each one a potential drift source.
Silent
is the operative word for drift — it produces no fault code and no alarm, only a slowly diverging process value that looks normal on the trend screen.
WHERE MEASUREMENT MATTERS MOST
The Instrument Families Driving Kiln, Cooler, and Grinding Performance
Every process area of a cement plant depends on a different mix of instrument types, and the calibration priority for each family should reflect what happens downstream when that specific measurement drifts.
Temperature — Kiln & Preheater
RTDs and thermocouples across the preheater tower and kiln shell inform burning zone control and refractory protection, and a drifted reading here risks both clinker quality and refractory life if the true temperature runs hotter than displayed.
Pressure — Draft & Cooler
Preheater and cooler draft pressure transmitters govern combustion air balance and ID fan control, and calibration drift here quietly shifts the pressure profile across the pyroprocessing line without triggering any obvious operational symptom.
Flow — Raw Meal & Fuel
Mass flow measurement on raw meal feed and alternative fuel dosing directly determines clinker chemistry and combustion stability, making these among the highest-consequence calibration points on the quality side of the plant.
Level — Silos & Hoppers
Level instruments on raw meal silos, clinker storage, and cement silos prevent both overfill and run-dry conditions, and a drifted level reading can trigger an unnecessary trip or, worse, mask an approaching material outage.
Gas Analyzers — CEMS
Continuous emissions monitoring analyzers carry the highest regulatory consequence of any instrument category in the plant, since a drifted analyzer can produce a reportable exceedance or invalidate compliance data for the affected period.
Weigh Feeders — Quality Control
Weigh feeder accuracy on raw materials and cement additives determines batch-to-batch consistency, and drift here shows up gradually as increased quality variability long before anyone traces it back to feeder calibration.
FOUR CRITICALITY TIERS
Not Every Instrument Deserves the Same Calibration Frequency
A risk-based calibration program starts by sorting every instrument into a criticality tier, because the cost of a missed calibration on a safety-critical sensor is not remotely comparable to the cost of a missed calibration on an indication-only gauge with no control function.
TIER 1
Safety & Regulatory
CEMS analyzers, safety instrumented system sensors, and pressure relief device instrumentation. Shortest calibration interval, zero tolerance for missed due dates, and any deviation treated as a compliance-level finding requiring documented investigation.
TIER 2
Quality-Critical
Online analyzers, weigh feeders, and kiln and cooler temperature sensors that directly determine clinker chemistry and product consistency. Calibrated on a tighter interval than general process instruments, with drift trends reviewed as part of routine quality assurance.
TIER 3
Process Control
The bulk of field instruments across pressure, flow, and level that feed control loops without a direct safety or quality consequence on their own. Standard risk-based interval driven by historical drift performance rather than a fixed default.
TIER 4
Monitoring Only
Indication-only instruments with no control function, where an extended calibration interval carries minimal operational risk, freeing calibration technician hours to focus on the higher tiers where drift actually matters.
FIXED VS RISK-BASED SCHEDULING
What Changes When Calibration Intervals Follow Data Instead of the Calendar
Most cement plants still run calibration on a fixed calendar interval applied uniformly across every instrument type, largely because building and maintaining a risk-based schedule by hand across several hundred devices is impractical without a dedicated system.
Stop Calibrating on the Calendar — Start Calibrating on Risk
iFactory ranks every instrument by criticality and drift history, so your calibration team spends its limited hours on the transmitters that actually threaten safety, quality, or compliance first.
WHERE THIS PLAYS OUT
Situations a Risk-Based Calibration Program Catches Early
A CEMS Analyzer Trending Toward Its Tolerance Limit
As-found calibration data across several cycles shows a continuous emissions analyzer drifting in a consistent direction, even though each individual reading still falls within tolerance. Recognizing the trend allows the calibration team to shorten that specific analyzer's interval proactively, avoiding a future exceedance that a fixed annual schedule would not have caught in time.
A Weigh Feeder Behind an Unexplained Quality Variance
Product quality data shows increased variability in a specific cement blend over several weeks, and cross-referencing against calibration records identifies a weigh feeder approaching the end of its interval with a history of higher-than-average drift. Recalibrating that feeder resolves the variance without a broader process investigation.
A Missed Due Date Surfaced Before an External Audit
A routine internal review ahead of a regulatory audit surfaces a Tier 1 pressure instrument whose calibration due date passed several weeks earlier without anyone noticing under the previous manual tracking process. Catching it before the audit rather than during it turns a potential finding into a routine correction.
Reallocating Technician Hours During a Turnaround Window
With every instrument ranked by tier and days until due, the calibration team plans a turnaround calibration campaign that prioritizes every Tier 1 and Tier 2 instrument due within the next quarter, rather than working through instruments in whatever order they happen to be encountered on the plant floor.
WHY INSTRUMENTS DRIFT
The Root Causes Behind Each Instrument Family's Drift Pattern
Drift is not random — each instrument type tends to drift for reasons tied to its measurement principle and installed environment, and recognizing the pattern helps a calibration team decide whether a shortened interval, a design change, or simply a more frequent inspection is the right response.
Thermocouples & RTDs
Repeated thermal cycling near the kiln and preheater gradually degrades the sensing element, producing a slow, predictable drift that tends to accelerate as the sensor approaches end of life, making trend-based replacement timing more reliable than a fixed interval alone.
Pressure Transmitters
Vibration from nearby fans and rotating equipment loosens process connections and stresses the sensing diaphragm over time, a mechanical drift mechanism that calibration alone corrects but does not prevent from recurring on the same interval.
Flow Meters
Buildup of raw meal or fine dust inside the measurement path gradually biases the reading, particularly on differential pressure and vortex-type meters, meaning drift here often tracks more closely with process fouling than with elapsed calendar time.
Gas Analyzers
Sensor cell degradation and sample line contamination both push CEMS analyzer readings off true gradually, which is why span and zero checks between full calibrations catch drift on a shorter cycle than the full calibration interval alone would allow.
BUILDING THE PROGRAM
Standing Up a Risk-Based Calibration Program From Scratch
Plants moving off a fixed calendar interval for the first time generally follow the same sequence, whether the transition happens over a single quarter or is phased in gradually across the instrument population.
STEP 1
Inventory and Tag Every Instrument
Build a complete instrument list from the CMMS, P&IDs, and a physical walk-down, since a risk-based schedule is only as good as its underlying inventory and missing instruments cannot be prioritized if they are not recorded in the first place.
STEP 2
Assign Criticality Tiers
Work with process and instrumentation engineering to classify each instrument into its safety, quality, control, or monitoring tier, since this classification drives every downstream scheduling decision the program will make.
STEP 3
Import Historical Calibration Records
Pull in as much prior as-found and as-left data as exists, since even a partial history gives the drift-trending analysis a head start compared to building every instrument's profile from zero going forward.
STEP 4
Phase In Risk-Based Intervals
Start with Tier 1 instruments, where the consequence of getting the interval wrong is highest, then extend the same risk-based approach to Tier 2 and Tier 3 instruments as confidence in the process and the underlying data grows.
FREQUENTLY ASKED QUESTIONS
What Instrumentation Teams Ask About Risk-Based Calibration
How is each instrument assigned to a criticality tier initially?
The initial tier assignment starts from the instrument's role in the process — whether it feeds a safety instrumented system, a regulatory-reportable measurement, a quality-determining loop, or a general process control loop — combined with input from your instrumentation and process engineering teams during the setup phase. Once assigned, the tier can be revisited if an instrument's role in the process changes, such as when a new control strategy elevates a previously lower-tier measurement to a more critical function.
Book a demo to see how tier assignment works against your specific instrument list.
Does risk-based scheduling replace the interval requirements set by our internal quality or regulatory standards?
No. Where a regulatory requirement or an internal quality standard mandates a maximum calibration interval, such as for CEMS analyzers under emissions permit conditions, that maximum interval is respected as a hard ceiling regardless of drift history. Risk-based scheduling operates within those mandated limits, using historical drift data to shorten intervals proactively where warranted rather than ever extending an interval beyond what the applicable standard permits.
Contact support to confirm how mandated intervals are configured for your compliance requirements.
What happens to historical calibration records from before the platform was adopted?
Historical as-found and as-left calibration data can be imported from existing CMMS records, calibration management software exports, or digitized paper certificates, giving each instrument a running history rather than starting from a blank slate. The more historical data available at setup, the sooner the drift-trending analysis has enough data points to produce a meaningful risk-based interval recommendation for that specific instrument.
Book a demo to discuss migrating your existing calibration history.
How does the platform flag an instrument that is due for calibration?
Each instrument's next due date is calculated from its assigned interval and last completed calibration, and the platform surfaces upcoming due dates on a rolling basis so the calibration team can plan work ahead of time rather than discovering an overdue instrument during a periodic manual review. Instruments approaching their due date are ranked by criticality tier, ensuring a Tier 1 instrument due next week is never buried beneath a longer list of lower-priority Tier 4 devices.
Talk to support about how due date visibility is displayed for your calibration team.
Can this integrate with the calibration equipment and reference standards our technicians already use?
Yes. The platform is designed to record calibration results regardless of which reference standard or calibration equipment your technicians use in the field, whether that is a dry block temperature source, a deadweight tester for pressure, or a certified flow rig. The focus is on capturing the as-found and as-left values consistently against each instrument's record, not on replacing the calibration equipment itself.
Book a demo to walk through your current calibration workflow and equipment.
Your Kiln Is Only as Well Controlled as the Transmitters Feeding It
iFactory replaces the fixed calendar with a live, risk-ranked calibration schedule so drift gets caught before it becomes a quality excursion or a compliance finding.